Big Ideas Math Algebra 1 Student Journal 1st Edition Chapter 4 Writing Linear Functions Exercise 4.2
Page 101 Essential Question Answer
We have to explain how we use a slope and the point to write an equation.
We can use the point-slope form and represent an equation. The point-slope form is y=mx+b,
We put the value of x, and y from the given point and put the value of the given slope to find the value of constant′ b′.
Then put these values in the point-slope form of the equation, Then er get the required equation.
To write an equation of a line when you are given the slope and a point on the line by using the point-slope form of the line.
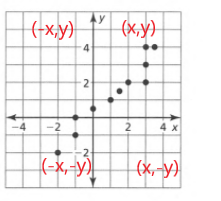
Page 101 Exercise 1 Answer
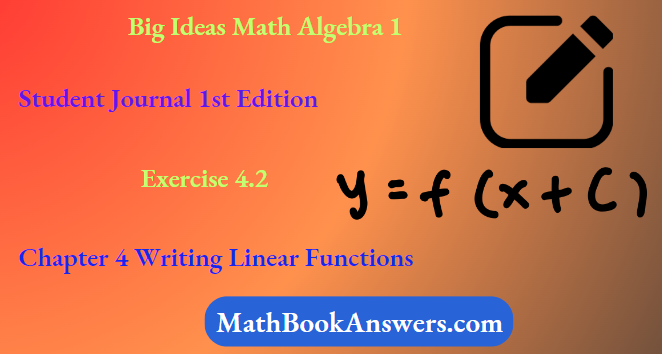
Given: The slope is \(m=\frac{1}{2}\) and the point is given below

To find Sketch the line that has the given slope and passes through the given point. Find the y-intercept of the line. Write an equation of the line.
Summary: Identify the point and substitute it and the slope in the point-slope equation. Find the y-intercept by putting x=0 in the equation and solving for y. Plot the point and the intercept and join to get the graph.
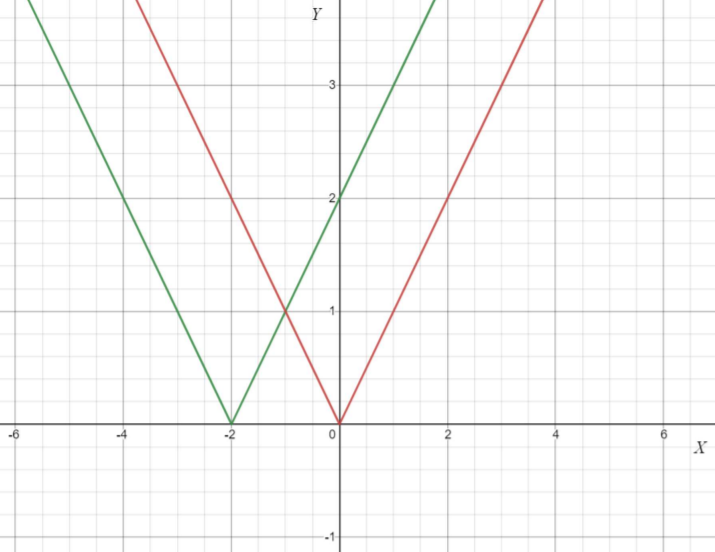
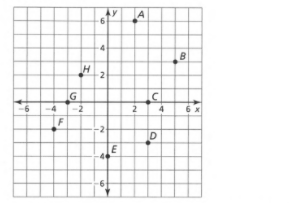
From the graph

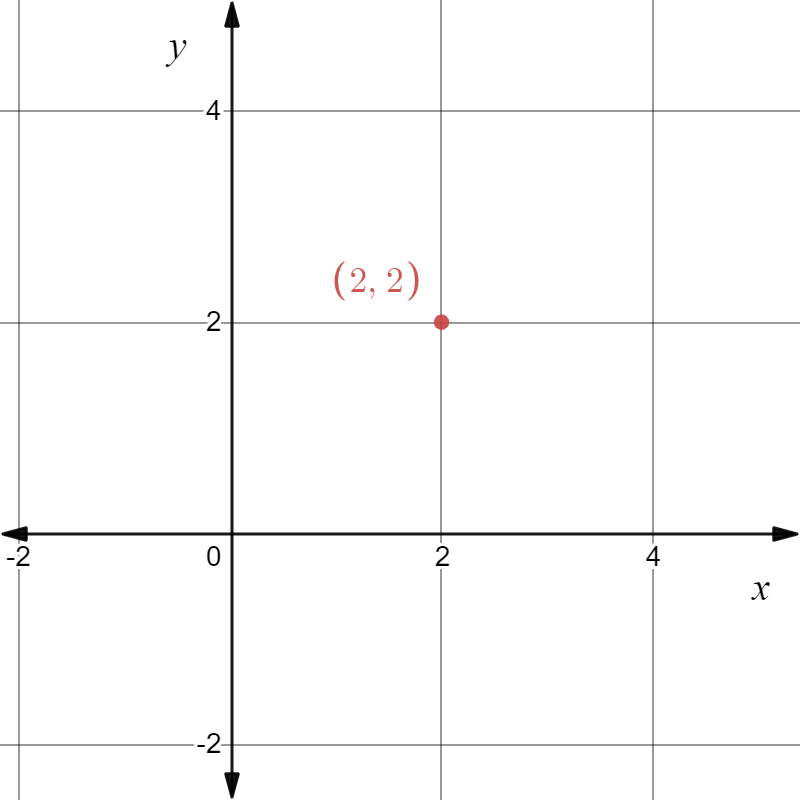
The point is (x1,y1)=(3,2). Given the slope is \(m=\frac{1}{2}\). Substituting the values in the point-slope equation,
y−y1=m(x−x1)
y−2=\(\frac{1}{2}\)(x−3)
y-2\(=\frac{x}{2}-\frac{3}{2}\)
y\(=\frac{x}{2}-\frac{3}{2}\)+2
y\(=\frac{x}{2}+\frac{1}{2}\)
Put x=0 in y\(=\frac{x}{2}+\frac{1}{2}\).
y=0+\(-\frac{1}{2}\)
y=\(-\frac{1}{2}\) which is the y -intercept.
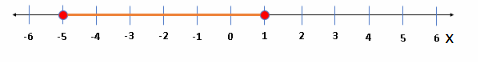
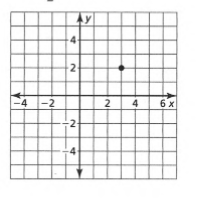
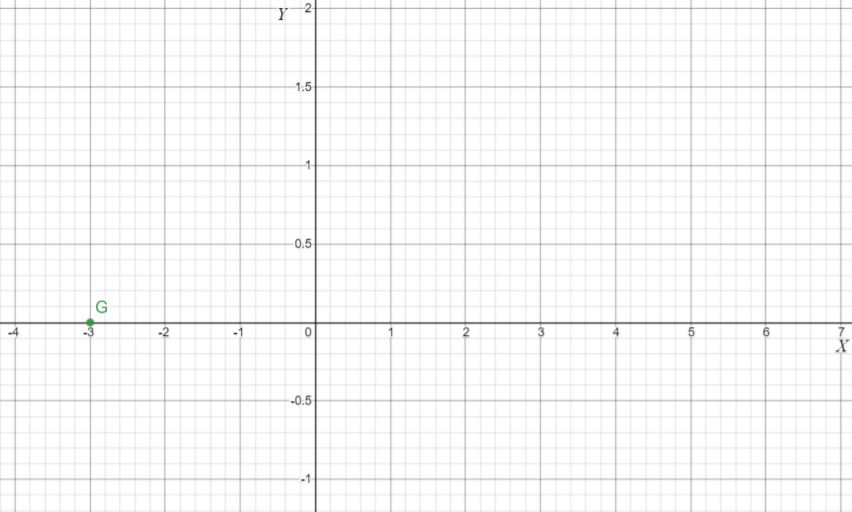
Plot the points (0,\(-\frac{1}{2}\)),(3,2) and join to get the graph.

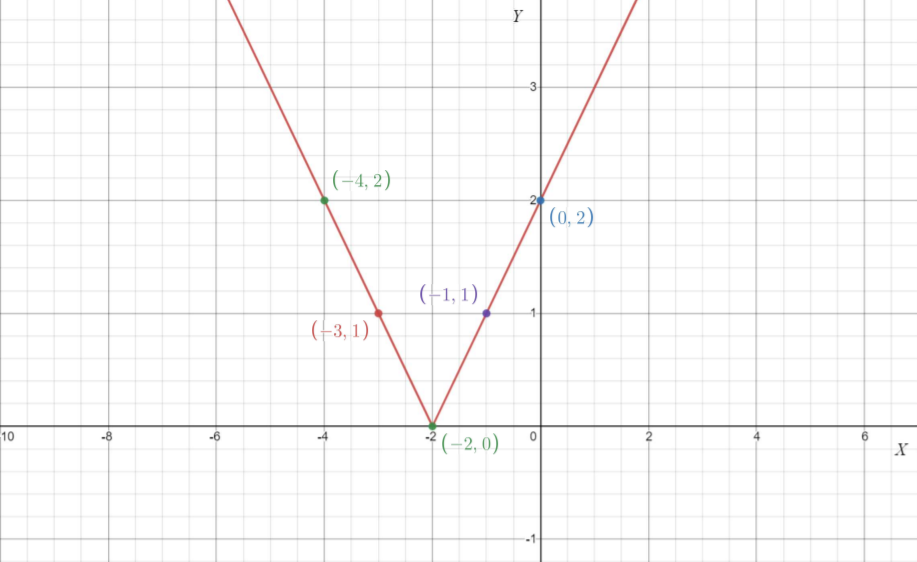
Given the point as
And the slope m=\(-\frac{1}{2}\)
The equation of the line is y\(=\frac{x}{2}+\frac{1}{2}\) and the y intercept is \(-\frac{1}{2}\). The graph is as follows.
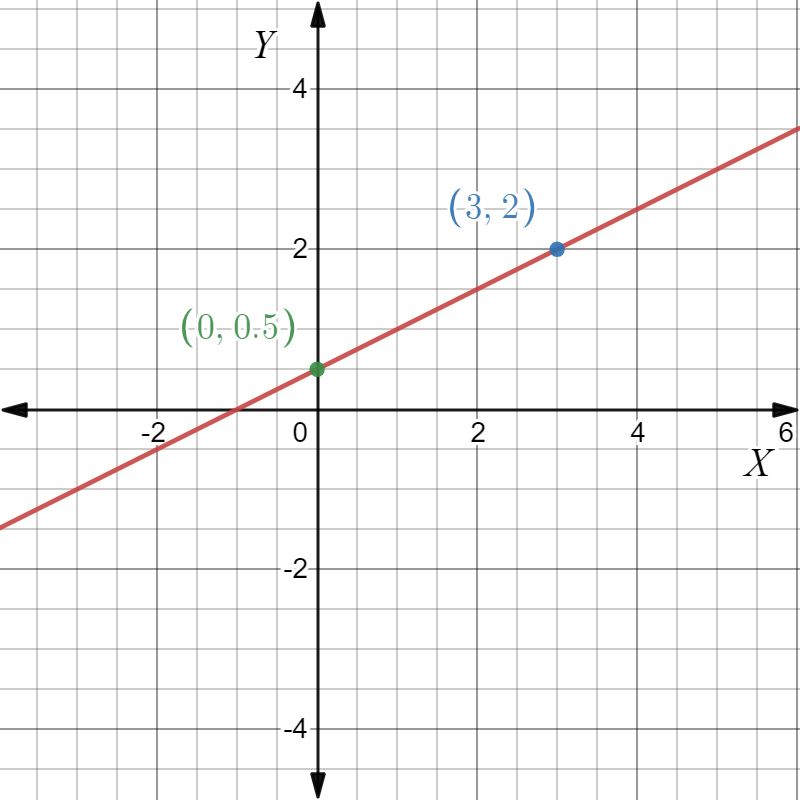
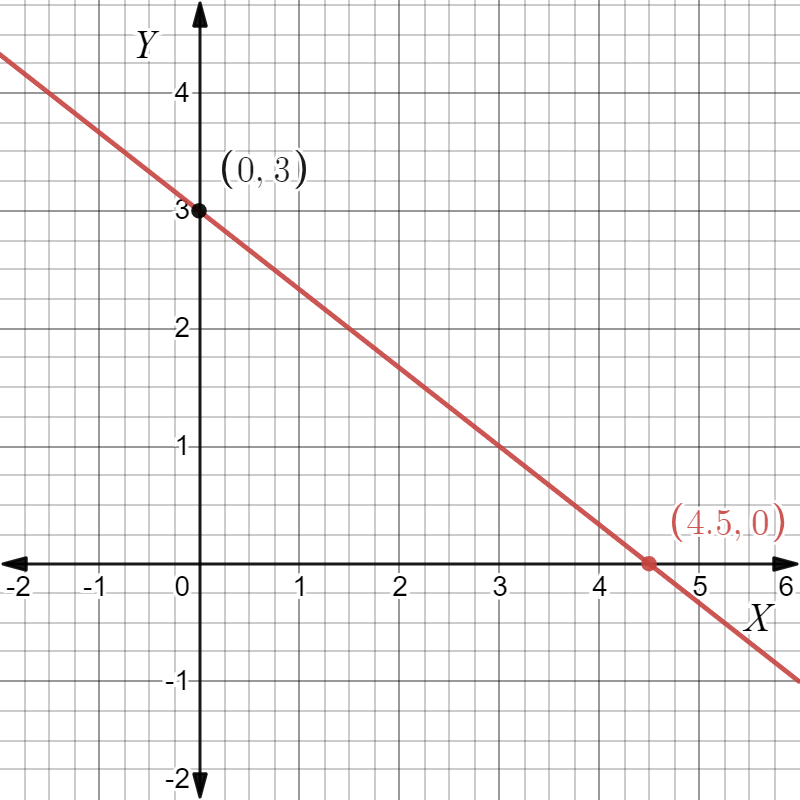
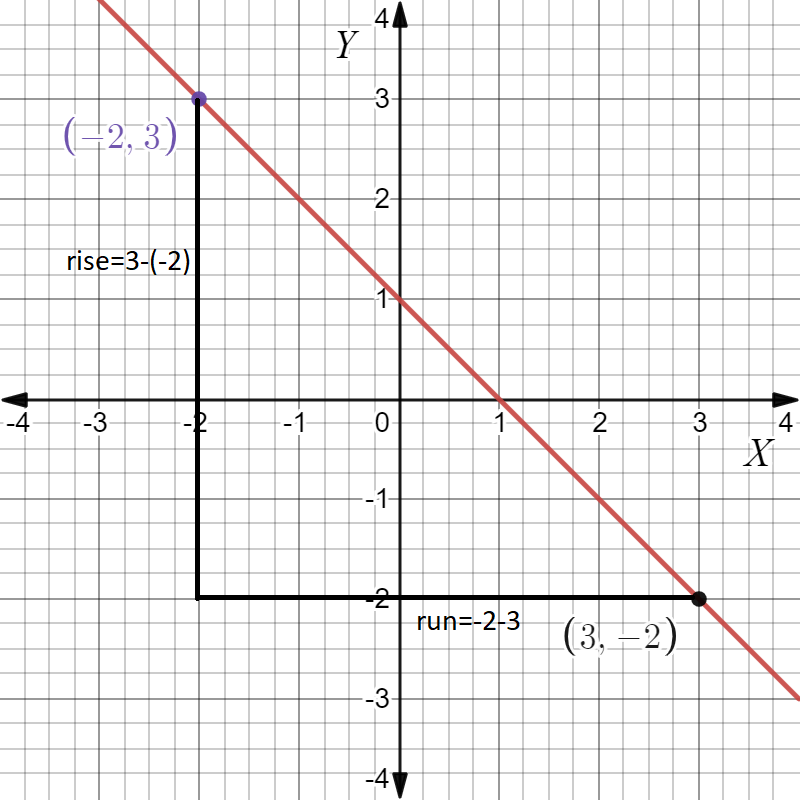
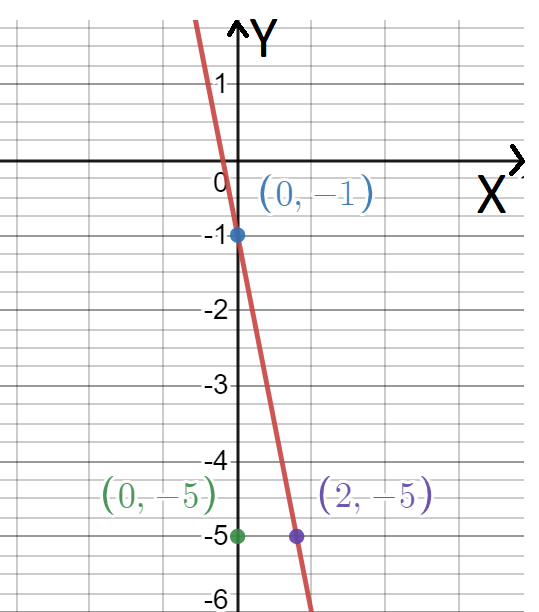
Given: The point as in the graph, and the slope as m=−2.

To find Sketch the line that has the given slope and passes through the given point. Find the y-intercept of the line. Write an equation of the line.
Summary: Identify the point and substitute it and the slope in the point-slope equation. Find the y-intercept by putting x=0 in the equation and solve for y. Plot the point and the intercept and join to get the graph.
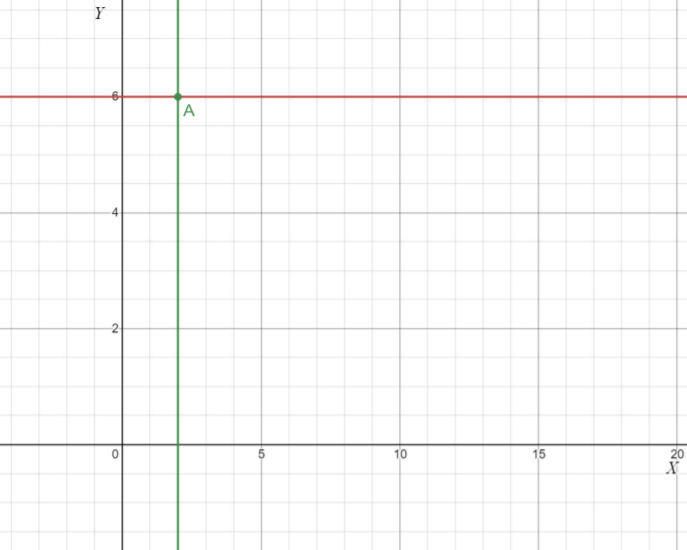
From the graph
The point is (x1,y1)=(−4,6). Given the slope is m=−2. Substitute in the point-slope equation
y−y1=m(x−x1)
y−6=−2(x−−4)
y−6=−2x−8
y=−2x−8+6
y=−2x−2
Put x=0 in this,
y=−2(0)−2
y=−2
which is the y-intercept.
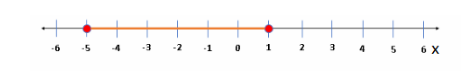
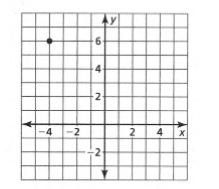
The points are (−4,6),(0,−2). Plot and join them.
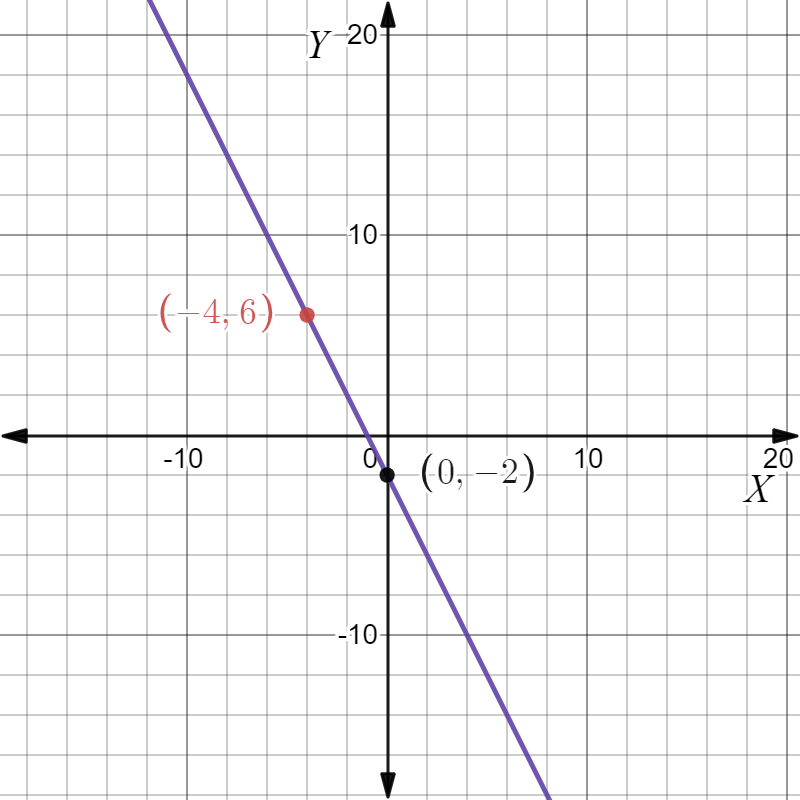
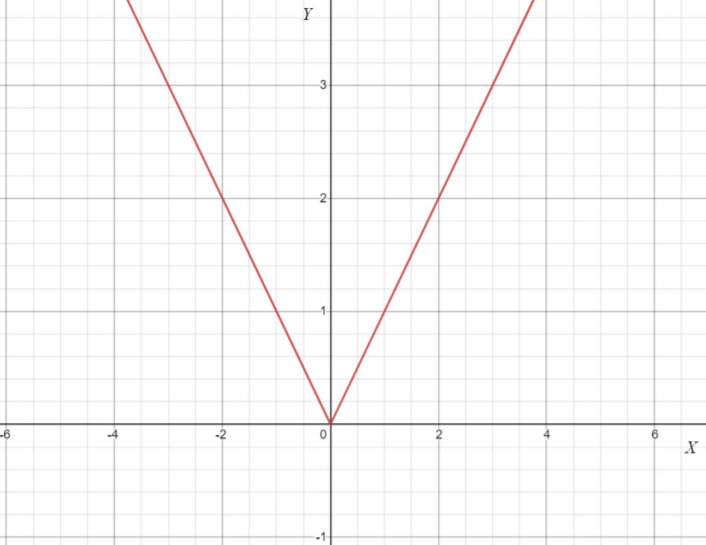
Given the point as in the Graph and the slope as m=−2.

The equation of the line is y=−2x−2 and the y-intercept is −2. The graph is given below.

Big Ideas Math Algebra 1 Chapter 4 Exercise 4.2 Solution
Big Ideas Math Algebra 1 Student Journal 1st Edition Chapter 4 Writing Linear Functions Exercise 4.2 Page 101 Exercise 2 Answer
Given the graph

The slope is given by, m\(=\frac{y-y_1}{x-x_1}\)
Cross multiplying we get the point-slope equation of a line. y−y1 =m(x−x1).
Given a non vertical line and a point on it as below
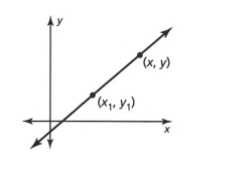
The slope is given by m\(=\frac{y-y_1}{x-x_1}\) and the point-slope equation of the line is y−y1=m(x−x1).
Page 102 Exercise 3 Answer
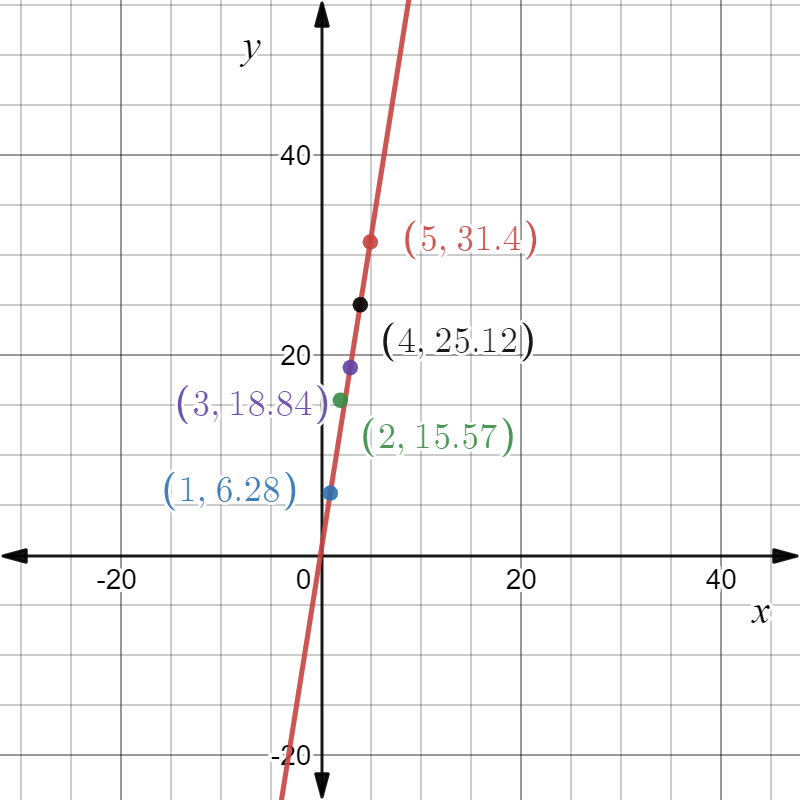
Given, we have saved $25 per month. And now we have $175 in our savings account.
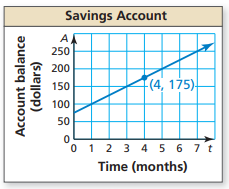
It is required to write an equation that represents the balance A after t months. To do this, use the result from Exploration 2:
y−y1=m(x−x1), where m is slope and line passes through the point (x1,y1).
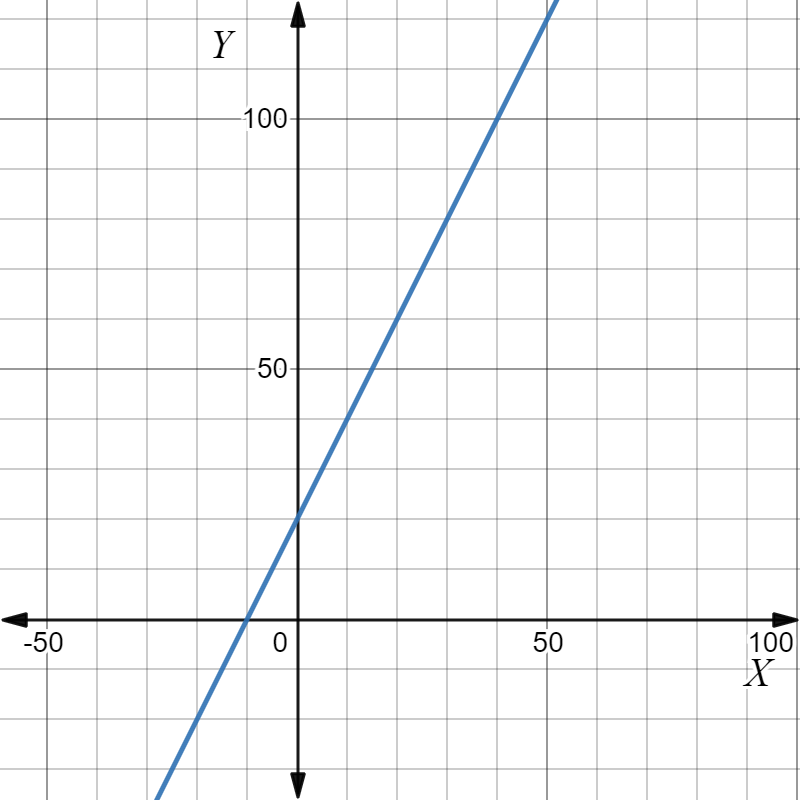
Consider the graph Savings Account.

Let (x1,y1)=(4,175).
Since we have saved $25
per month. Thus, let it be m=25.
Now, consider the result from Exercise 2: y−y1=m(x−x1), Where m is slope and line passes through the point (x1,y1).
Substitute (x1,y1)=(4,175)and m=25. Replace x with t and replace y with A.
We have y−y1=m(x−x1)
⇒A−175=25(t−4)
⇒A=25t−100+175
∴A=25t+75
The equation is A=25t+75.
An equation that represents the balance A after t months is A=25t+75.
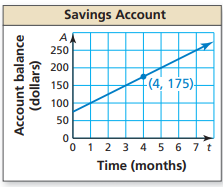
Given, An equation that represents the balance A after t months is A=25t+75.
It is required to verify the above equation by using the graphing calculator.
To do this, use the graphing calculator TI−84 Plus to plot the graph of the equation. And then verify with the given graph in Exercise 3.
Consider the equation that represents the balance A after t months is A=25t+75.
Let’s graph it by using the graphing calculator Tl−84 Plus.
On the calculator press Y=, and then enter the expression 25x+75 in Y1=.
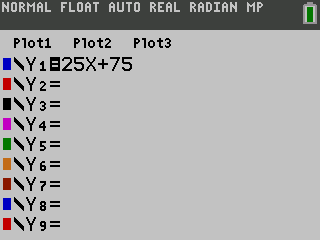
Now, to see its graph press GRAPH key on the calculator.
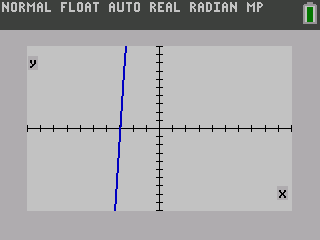
Let’s adjust the window view.
Press the window key and change it to a graph in Exercise 3.
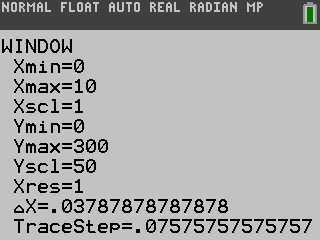
Now, press GRAPH key on the calculator.

Therefore, the graph of y=25x+75 using a graphing calculator is similar to the given graph in Exercise 3.
A graph of the equation A=25t+75 that represents the balance A after t months by using a graphing calculator is given below.
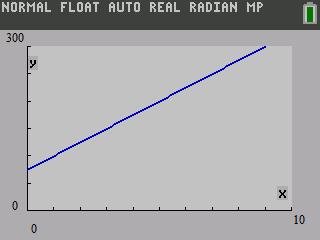
And it is similar to the given graph in Exercise 3.
Writing Linear Functions Exercise 4.2 Big Ideas Math
Big Ideas Math Algebra 1 Student Journal 1st Edition Chapter 4 Writing Linear Functions Exercise 4.2 Page 102 Exercise 4 Answer
We know that the slope of a line is the ratio of the difference in the coordinates to the difference in the coordinates of any two points on it. Let be a point on the line whose slope is. Let be an arbitrary point on the line.
Then the slope is given by, m\(=\frac{y-y_1}{x-x_1}\)
Cross multiplying we get the point-slope equation for the line.
y-y1=m(x-x1).
Given a point (x1,y1)on the line whose slope is m, the point-slope equation of the line is y−y1=m(x−x1).
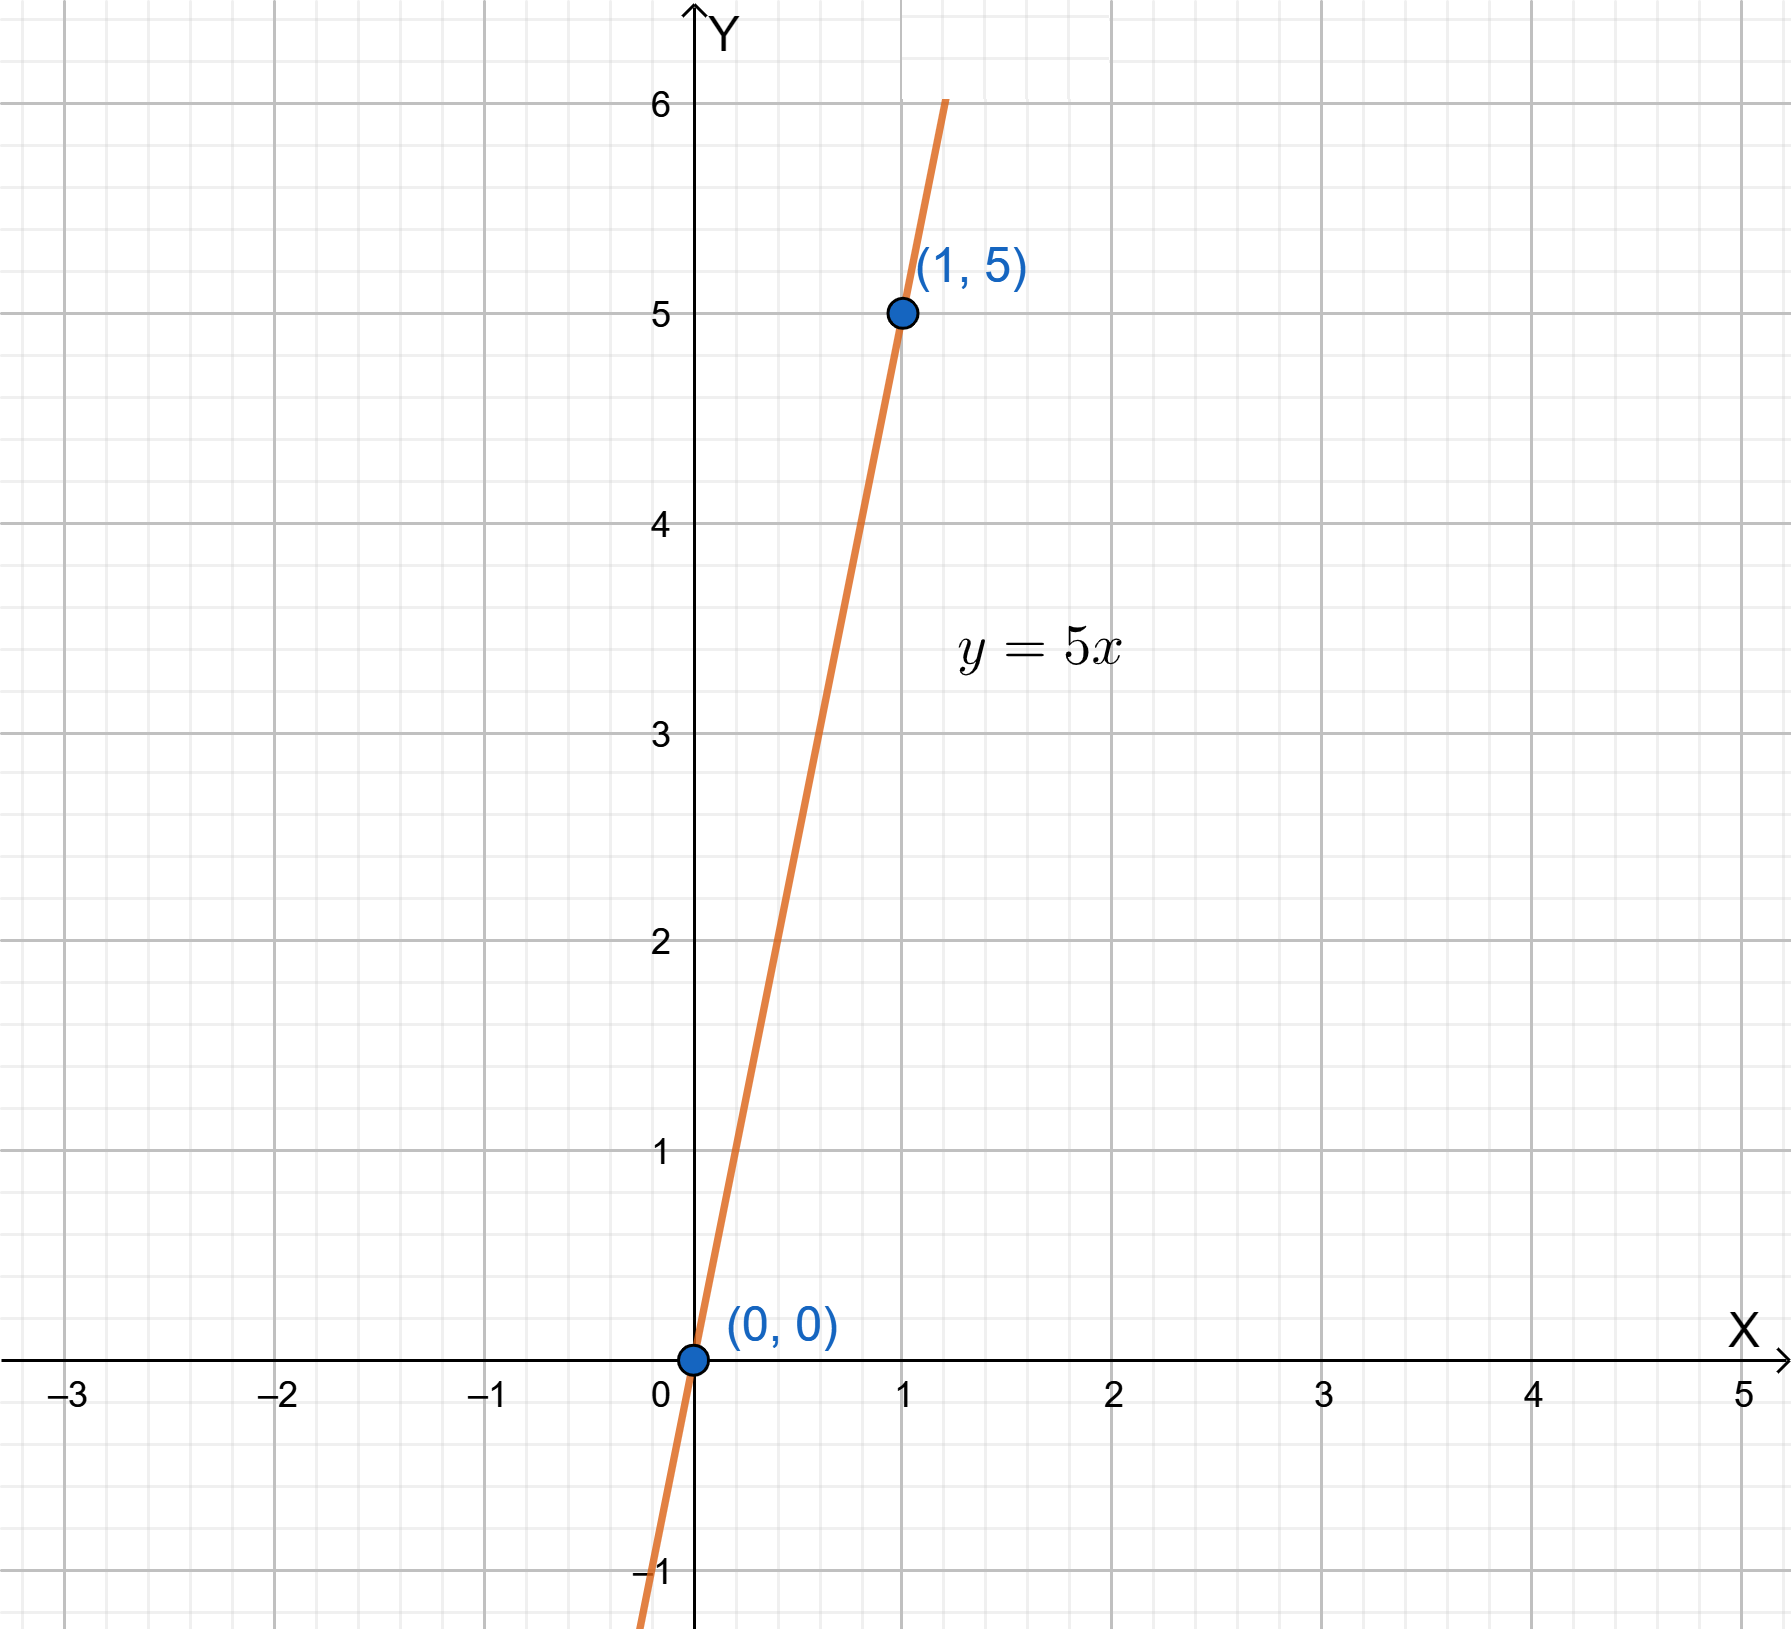
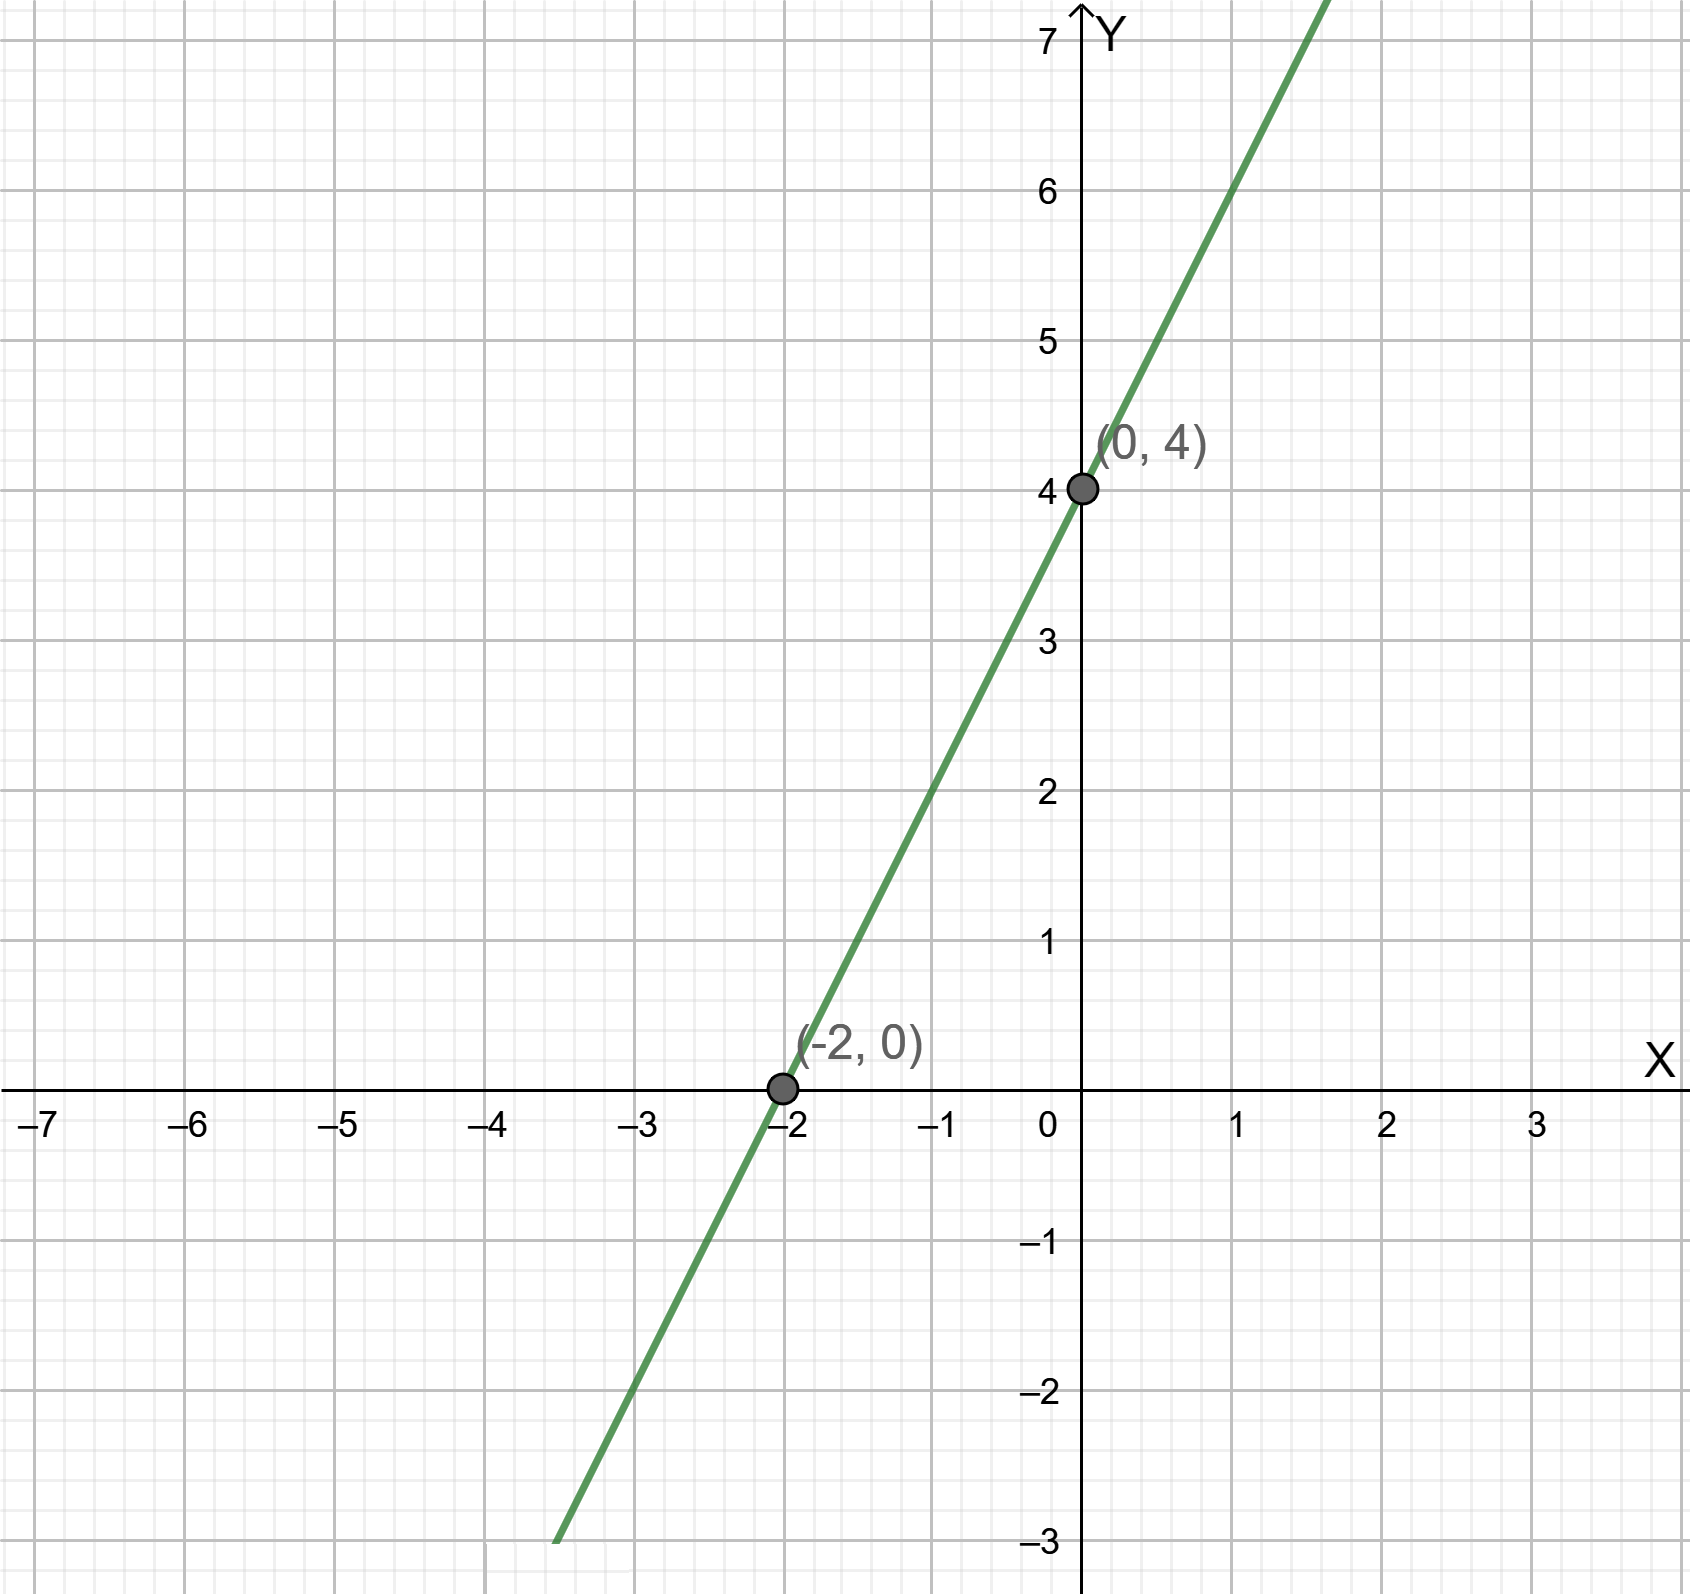
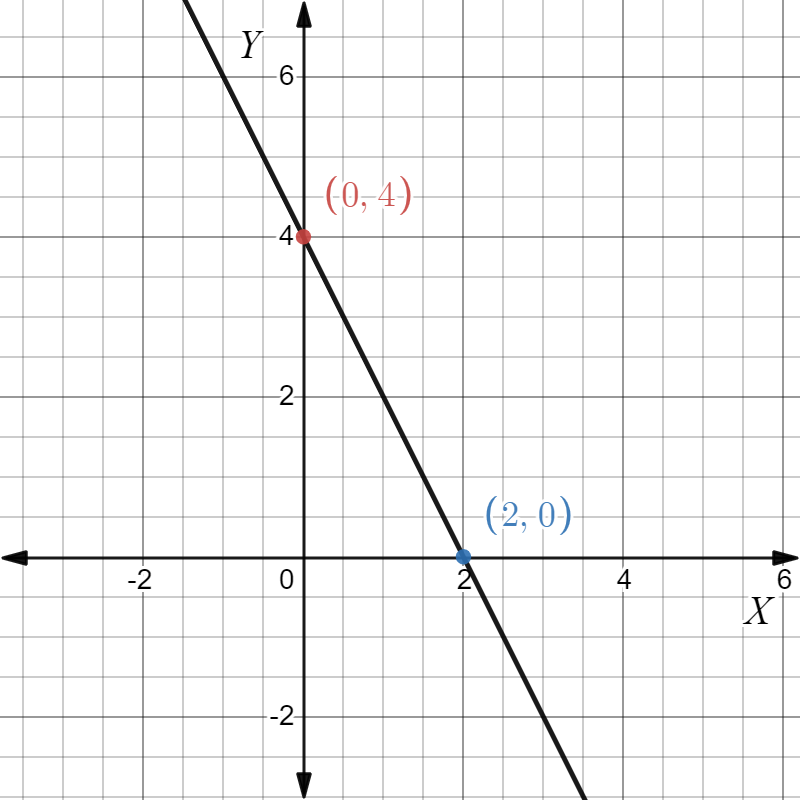
Page 102 Exercise 5 Answer
To find an example, let us choose a point and a slope.
Let m=5(x1,y1)=(0,4)
To find the equation of the line with the given slope and pass through the given point, substitute the values in the point-slope equation of the line.
y−y1=m(x−x1)
y−4=5(x−0)
y−4=5x
y=5x+4
This is the equation of the required line.
The example of how to write an equation of a line when you are given the slope and a point on the line is given below.
Let the point be (0.4)and the slope of the line be m=5, then the equation of the line obtained using the point-slope form is
y=5x+4.
Page 104 Exercise 1 Answer
Given: The point (−2,1), the slope is m=−3.
To find The equation of the line.
Summary: Use the point-slope form of a line. Substitute the values in it and simplify.
The point and the slope given are, (−2,1)=(x1,y1)
m=−3
y−y1=m(x−x1)
y−1=−3(x−(−2))
Simplifying we get
y−1=−3x−6
y=−3x−6+1
y=−3x−5
The equation of the line with slope m=−3 and passing through the point (−2,1) is y=−3x−5.
Algebra 1 Student Journal Chapter 4 Exercise 4.2 Answers
Big Ideas Math Algebra 1 Student Journal 1st Edition Chapter 4 Writing Linear Functions Exercise 4.2 Page 104 Exercise 2 Answer
Given: We have a slope, m=2 and the point x1 =3, y1=5
To find The point-slope form of the straight line formed.
Summary: We have the specific point as (3,5) and slope as 2.
We know that the point-slope form is given as, y−y1 =m(x−x1), we will so get the required equation by substituting the values in the equation.
We have, slope m=2 And specific points, x1=3,y1=5
On substituting the values in the general equation of point-slope, y−y1 =m(x−x1)
We get, y−5=2(x−3)
Which is equal to,y=2x−1
The point-slope form of the straight line is, y=2x−1
Page 104 Exercise 3 Answer
Given: We have a slope, m=−1 and the point as(−1,−2)
To find The point-slope form of the straight line formed.
Summary: We have the specific point of the straight line x1 =−1,y1 =−2 and slope value equal to −1.
Now we know that the point-slope form is given as, y−y1 =m(x−x1) where x1,y1 denotes the specific point and m denotes slope of the straight line, we will so get the required equation by substituting the values in the equation.
We have the slope, m=−1
And the specific point as, (x1,y1)=(−1,−2)
If we substitute the values in general form of a point-slope equation we will get, y−(−2)=(−1)[x−(−1)]
We can also write, y+2=−x−1
Which gives, y+x=−3
The point-intercept form of the given straight line gives y+x=−3
Big Ideas Math Writing Linear Functions Exercise 4.2 Help
Big Ideas Math Algebra 1 Student Journal 1st Edition Chapter 4 Writing Linear Functions Exercise 4.2 Page 104 Exercise 4 Answer
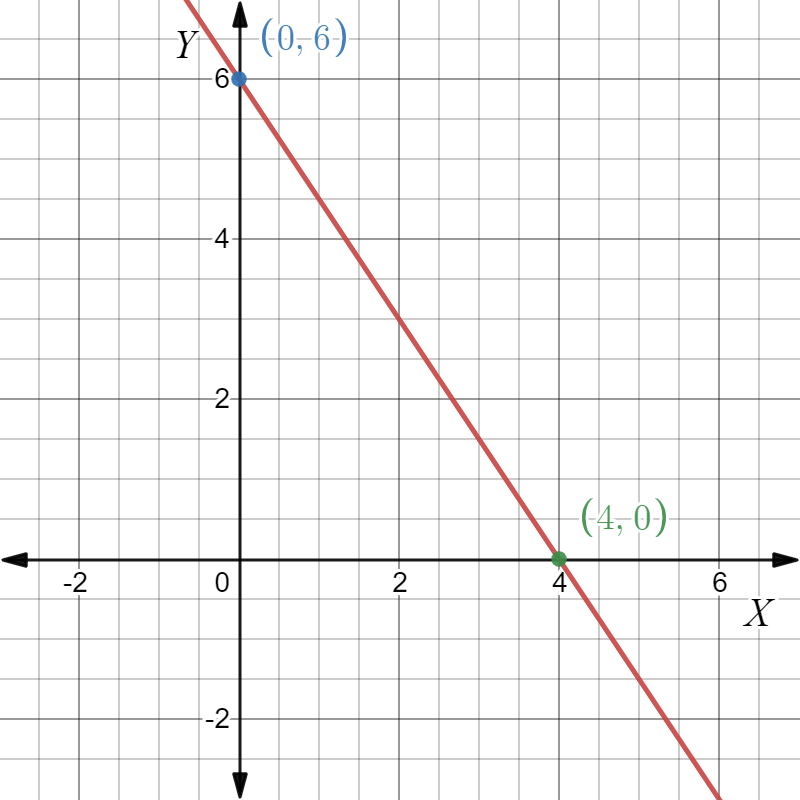
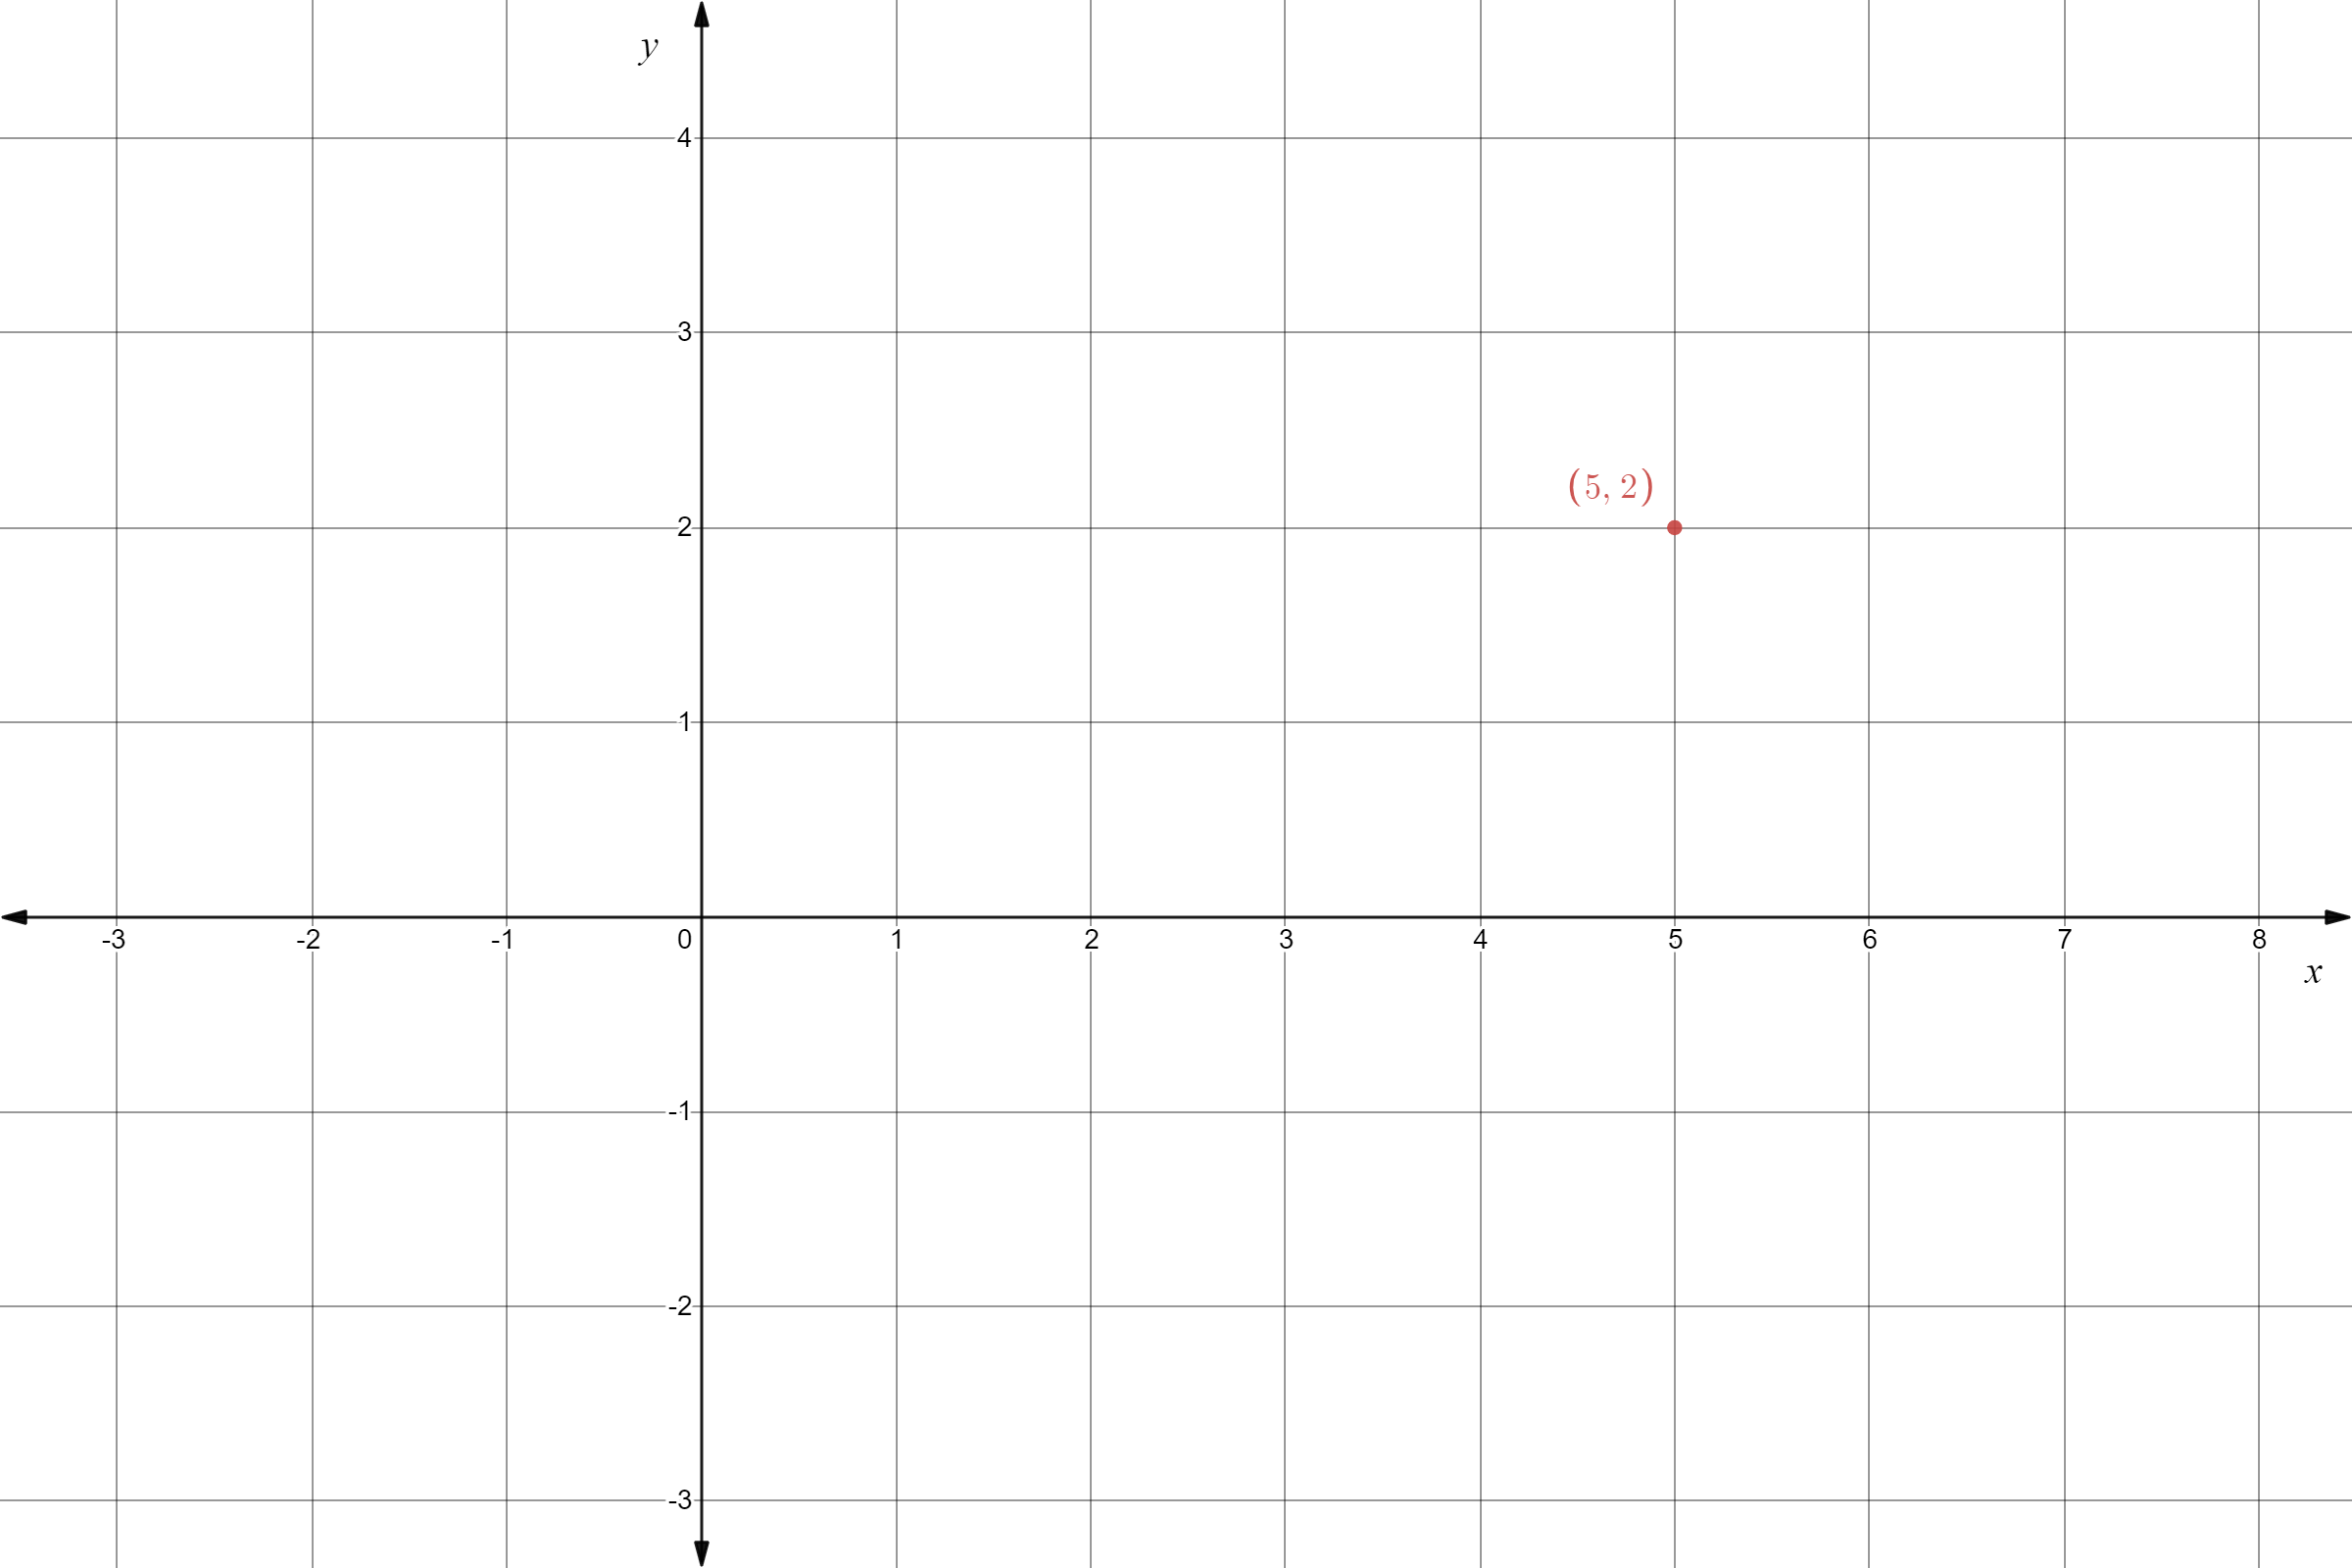
Given: We have a slope, m=\(\frac{4}{3}\) and the coordinates of a point as,(5,0)
To find The point-slope form of the straight line formed.
Summary: We have the specific point x1 =5,y1 =0 and slope as \(\frac{4}{3}\).
Now the point-slope form is generally given as y−y1 =m(x−x1) now on substituting the given values in the general equation we will find the equation in point-slope form for the given straight line.
We have slope,m=\(\frac{4}{3}\) And the coordinates of point, x1=5,y1=0
Now substituting the values in y−y1 =m(x−x1)
We get,y−0=\(\frac{4}{3}\) (x−5)
Which gives,3y=4x−20
The equation in point-slope form is given as 3y=4x−20
Page 104 Exercise 5 Answer
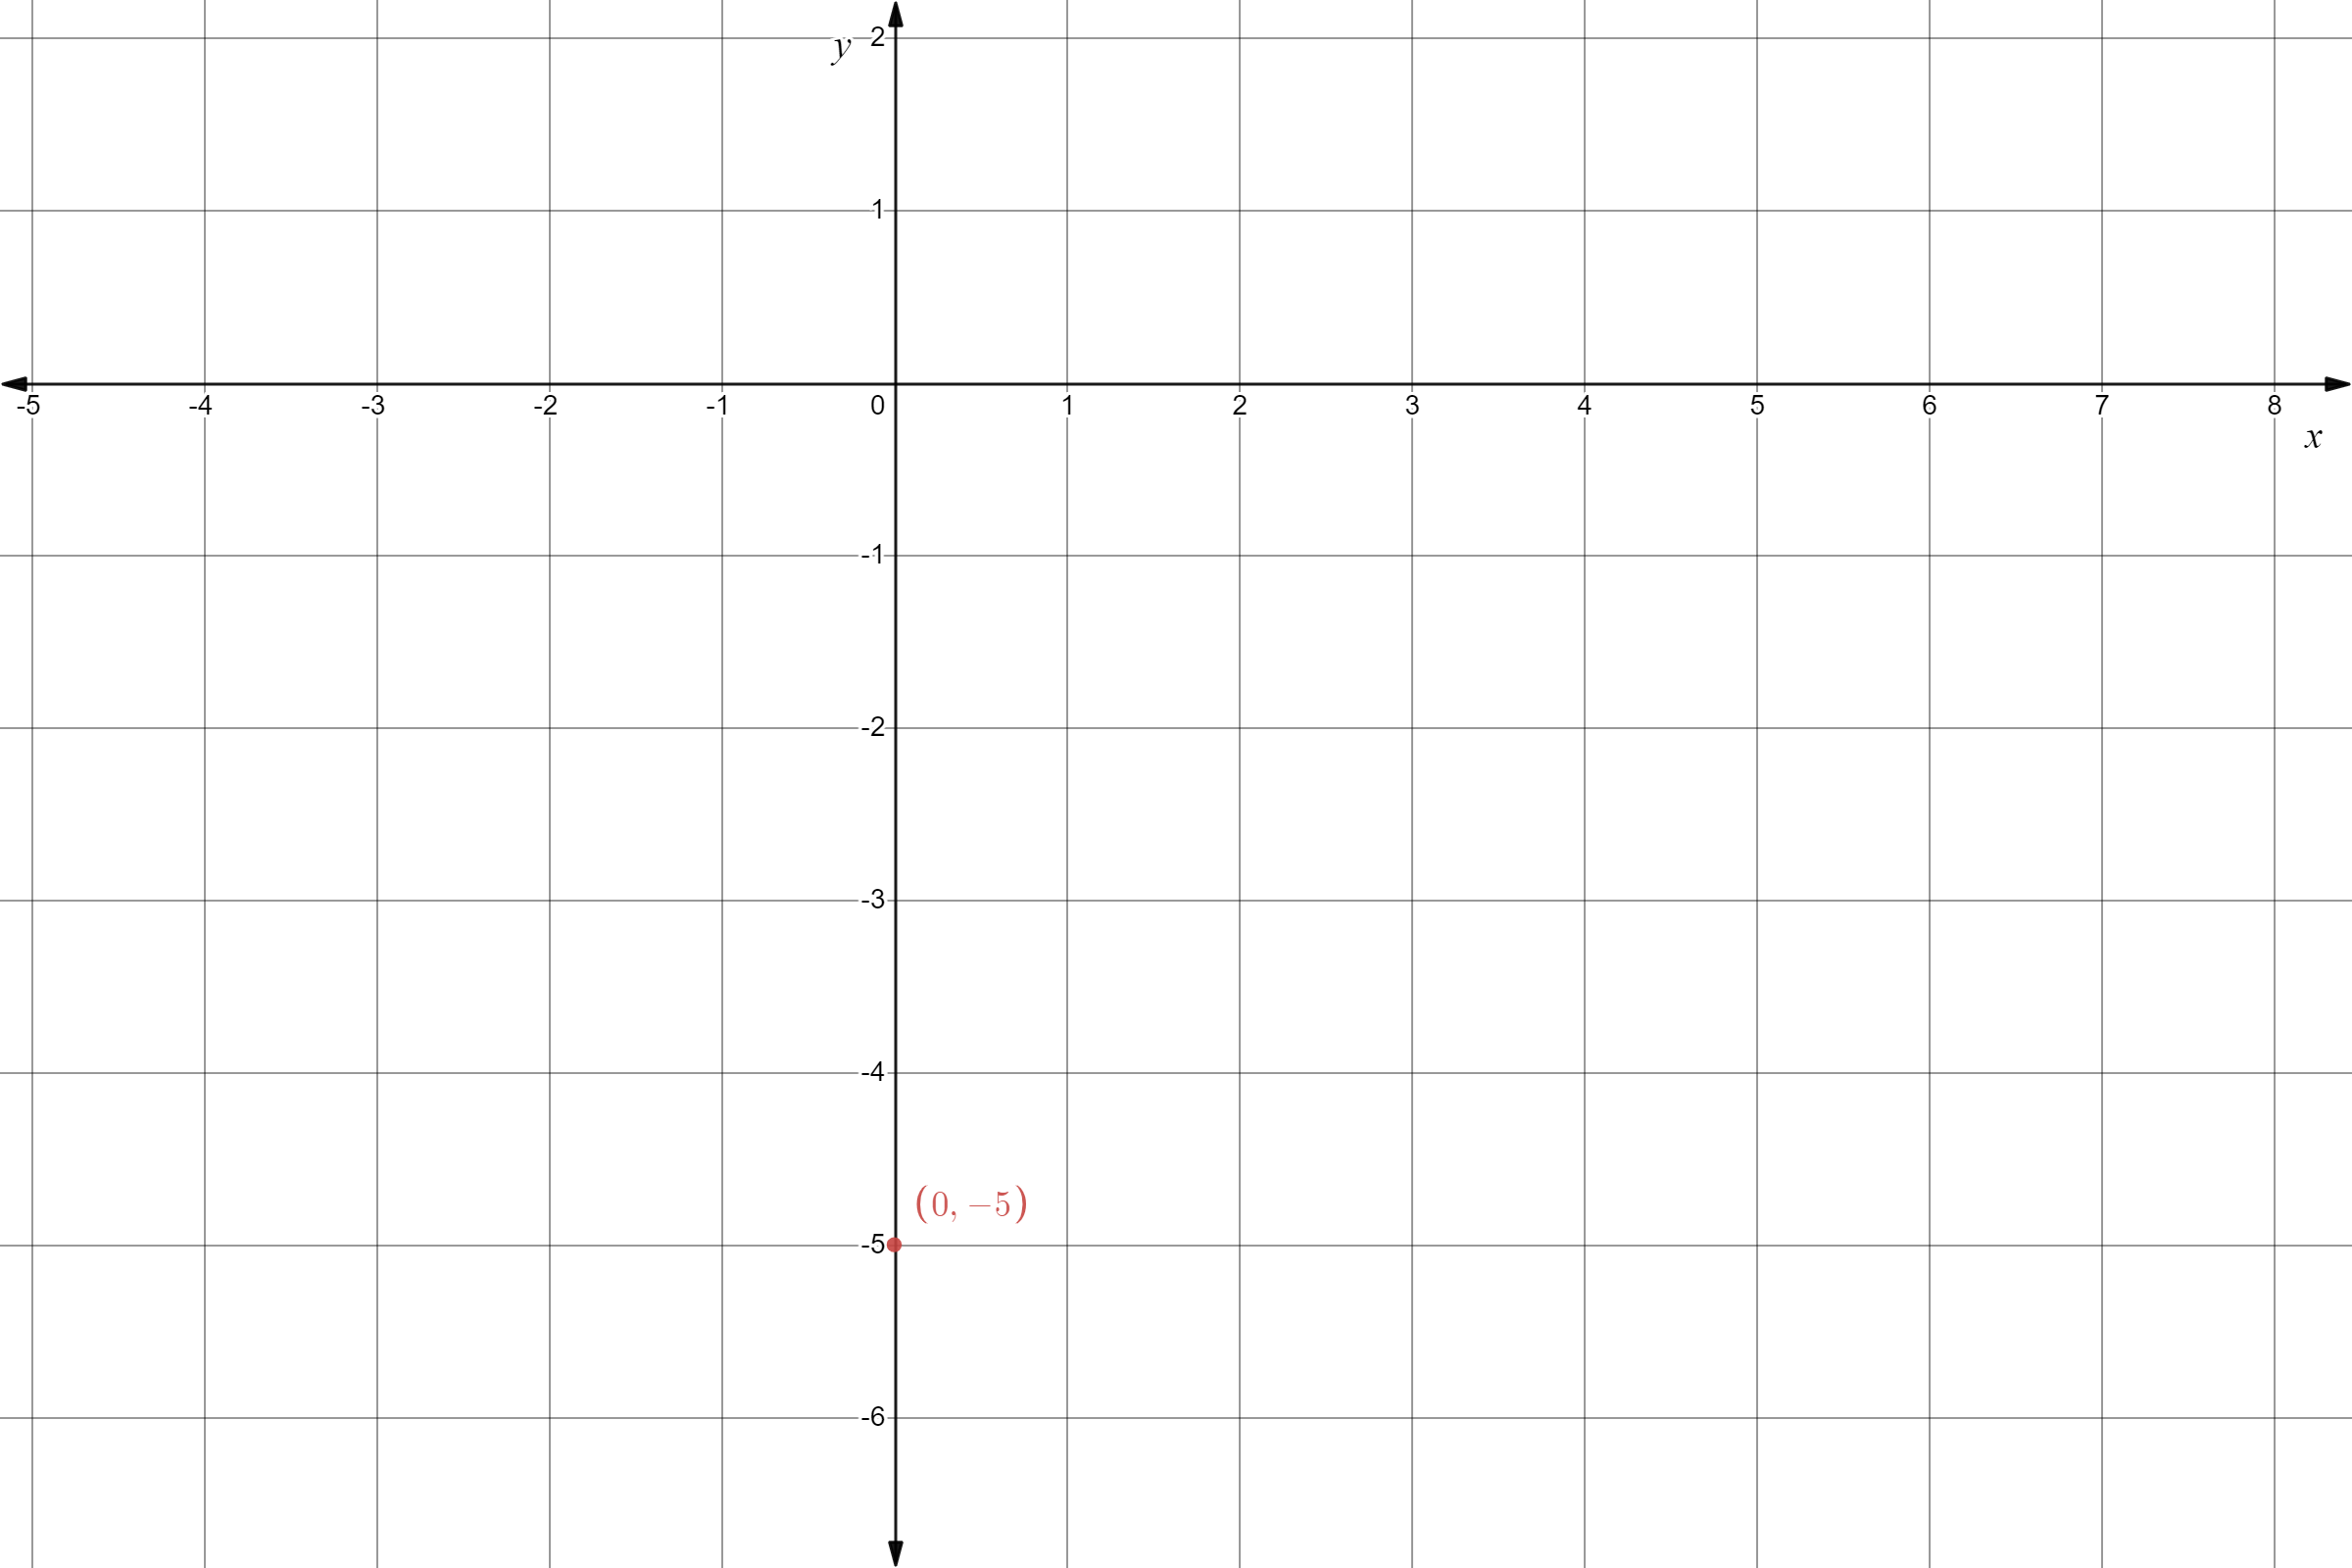
Given: We have a slope, m=7 and the point as (0,4)
To find The point-slope form of the straight line formed.
Summary: We have the specific point (0,4) and slope as 7 in the question itself.
And we know that the point-slope form is given as, y−y1 =m(x−x1)
Where m, is the slope and x1,y1 denotes the coordinates of a specific given point, we will so get the required equation by substituting the values in the general equation.
We are given, slope, m=7, And coordinates of a specific point as,(x1,y1)=(0,4)
Now substituting the values in y−y1=m(x−x1)
We get,y−4=7(x−0) Which gives, y=7x+4
The equation of a straight line in point-slope form is given as y=7x+4
Big Ideas Math Algebra 1 Student Journal 1st Edition Chapter 4 Writing Linear Functions Exercise 4.2 Page 104 Exercise 6 Answer
Given: We have the specific coordinates of points as, x1=1,y1=2 and the slope m=\(\frac{-1}{2}\)
To find The equation of straight line in point-slope form.
Summary: We have the specific point as x1=1,y1=2 and slope as m=\(\frac{-1}{2}\) Now, We know that the point-slope form is given as, y−y1 =m(x−x1), we will so get the required equation by substituting the values in the general equation in point-slope form.
We have, slope m=\(\frac{-1}{2}\) And the coordinates of specific point, (x1,y1)=(1,2)
Now substituting the values in y−y1=m(x−x1)
We get , y−2=\(\frac{-1}{2}\)(x−1)
Which is equal to,2y+x=3
The straight line equation in point-slope form is given as 2y+x=3
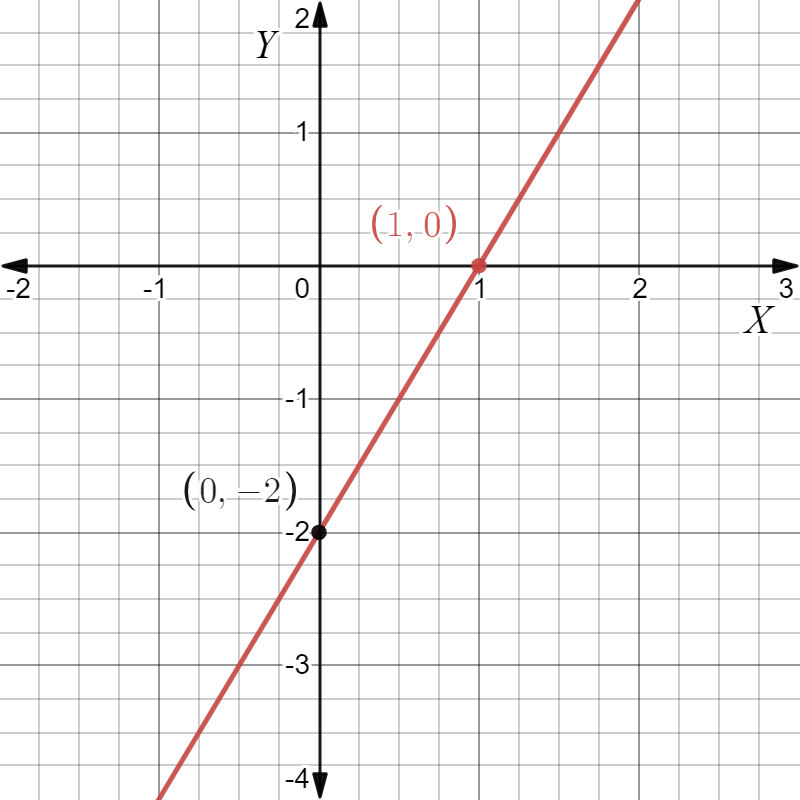
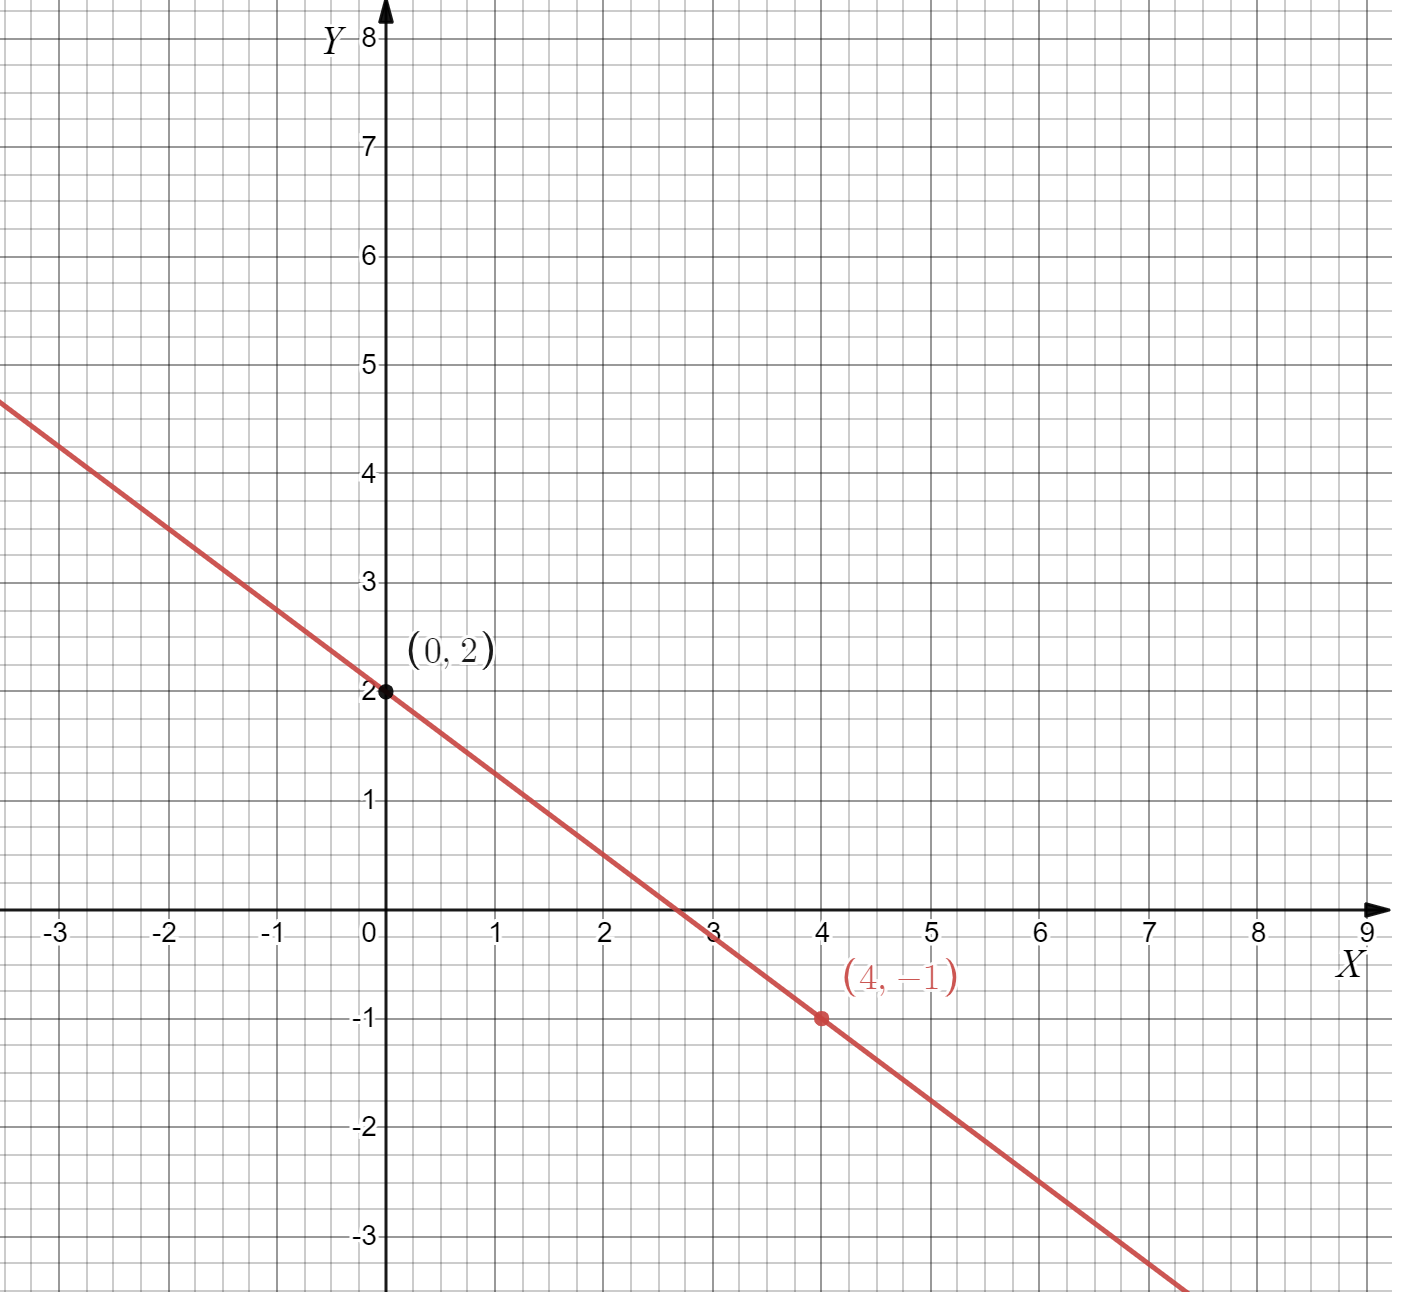
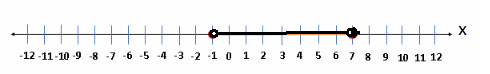
Page 104 Exercise 8 Answer
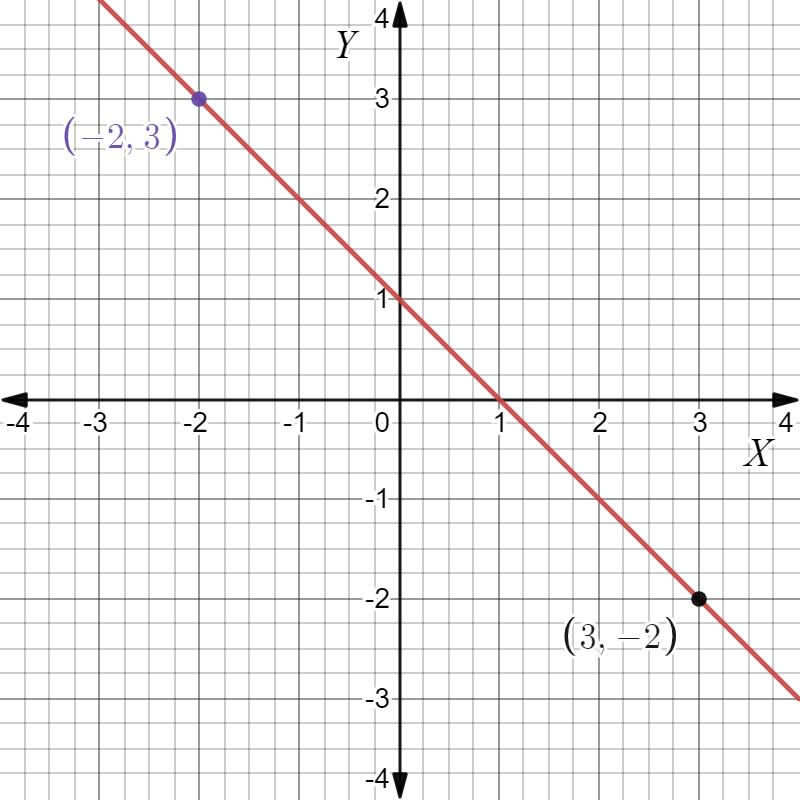
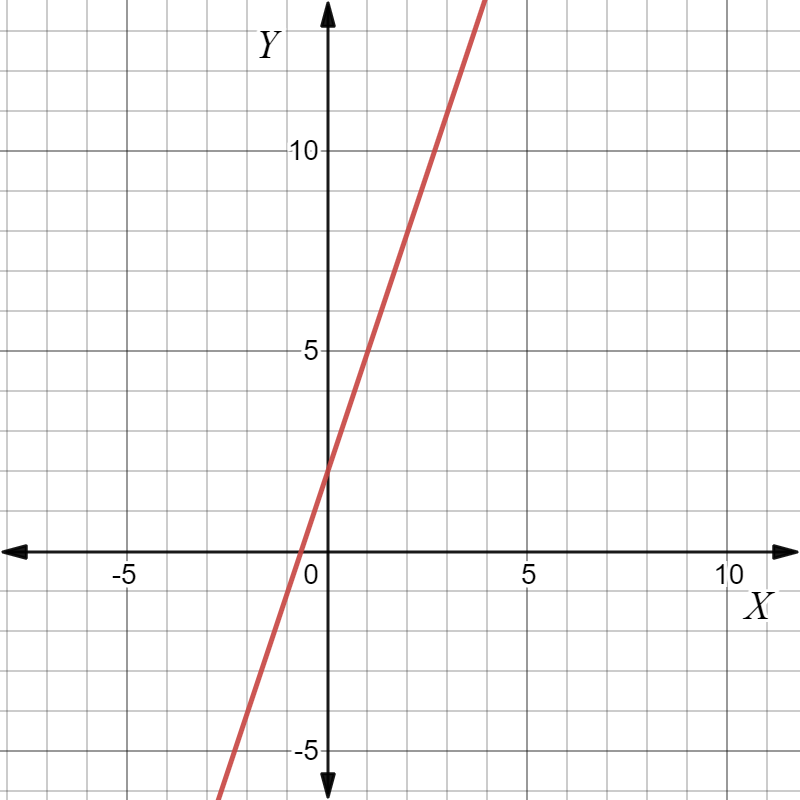
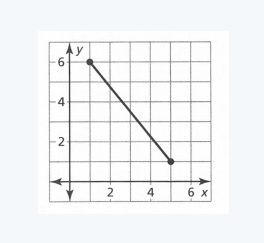
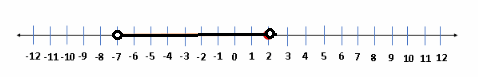
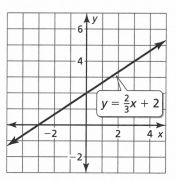
Given: We have the graph of a straight line as

To find The equation in slope-intercept form.
Summary: We have the graph of a straight line which when observed shows the intercept is equal to3, and the two points are given as(1,2),(4,−1) which will give us the value of slope which is found using,m\(=\frac{y_2-y_1}{x_2-x_1}\).
And the values of slope and intercept when substituted in the general slope-intercept form of straight line, we will get the equation of this given line.
The graph of a straight line as
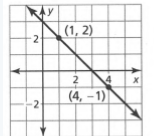
From the graph we can see The intercept c=3
And (x1,y1)=4,−1, (x2,y2)=1,2
Then slope,m\(=\frac{2-(-1)}{1-4}\)
Which gives,m=−1
On substituting the values of slope and intercept in y=mx+c, We get,y=−1x+3
The given straight line gives y=−x+3 in slope-intercept form.
Chapter 4 Exercise 4.2 Step-By-Step Solutions Big Ideas Math
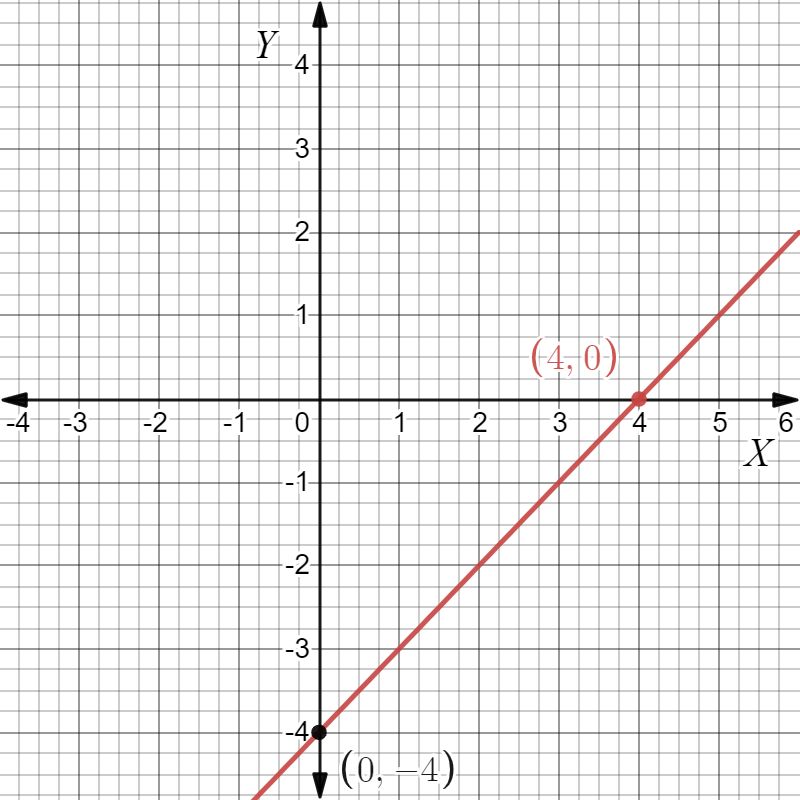
Big Ideas Math Algebra 1 Student Journal 1st Edition Chapter 4 Writing Linear Functions Exercise 4.2 Page 104 Exercise 9 Answer
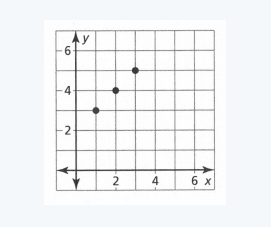
Given: We have the graph of a straight line as

To find The equation in slope-intercept form.
Summary: The graph shows the value of intercept as 4, and the coordinate of two points as, (−2,−3),(2,−1) which will give us the value of the slope, as the slope is the ratio of difference of two of the coordinates, and the intercept and slope values will give us the ultimate equation of the straight line in slope-intercept form.
The graph of a straight line as
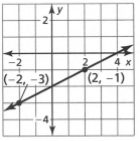
The intercept c=4
And coordinates, (x1,y1)=−2,−3 ( x2, y2 )=2,−1
Which gives the slope,m=−\(\frac{-1-(-3)}{2-(-2)}\)
⇒m=\(\frac{1}{2}\)
On substituting the value of intercept and slope in the general equation, we get,y=\(\frac{1}{2}\)+x+4
⇒2y=x+8
The straight line in slope-intercept form gives,2y=x+8
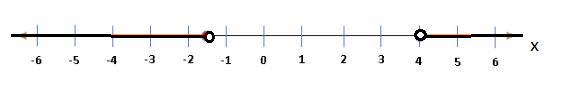
Big Ideas Math Algebra 1 Student Journal 1st Edition Chapter 4 Writing Linear Functions Exercise 4.2 Page 104 Exercise 11 Answer
Given: We have the graph of a straight line as

To find The equation in slope-intercept form.
Summary: If we observe the graph we can see the intercept is 2, and the slope is calculated using the formula,m\(=\frac{y_2-y_1}{x_2-x_1}\) where the x,y
Represents the coordinates of two points on the graph. On substituting the values of x,y we will find the slope. Then we can substitute the values we get in the slope-intercept form to find the equation of the straight line.
The graph of a straight line is give as
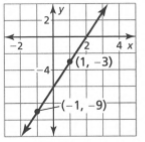
We can see that the intercept,c=2 and x1=1,x2 =−1 y1 =−3 y2 =−9
Which when substituted gives, a slope
m=−\(\frac{-9-(-3)}{-1-1}\)
⇒m=3
On substituting the values of intercept and slope in general equation, We get,y=3x+2
The straight line in slope intercept form gives y=3x+2
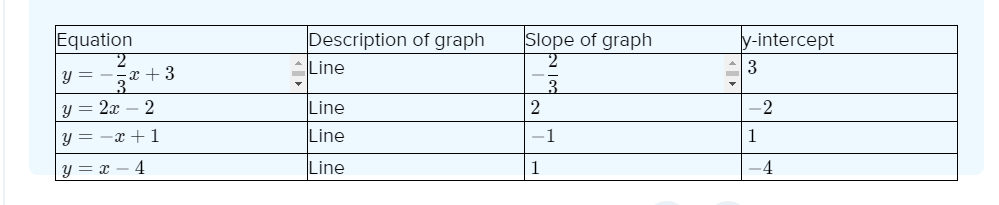
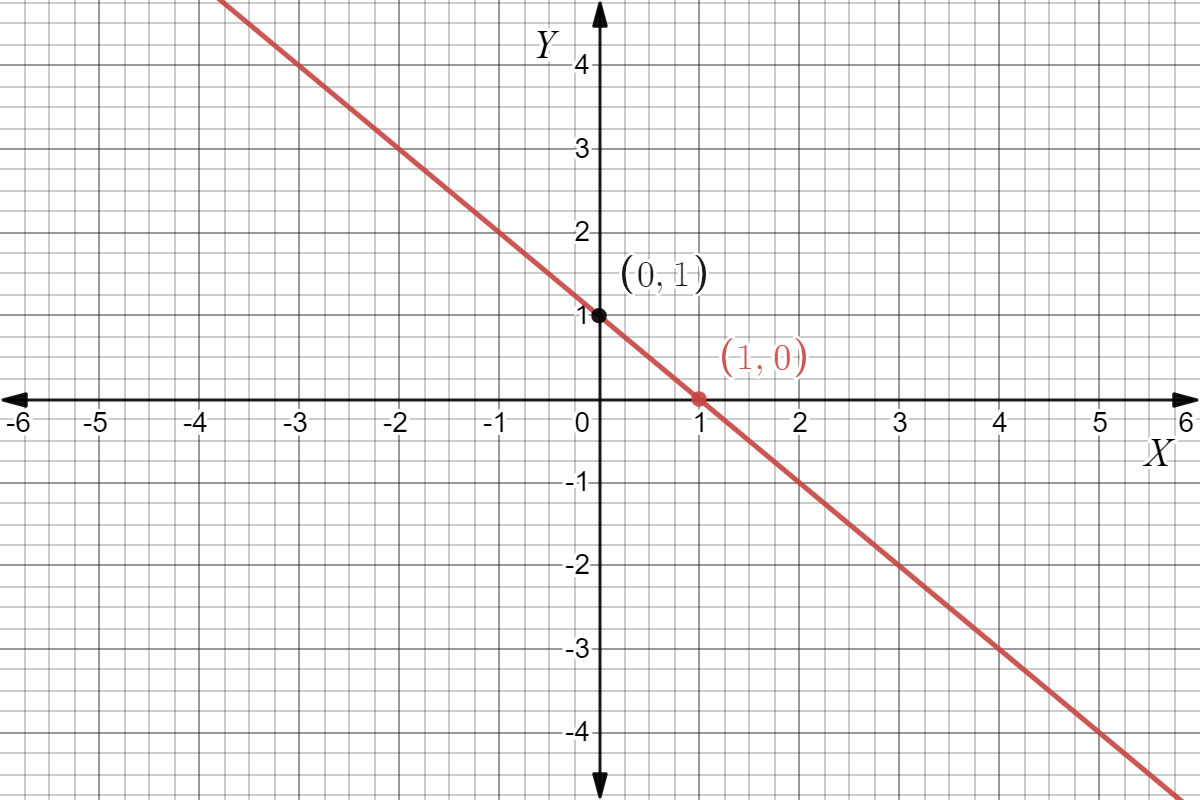
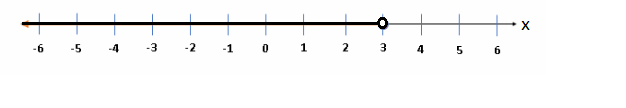
Page 104 Exercise 12 Answer
Given: We have the graph of a straight line as

To find The equation in slope-intercept form.
Summary: If we observe the graph we can see the intercept is 2 and the slope is calculated by m\(=\frac{y_2-y_1}{x_2-x_1}\) where the x,y represents the coordinates of two given points on the graph.
On substituting the values of x,y we will find the slope. Then we can substitute the values we get in the slope-intercept form to find the equation of the straight line.
The graph of a straight line is given as
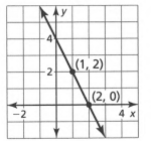
The graph gives, intercept c=2
Coordinate of points as, x1 =1 x2=2 y1=2 y2=0
Which gives, slope m−\(=\frac{-2}{2-1}\)
⇒m=−2
Now if we substitute the values of slope and intercept in general form, We get,y=−2x+2
The straight line gives y=−2x+2 in slope intercept form.
Exercise 4.2 Big Ideas Math Algebra 1 Guide
Big Ideas Math Algebra 1 Student Journal 1st Edition Chapter 4 Writing Linear Functions Exercise 4.2 Page 105 Exercise 13 Answer
Given: We have the function,f(−3)=−1,f(−2)=4
To find The linear equation satisfying the function.
Summary: We can interpret the slope as the difference of ratio of coordinates of by y,x.
This will give us the value of the slope, and substituting values from any of the functions in the general form will give us the equation to find the value of the intercept.
This when substituted in the general equation of straight line we will find the linear function.
We have,f(−3)=−1
f(−2)=4
Then slope,m=\(\frac{4+1}{-2+3}\)
⇒m=5
On substituting any function and slope in general form,
We get,−1=−15+c
c=14
On substituting the values, We get the equation in linear form as
y=5x+14
The linear expression gives,y=5x+14
Big Ideas Math Algebra 1 Student Journal 1st Edition Chapter 4 Writing Linear Functions Exercise 4.2 Page 105 Exercise 14 Answer
Given: We have,f(−2)=1,f(1)=7
To find The linear equation satisfying the function.
Summary: We can interpret the slope as the difference of ratio of coordinates of y,x
This will give us the value of the slope, and substituting values from any of the functions in the general form will give us the equation to find the value of the intercept.
This when substituted in the general equation of straight line we will find the linear function.
We have,f(−2)=1 f(1)=7
Then slope,m\(=\frac{7-1}{1+2}\)
m=2
On substituting any function and slope in general form
We get,1=−4+c
c=5
On substituting the values, We get the equation in linear form as,y=2x+5
The linear expression gives,y=2x+5
Page 105 Exercise 15 Answer
Given: We have,f(−1)=2,f(3)=3
To find The linear equation satisfying the function.
Summary: We can interpret the slope as the difference of ratio of coordinates of y,x.
This will give us the value of the slope, and substituting values from any of the functions in the general form will give us the equation to find the value of the intercept.
This when substituted in the general equation of straight line we will find the linear function.
We have,f(−1)=2 f(3)=3
Then slope,m\(=\frac{3-2}{3+1}\)
⇒m\(=\frac{1}{4}\)
On substituting any function and slope in general form
We get, 2=\(\frac{1}{4}\)(−1)+c
⇒c=2+\(\frac{1}{4}\)
⇒c=\(\frac{9}{4}\)
On substituting the values, We get the equation in linear form as
y=\(\frac{1}{4}\)+\(\frac{9}{4}\)
⇒4y=x+9
The linear expression gives,4y=x+9
How To Solve Exercise 4.2 Big Ideas Math
Big Ideas Math Algebra 1 Student Journal 1st Edition Chapter 4 Writing Linear Functions Exercise 4.2 Page 105 Exercise 16 Answer
Given: We have f(0)=−2,f(4)=−1
To find The linear equation satisfying the function.
Summary: We can interpret the slope as the difference of ratio of coordinates of x,y.
This will give us the value of the slope, and substituting values from any of the functions in the general form will give us the equation to find the value of the intercept.
This when substituted in the general equation of straight line we will find the linear function.
We have,f(0)=−2
f(4)=−1
Then slope,m\(\frac{-2+1}{-4}\)
⇒m\(=\frac{1}{4}\)
On substituting any function and slope in general form
We get,(−2)\(=\frac{1}{4}\)(0)+c
−2=c
On substituting the values, We get the equation in linear form as
y\(=\frac{1}{4}\)x−2
The linear expression gives,4y=x−8
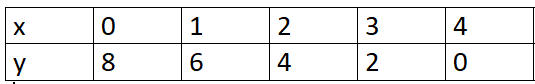
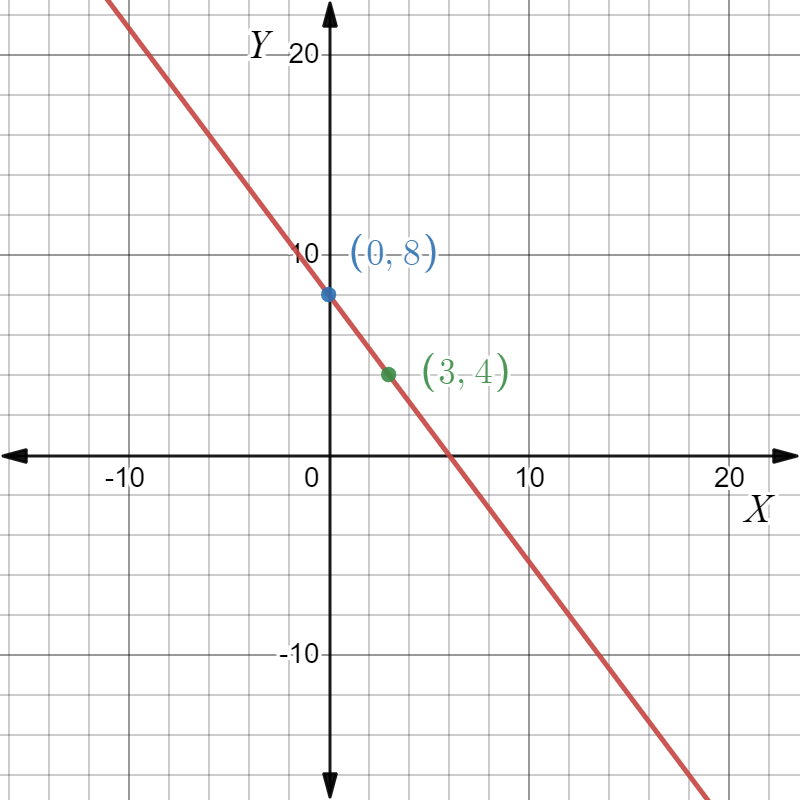
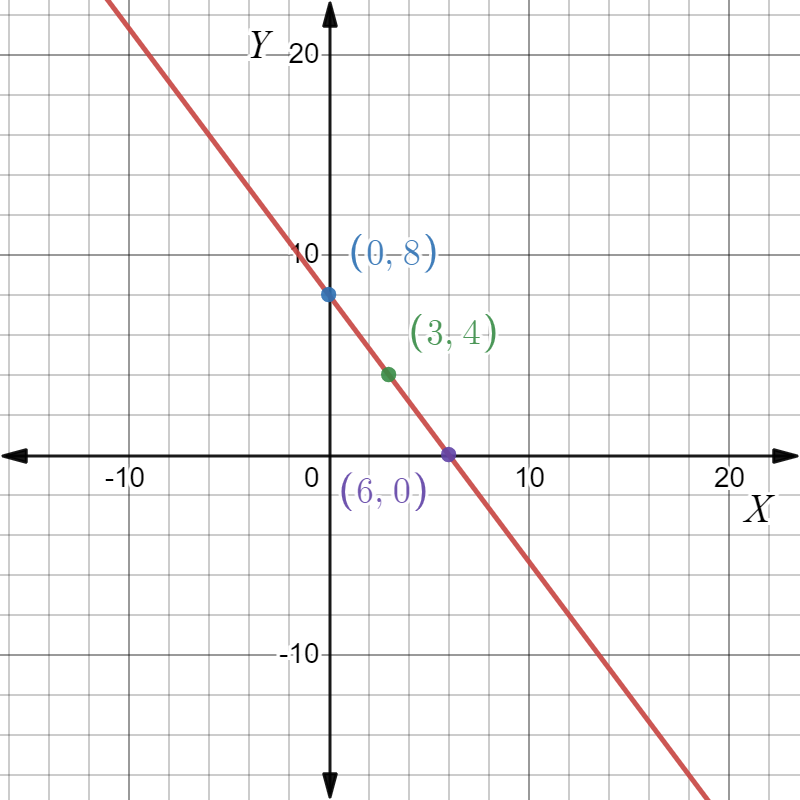
Page 105 Exercise 17 Answer
Given: We havef(1)=0,f(0)=8
To find The linear equation satisfying the function.
Summary: We can interpret the slope as the difference of ratio of coordinates of x,y.
This will give us the value of the slope, and by substituting values from any of the function in the general form will give us the equation to find the value of intercept.
This when substituted in the general equation of straight line we will find the linear function.
We have,f(1)=0
f(0)=8
Then slope,m\(=\frac{8}{-1}\)
⇒m=−8
On substituting any function and slope in general form, we get, 8=c
On substituting the values, We get the equation in linear form as,
y=−8x+8
The linear expression gives,y=−8x+8
Big Ideas Math Algebra 1 Student Journal 1st Edition Chapter 4 Writing Linear Functions Exercise 4.2 Page 105 Exercise 18 Answer
Given: We have, f(3)=5,f(2)=6
To find The linear equation satisfying the function.
Summary: We can interpret the slope as the difference of ratio of coordinates of y by x.
This will give us the value of the slope, and by substituting values from any of the function in the general form will give us the equation to find the value of intercept.
This when substituted in the general equation of straight line we will find the linear function.
We have,( x1,y1) =(3,5) , (x2,y2)=(6,2)
Which will give, m\(=\frac{2-5}{6-3}\)
m=1
On substituting the value of slope and either of the function will give us, 5=3+c
⇒c=2
If we substitute the values of slope and intercept in the general equation
we will get, y=x+2
The linear expression of the function gives y=x+2
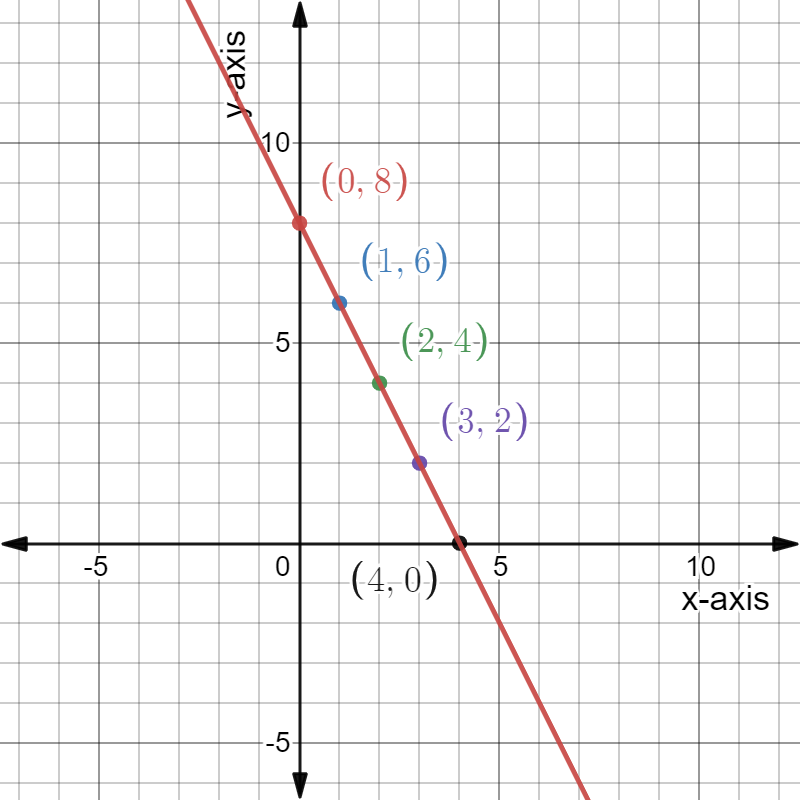
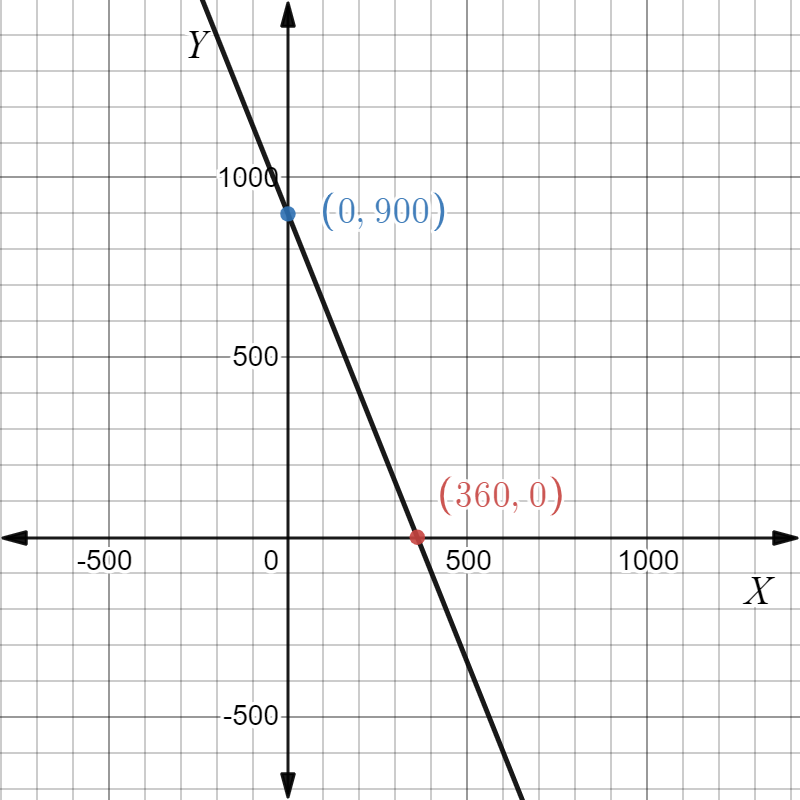
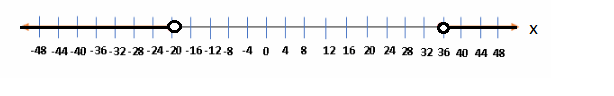
Page 105 Exercise 19 Answer
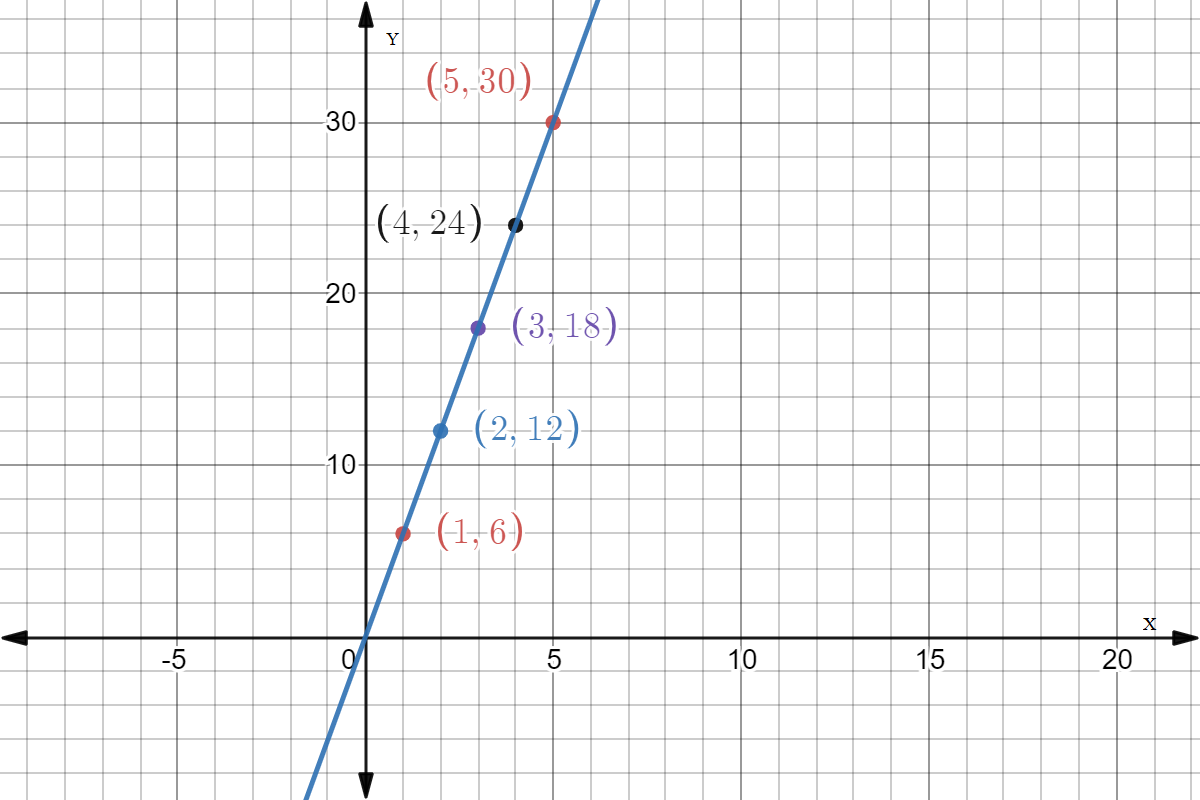
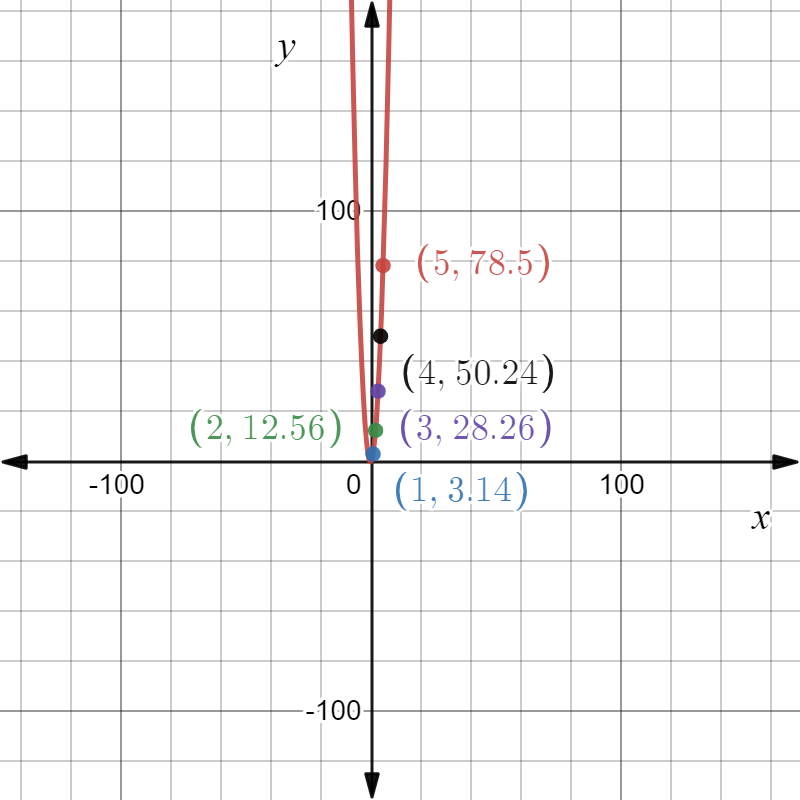
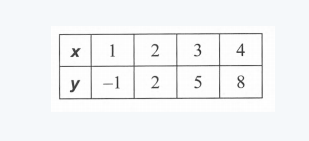
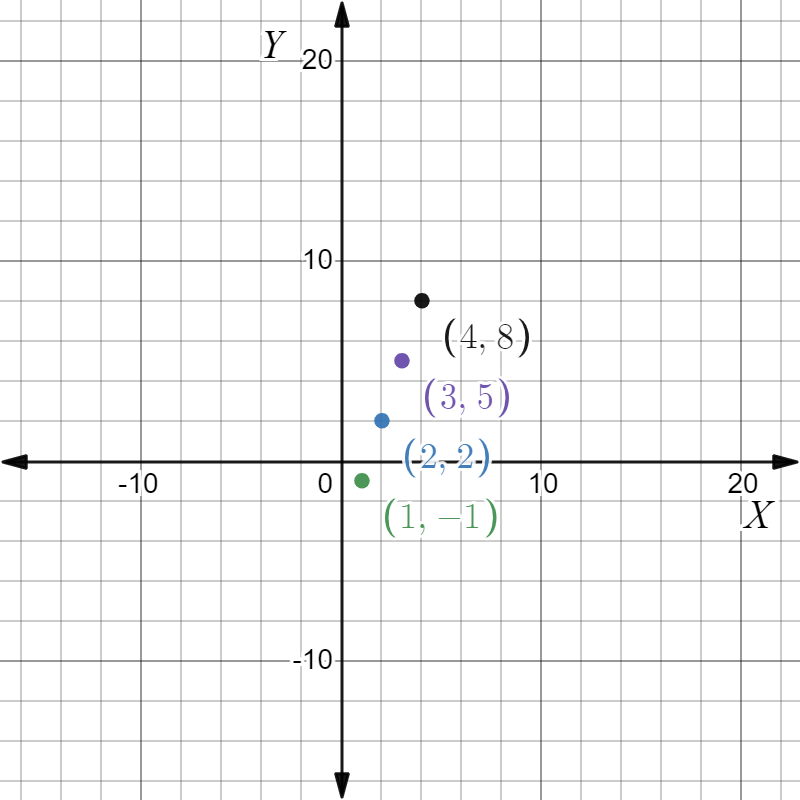
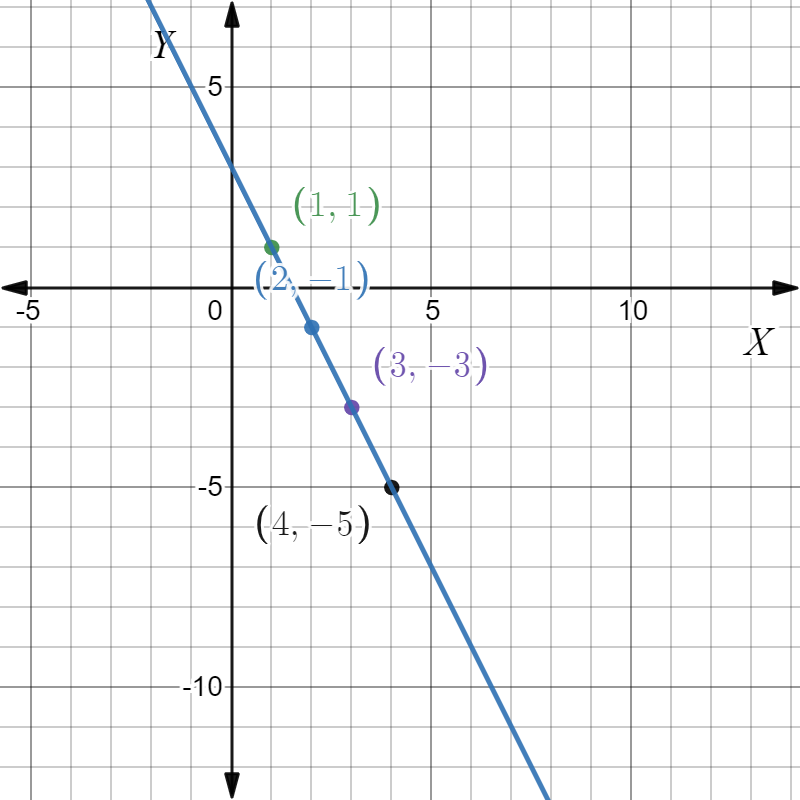
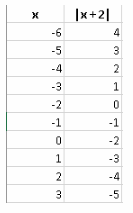
Given: We have the data as
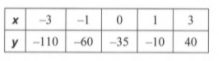
To find Whether linear equation expression for the given data is possible or not.
Summary: We have the data of x, and y.
If we find the slopes of the points we will find the value is the same, now it implies that linear equation form is possible which is determined by substituting the value of slope and intercept in the equation of straight line as y=mx+c.
where m and c denotes slope and intercept respectively.
We have the data of

Now let us consider, (x1 ,y1) =(−3,−110), (x2 ,y2) =(−1,−60)
Then the slope for this point can be given as, m\(=\frac{-60-(-110)}{-1-(-3)}\)
⇒m=25
Now, let us consider two other points from the data as, (x1′,y1′)=(3,40), (x2 ′,y2 ′)=(1,−10)
Then the slope for these point will be, m=\(\frac{-10-40}{1-3}\)
⇒m=25
We can see slopes are equal for all the points, then linear equation is possible.
On substituting the values in y=mx+c
We get the linear equation,y=25x−35
The given data can be represented in linear equation form as,y=25x−35
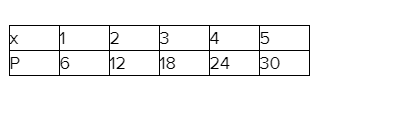
Page 105 Exercise 20 Answer
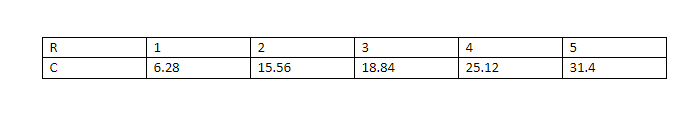
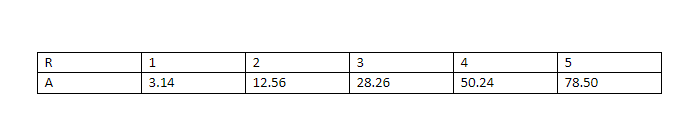
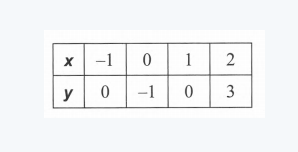
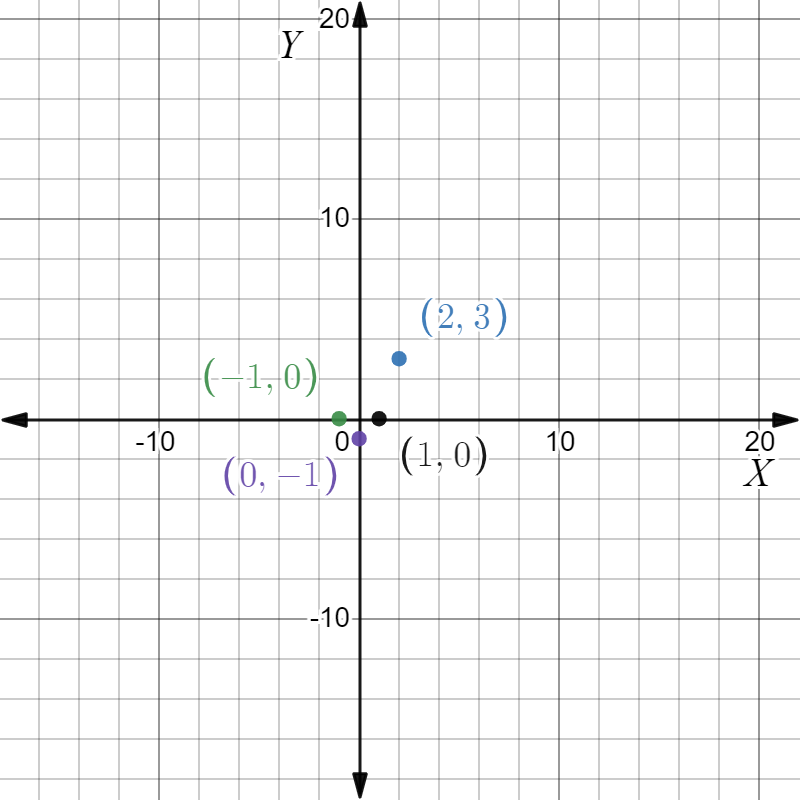
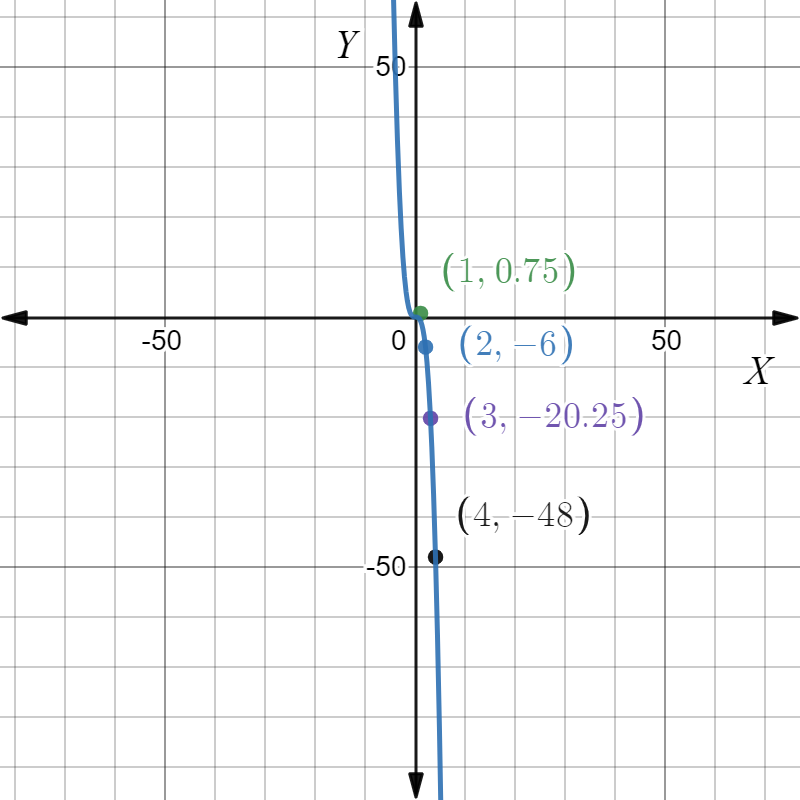
Given: We have the data as

To find Whether the given data be represented in linear equation form.
Summary: We have the data of x,y and we can approach the question by finding the value of slope between two different points, in this one we can see pair of two points representing the same line gives a different slope which implies that the linear equation form for this data is not applicable.
We have the data as
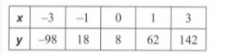
We can consider two points,(x1,y1)=(−1,18) (x2 ,y2 )=(−3,−98)
Then the slope,m\(=\frac{-98-18}{-3+1}\)
⇒m=58
Now let us consider two more points as,(x1′,y1′)=(1,62)
(x2′,y2′)=(3,142)
Then the slope,m\(=\frac{142-62}{3-1}\)
⇒ m=40
We can see that the two slopes representing one line are not equal, which implies we cannot represent the data in linear equation form.
We cannot express the data in linear equation form.
Big Ideas Math Algebra 1 Student Journal 1st Edition Chapter 4 Writing Linear Functions Exercise 4.2 Page 105 Exercise 21 Answer
Given: We have, speed=60 miles per hour distance travelled in 3hrs=265 miles
To find A linear function D, that drives in h, hours and distance travelled in7hrs.
Summary: We have the distance covered in 3hrs=265 miles, then in one hour \(\frac{265}{3}\) miles are covered. Also, we are already given that the distance covered in one hour is 60 miles. Then if we multiply 7 we will find the distance travelled in that period of time, and we will find a linear equation for the function.
The distance covered in one hour=60miles
We can represent the time as x, and distance as y
And the distance covered in 3hrs=265 miles.
Then distance covered in 7hrs=7×60 miles =420miles
Linear function to represent the given condition can be like, y=mx+c where m,c are constants
We can replace the values of y,x, and m by 60,1,6
y=60, x=1, m=6
We get, y=mx+c
60=6(1)+c
60=6+c
c=60-6
⇒c=54
Then the equation can be given as, D=6h+54 The linear expression for covering D, distance in h hour is given as, D=6h+54 where the distance covered in 7 hrs=420miles
Big Ideas Math Student Journal Exercise 4.2 Examples


 |
|