
Big Ideas Math Algebra 1 Student Journal 1st Edition Chapter 2 Solving Linear Inequalities Exercise 2.6
Page 53 Exercise 2 Answer
The given graph is
We plot x+2=0 in the number line asx=−2
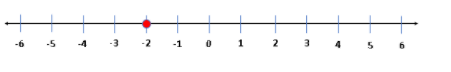
The required graph is
Read and Learn More Big Ideas Math Algebra 1 Student Journal 1st Edition Solutions
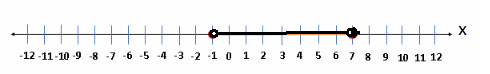
Given: The given equation is |x+2|≤3.
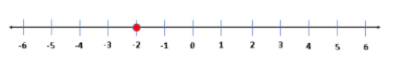
To find The points that are within 3 units from the point you found in Page 53 Exercise 2 .
Observe the equation then make a graph for it.
Consider the given equation
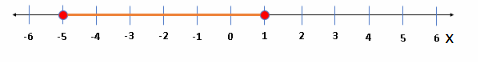
We find the point 3 units (from left to right) away from a point in Page 53 Exercise 2
The inequality of given data is, we plot x=−5 and x=1

Big Ideas Math Algebra 1 Chapter 2 Exercise 2.6 Solution
Given: The given equation is ∣x+2∣≤3.
To find The number line to solve an absolute value inequality.
Observe the equation then make a graph for it.
Consider the given equation
We solve the inequality as follows
∣x+2∣≤3
x+2≤3
x+2

Now subtract 2 from both sides
x+2−2≤3−2
x≤1
x+2≤−3x+2−2≤−3−2
Again subtract 2 from both sides
x≤−5x≤x≤1
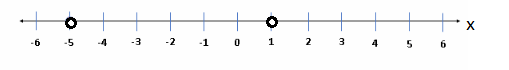
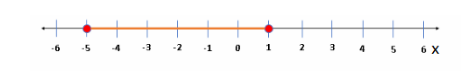
We draw −5≤x≤1 as follows
The inequality of given data is, we plot −5≤x≤1.
Big Ideas Math Algebra 1 Student Journal 1st Edition Chapter 2 Solving Linear Inequalities Exercise 2.6 Page 54 Exercise 3 Answer
Given: The absolute value inequality |x+2|≤3.
To find The absolute value inequality.
Observe the spreadsheet then fill data in it.
According to the question,
Make a spreadsheet it.

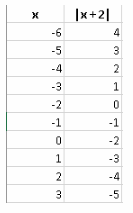
We use a spreadsheet to solve the absolute value inequality
Given: The absolute value inequality |x+2|≤3.
To find The solution using the spreadsheet.
Observe the spreadsheet then fill data in it.
According to the given data
Make spreadsheet.

Using the spreadsheet, we can see that the values for x in Exercises 1 and 2 can be found in the spreadsheet’s values.
We notice that the values for x are found in the values in the spreadsheet.

Solving Linear Inequalities Exercise 2.6 Big Ideas Math
Given: The absolute value inequality |x+2|≤3.
To find The solutions using the spreadsheet
Observe the spreadsheet then fill data in it.
According to the given data
Make spreadsheet.
We can use a spreadsheet to solve an absolute value inequality by plugging in the values of x to the formula.

We use a spreadsheet to solve an absolute value inequality by plugging in the values of x to the formula.

Page 54 Exercise 4 Answer
There are three approaches for solving an absolute value inequality.
These methods include algebraic (using linear inequalities), visual (using a number line), and numerical (using a calculator) ( using spreadsheets).
If the absolute value expression equals a negative number, the equation has no solution because an absolute value can never be negative.
Big Ideas Math Algebra 1 Student Journal 1st Edition Chapter 2 Solving Linear Inequalities Exercise 2.6 Page 54 Exercise 5 Answer
There are three approaches for solving an absolute value inequality.
These methods include algebraic (using linear inequalities), visual (using a number line), and numerical (using a calculator) (using spreadsheets ).
All three strategies are effective and simple to master. Personally, I favour the graphical way because it is the most transparent of the three; nevertheless, this does not preclude you from utilising the other two.
If the absolute value expression equals a negative number, the equation has no solution because an absolute value can never be negative.
Page 56 Exercise 3 Answer
Given: The given equation is 3|2a+5|+10≤37
To find The inequality.
Observe the question and make a graph for it.
Consider the given equation
First, solve for a
3|2a+5|+10≤37
We separate this inequality into two
3(2a+5)+10≤37
Now distribute
3.2a+3.5+10≤37
Then simplify
6a+15+10≤37
6a+25≤37
6a+25−25≤37−25
Now subtract 25 from both sides
6a≤12
Then divide both sides by 6
a≤2
Divide both sides by
6a+15−15≥−27−15
Now subtract by 15 from both sides
6a≥−42
a≥−7
Now we plot the data to graph a≤2 and a≥−7
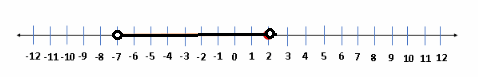
The inequality of given data is, we plot a≤2 and a≥−7

Algebra 1 Student Journal Chapter 2 Exercise 2.6 Answers
Big Ideas Math Algebra 1 Student Journal 1st Edition Chapter 2 Solving Linear Inequalities Exercise 2.6 Page 56 Exercise 4 Answer
Given: The given equation is∣y−3∣≤4.
To find The inequality.
Observe the question and make a graph for it.
Consider the given equation
First, we solve for y
|y−3|≤4
Separate this inequality into two.
y−3≤4
Now add 3 to both sides
y−3+3≤4+3
y≤7
y−3≥−4
y−3+3≥−4+3
Again add 3 to both sides
y≥−1
Now we plot the data to graph,y≤7 and y≥−1
The inequality of given data is, we plot y≤7 and y≥−1

Page 56 Exercise 5 Answer
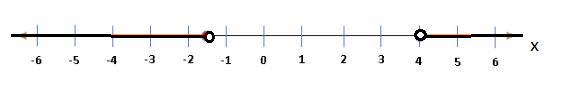
Given: The given equation is |3+r|−4<0
To find The inequality.
Observe the question and make a graph for it.
Consider the given equation.
First, we solve for r
|3+r|−4<0
Separate this inequality into two
3+r−4<0
r−1<0
Now add 1 to both sides
r−1+1<0+1
r<1
3+r<0+4
3+r>−4
3+r−3>−4−3
Subtract 3 from both sides,
r>−7
Now we plot the graph r<1 and r>−7 as follows

The inequality of given data is, we plot r<1 and r>−7.

Big Ideas Math Algebra 1 Student Journal 1st Edition Chapter 2 Solving Linear Inequalities Exercise 2.6 Page 57 Exercise 7 Answer
Given:The given equation is\(\left|\frac{x}{4}-7\right|<-2\)
To find The inequality.
Observe the question and make graph for it.
Consider the given equation
First, we solve for x
\(\left|\frac{x}{4}-7\right|<-2\)\(\frac{x}{4}\)−7+7<−2+7
Now add 7 to both sides
\(\frac{x}{4}<-5\)Now multiply both sides by 4
\(\frac{x}{4} \cdot 4<-5 \cdot 4\)x<-20
\(\frac{x}{4}-7>-(-2)\)Again add 7 to both sides.
\(\frac{x}{4}\)−7+7>2+7
\(\frac{x}{4}\)>9
Now multiply both sides by 4
\(\frac{x}{4}\).4>9⋅4
x>36
For equation make graph x<−20 and x>36
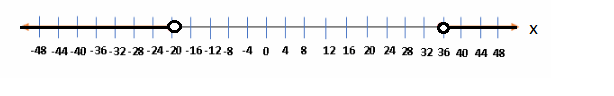
The inequality of given data is, we plot x<−20 and x>36.

Big Ideas Math Linear Inequalities Exercise 2.6 Help
Big Ideas Math Algebra 1 Student Journal 1st Edition Chapter 2 Solving Linear Inequalities Exercise 2.6 Page 57 Exercise 8 Answer
Given: The given equation is |4x−7|+8≥17
To find The inequality.
Observe the question and make graph for it.
Consider the given equation
First, we solve for x
|4x−7|+8≥17
We separate the inequality into two
4x−7+8≥17
4x+1≥17
4x+1−1≥17−1
4x≥16
Now divide by 4 both sides
\(\frac{4 x}{4} \geq \frac{16}{4}\)
x≥4
4x−7+8≥−17
Subtract 8 from both sides.
4x−7+8−8≥17−8
4x−7≤−9
Add 7 to both sides.
4x−7+7≤−9+7
\(x \leq-\frac{1}{2}\)
For equation make graph,x≥4 and \(x \leq-\frac{1}{2}\)

The inequality of given data is, we plot,x≥4 and \(x \leq-\frac{1}{2}\)
Page 57 Exercise 9 Answer
Given: The given equation is 6|2−k|+14>14
To find The inequality.
Observe the question and make a graph for it.
Consider the given equation
First, we solve for k
6|2−k|+14>14
Separate this inequality into two
6|3−k|+14>14
Subtract 14 on both sides.
6(3−k)+14−14>14−14
6(3−k)>0
\(\frac{6(3-k)}{6}>\frac{0}{6}\)3−k>0
Now subtract 3 from both sides
3−k−3>0−3
−k>−3
\(\frac{-k}{-1}>\frac{-3}{-1}\)Simplify
6(3−k)+14−14>14−14
6(3−k)>0
\(\frac{-k}{-1}>\frac{-3}{-1}\)
Divide both sides by -1
k<3
For equation make graph,k<3
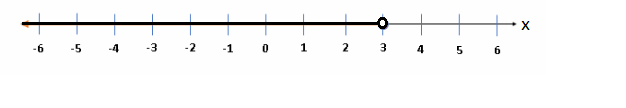
The inequality of given data is, we plot k<3

Big Ideas Math Algebra 1 Student Journal 1st Edition Chapter 2 Solving Linear Inequalities Exercise 2.6 Page 57 Exercise 10 Answer
Given:The given is, the average starting salary for a new worker is 25000.
To find The range of the starting salaries.
Observe the given data the solve for the answer.
According to the given data.
Solve for the salary, s as follows
−1800≤∣s−25000∣≤1800
−1800+25000≤s≤1800+25000
23200≤s≤26800
The salary is from 23200 to 26800.
Chapter 2 Exercise 2.6 Step-By-Step Solutions Big Ideas Math