
Cengage Financial Algebra 1st Edition Chapter 2 Exercise 2.2 Modeling a Business
Page 71 Problem 1 Answer
Given : (1,56),(2,45),(4,20),(3,30), and (5,9)
To find; Find the equation of the linear regression line of the scatterplot defined by these points:
Although it is possible to find the linear regression equation using paper and pencil, it is a lengthy process.
The first value in each point represents the x−value, while the second value in each point represents the
| x | y |
| 1 | 56 |
| 2 | 45 |
| 4 | 20 |
| 3 | 30 |
| 5 | 9 |
Press on the STAT button and then press ENTER (by which we will select 1:Edit…). Enter the x-values in the list L1 and enter the y-values in the list L2.
Next press on STAT, press ▹ (to select the CALC-tab), press∇ three times until 4: LinReg(ax+b) is selected and then press on ENTER.
Next press 2nd and STAT (to open the LIST menu) and press ENTER to select 1:L1. Next press on “,” (comma). Then press 2 nds and STAT (to open the LIST menu), press ∇ once, and press ENTER to select 2:L2
Read and Learn More Cengage Financial Algebra 1st Edition Answers
LinReg(ax+b)L1,L2
y=ax+b=−3.54x+308.33
Hence the equation of the linear regression line of the scatterplot defined by these points: will be LinReg(ax+b)L1, L2
y=ax+b=−3.54x+308.33
Cengage Financial Algebra 1st Edition Chapter 2 Exercise 2.2 Modeling A Business Solutions
Page 71 Problem 2 Answer
Given; that the temperature forecasted was 85 degrees (increases by 2 degrees)
To find: How many water bottles should Rachael pack
Is this an example of interpolation or extrapolation? Round to the nearest integer.
The linear regression equation tells Rachel the approximate number of bottles she should sell given a specific temperature.
Substitute 85 for x in the equation, and compute y, the number of water bottles she should expect to sell.
Equation of the regression liney=4.44x−187.67
Substitute 106 for x.y=4.44(85)−187.67
Simplify.y=189.73
If the trend continues and the temperature reaches 85 degrees Fahrenheit, Rachael should expect to sell approximately 190 water bottles.
She should stock 190 bottles.
Hence we conclude that If the trend continues and the temperature reaches 85
degrees Fahrenheit, Rachael should expect to sell approximately 190 water bottles.
She should stock 190 bottles.
Cengage Financial Algebra 1st Edition Chapter 2 Exercise 2.2 Modeling a Business Page 73 Problem 3 Answer
To find: here we have discussed what we have learned in this lesson to give an interpretation of the quote.
Here we learned that Statistics is most useful for making predictions, such that you can make decisions based on these predictions and then use these decisions to make actions such that you can profit from your knowledge about the predictions.
If you made a good prediction, then your action could result in you making a lot of money, else you could end up losing a lot of money.
Hence we conclude that Statistics is most useful for making predictions,
Page 73 Problem 4 Answer
Given that over the past four years, Reggie noticed that as the price of a slice of pizza increased, her college tuition also increased. She found the correlation coefficient was r=0.49.
To find; Which of the following scatter plots most accurately displays Reggie’s data?
Explain would the price of a slice of pizza be labeled as the explanatory variable and the tuition as the response variable. Explain.
The given sentence explains that the variable is the variable that affects the other variable,
since the college tuition is affected by the price of a slice of pizza,
the price of the slice of pizza is the explanatory variable.
The affected variable is the response variable and is thus in this case the tuition.
Hence we conclude that yes the price of a slice of pizza be labeled as the explanatory variable and the tuition as the response variable
Page 73 Problem 5 Answer
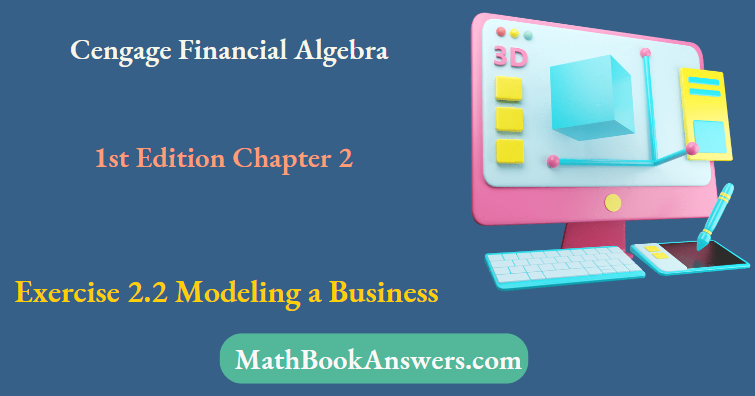
Given; gives enrollments at North Shore High School.
To find; Find the equation of the regression line. Round the slope and y-intercept to the nearest hundredth.
Here we have to find the y-intercept Enter the ordered pairs (xis year and y is several students) into your calculator.
Then use the statistics menu to calculate the linear regression equation.
The equation is of the form y=mx+b, where m is the slope and b is the y-intercept.
Rounding the slope and y-intercept to the nearest hundredth, the equation of the regression line is
y=30.5x−60,384.4
Hence we have found the y-intercept of the student enrollment y=30.5x−60,384.4
Cengage Financial Algebra 1st Edition Chapter 2 Exercise 2.2 Modeling a Business Page 73 Problem 6 Answer
Given; The table gives enrollments at North Shore High School.
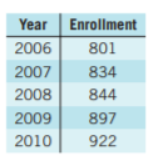
To find; What is the slope of the linear regression line?
The given line is y=30.5x−60,384.4
comparing with a slope of the line y=mx+c
y=mx+c=30.5x−60,384.4
Gives m=30.5
Hence the slope of the linear regression line is found to bem=30.5
Page 73 Problem 7 Answer
Given; The table gives enrollments at North Shore High School.
To find: What are the units of the slope expressed as a rate?
we know that the Slope is dy/dx
Hence its units will be the units of y divided the unit x Unit of y is the number of students x is the year
Hence we conclude that the unit of slope will be students per year
Cengage Financial Algebra Chapter 2 Exercise 2.2 Modeling A Business Answers
Page 73 Problem 8 Answer
Given; The table gives enrollments at North Shore High School.

To find; Based on the linear regression line, how many students will be enrolled in the year 2016? Round to the nearest integer,
we know that the linear equation regression is given by y=30.5x−60,384.4
To find a number of students in 2016
we will get
y=30.5×2016−60,384.4
y=61,488−60,384.4=
1,103.6
≈1,104
Hence we get that the number of students who will be enrolled in the year 2016 will be y=1104
Cengage Financial Algebra 1st Edition Chapter 2 Exercise 2.2 Modeling a Business Page 73 Problem 9 Answer
Given; The table gives enrollments at North Shore High School.
To find; here we have to give the reason that Is our answer to part d an example of interpolation or extrapolation? Explain.
We know that the linear equation regression is given by y=30.5x−60,384.4
To find number of students in 2016we will get
y=30.5×2016−60,384.4
y=61,488−60,384.4=
1,103.6
≈1,104
Here we see that the domain is (smallest to largest)
In the previous question the year was 2016 which is out of the domain and hence this is an example of Extrapolation
Hence we conclude that 2016 is out of the domain and hence this is an example of Extrapolation
Page 73 Problem 10 Answer
Given; The table gives enrollments at North Shore High School.

To find; Find the correlation coefficient to the nearest hundredth.
Here we will use a graphing calculator to find the correlation coefficient.
Round r to the nearest hundredth.
r=0.98
Hence the correlation coefficient to the nearest hundredth. is found to be r=0.98
Page 73 Problem 11 Answer
Given: The table gives enrollments at North Shore High School

To find: Describe the correlation.
Here by Using a graphing calculator to find the correlation coefficient.
Round r to the nearest hundredth.
r=0.98 here we see that the value of r=0.98
As the magnitude of r is greater than 0.75 it is strong and it is positive.
Hence As we see that the magnitude of r is greater than 0.75
so it is strong and it is positive. so a strong positive Correlation will exist
Cengage Financial Algebra 1st Edition Chapter 2 Exercise 2.2 Modeling a Business Page 73 Problem 12 Answer
Given ; r=0.21
To find; Describe each of the following correlation coefficients using the terms strong, moderate, or weak and positive or negative.
we have r=0.21
Types of Correlation
Positive Correlation – when the value of one variable increases concerning another.
Negative Correlation – when the value of one variable decreases concerning another.
No Correlation – when there is no linear dependence or no relation between the two variables
we know that A positive r means a positive correlation and a value close to zero means a weak correlation.
Hence we conclude that A positive r means a positive correlation and a value close to zero means a weak correlation.
Page 73 Problem 13 Answer
Given: r=−0.87
To find: Describe each of the following correlation coefficients using the terms strong, moderate, or weak and positive or negative.
we have r=−0.87
Types of Correlation
Positive Correlation – when the value of one variable increases concerning another.
Negative Correlation – when the value of one variable decreases concerning another.
No Correlation – when there is no linear dependence or no relation between the two variables.
Here we see that r is A negative r means a negative correlation and a value close to ±1 means a strong correlation.
Hence we conclude that A negative r means a negative correlation and a value close to ±1 means a strong correlation.
Page 73 Problem 14 Answer
Given ; r=0.55
To find; Describe each of the following correlation coefficients using the terms strong, moderate, or weak and positive or negative.
we have r=0.55
Types of Correlation Positive Correlation – when the value of one variable increases concerning another.
Negative Correlation – when the value of one variable decreases concerning another.
No Correlation – when there is no linear dependence or no relation between the two variables.
Here we noticed that A positive r means a positive correlation and a value close to ±0.5 means a moderate correlation.
Hence we conclude that A positive r means a positive correlation and a value close to ±0.5 means a moderate correlation.
Cengage Financial Algebra 1st Edition Chapter 2 Exercise 2.2 Modeling a Business Page 73 Problem 15 Answer
Given ; r=−0.099
To find; Describe each of the following correlation coefficients using the terms strong, moderate, or weak and positive or negative.
we have r=−0.099
Types of Correlation Positive Correlation – when the value of one variable increases concerning another.
Negative Correlation – when the value of one variable decreases concerning another.
No Correlation – when there is no linear dependence or no relation between the two variables.
here we noticed A negative r means a negative correlation and a value close to zero means a weak correlation
Hence we conclude A negative r means a negative correlation and a value close to zero means a weak correlation.
Page 73 Problem 16 Answer
Given ; r=0.99
To find; Describe each of the following correlation coefficients using the terms strong, moderate, or weak and positive or negative.
we have r=0.99
Types of Correlation Positive Correlation – when the value of one variable increases concerning another.
Negative Correlation – when the value of one variable decreases concerning another.
No Correlation – when there is no linear dependence or no relation between the two variables.
Here we see that A positive r means a positive correlation and a value close to means a strong correlation.
Hence we conclude that A positive r means a positive correlation and a value close to ±1 means a strong correlation.
Page 73 Problem 17 Answer
Given ; r=−0.49
To find; Describe each of the following correlation coefficients using the terms strong, moderate, or weak and positive or negative.
we have r=−0.49
Types of Correlation Positive Correlation – when the value of one variable increases concerning another.
Negative Correlation – when the value of one variable decreases concerning another.
No Correlation – when there is no linear dependence or no relation between the two variables.
Here we see that A negative r means a negative correlation and a value close to ±1 means a moderate correlation.
Hence we conclude that A negative r means a negative correlation and a value close to ±0.5 means a moderate correlation.
Page 74 Exercise 1 Answer
Here, we have to find the equation of the linear regression line. So, for that enter the ordered pairs (x is the price per song and y is a number of downloads) into your calculator.
Then use the statistics menu to calculate the linear regression equation. The equation is of the form y=mx+b, where m is the slope and b is the y-intercept.
Rounding the slope and y-intercept to the nearest hundredth, the equation of the linear regression line is y=−1,380.57x+2,634.90
So, the equation of the linear regression line is,y=−1,380.57x+2,634.90
Solutions For Cengage Financial Algebra Chapter 2 Exercise 2.2 Modeling A Business
Cengage Financial Algebra 1st Edition Chapter 2 Exercise 2.2 Modeling a Business Page 74 Exercise 2 Answer
Here, we have to find the slope of the linear regression line. As the line is y=−1,380.57x+2,634.90
Let us compare it with y= mx+c,where m is the slope,
y=mx+c=−1,380.57x+2,634.90, gives m=−1,380.57
So, the slope of the linear regression line m=−1,380.57
Page 74 Exercise 3 Answer
Here, we have to find the units of the slope when it is expressed as a rate.
The slope of dy/dx hence its units will be the units of y divided by units of x.
Unit of y is several downloads in thousands no unit is thousands of downloads, and x is the price so the unit is a dollar.
So, the unit of slope is thousands of downloads per dollar.
Page 74 Exercise 4 Answer
Here, we have to find out how many thousands of downloads would MyTunes expect if the price was changed to $0.45
For finding a number of downloads put x=0.45
y=−1,380.57×0.45+2,634.90
y=−621.2565+2,634.90
=2,013.6435
≈2,014
So, the thousands of downloads would MyTunes expect if the price was changed to $0.45 is 2,014
Page 74 Exercise 5 Answer
Here, we have to determine whether our answer to part d is an example of interpolation or extrapolation.
In the previous question, the value of the price was $0.45 which is within the domain and hence this is an example of interpolation.
So, our answer to part d is an example of interpolation.
Cengage Financial Algebra 1st Edition Chapter 2 Exercise 2.2 Modeling a Business Page 74 Exercise 6 Answer
Here, we have to find the correlation coefficient to the nearest hundredth.
So, for that use a graphing calculator to find the correlation coefficient.
Round r to the nearest hundredth.
So, the correlation coefficient to the nearest hundredth is r=−0.90
Page 74 Exercise 7 Answer
Here, we have to describe the correlation. As the magnitude of r is greater than 0.75
so it is strong and it is negative r=−0.90
So, it is a strong negative correlation.
Page 74 Exercise 8 Answer
Here, we have to find the equation of the linear regression line. It’s given that

Comparing it with y=mx+c,where m is slope,
y=mx+c=0.22x−0.27,m=0.22
So, the slope of the linear regression line is m=0.22
Page 74 Exercise 9 Answer
Here, we have to find the slope of the linear regression line. It’s given that
Comparing it with y=mx+c,where m is slope,
y=mx+c=0.22x−0.27,m=0.22
So, the slope of the linear regression line is m=0.22
Page 74 Exercise 10 Answer
Here, we have to find the units of the slope when it is expressed as a rate. It’s given that

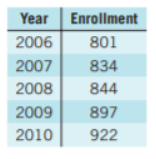
Unit of y is tip dollars, and x is the restaurant bill amount.
The unit of the slope will be tip dollars per restaurant bill amount.
So, the units of the slope when it is expressed as a rate tip dollars per restaurant bill amount.
Page 74 Exercise 11 Answer
Here, we have to find what tip would Julie receive if the restaurant bill were $120. Given that
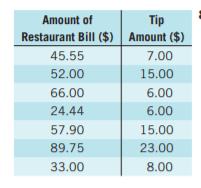
Julie is a waitress and on the left is a log of her tips for yesterday’s shift.
To find tip amount put x=120
y=0.22×120−0.27
y=26.4−0.27
26.13
≈26
So, the tip amount received by Julie if the restaurant bill were $120 is $26
Cengage Financial Algebra 1st Edition Chapter 2 Exercise 2.2 Modeling a Business Page 74 Exercise 12 Answer
Here, we want to determine whether our answer to part d is an example of interpolation or extrapolation. It’s given that

Julie is a waitress and on the left is a log of her tips for yesterday’s shift.
In previous question the value of bill amount was $120 which is out of the domain and hence this is an example of Extrapolation
So, the answer to part d is an example of Extrapolation,$120 is outside of the original domain
Page 74 Exercise 13 Answer
Here, we have to find the correlation coefficient for this data. It’s given that

Julie is a waitress and on the left is a log of her tips for yesterday’s shift.
Use a graphing calculator to find the correlation coefficient.
Round r to the nearest hundredth r=0.75
So, the correlation coefficient for this data is r=0.75
Here, we have to describe the correlation. It’s given that Julie is a waitress and on the left is a log of her tips for yesterday’s shift.
Since r is greater than 0.3 but not greater than 0.75 hence it’s moderate.
So, it’s a moderate positive correlation.
Page 74 Exercise 14 Answer
Here, we have to write the formula that can be used to compute the predicted tips. It’s given that

Julie is a waitress and on the left is a log of her tips for yesterday’s shift.
This will directly followed by the equation of regression that we have found out, y=0.22x−0.27,as y was tip and x was restaurant bill
Tip=0.22x restaurant bill−0.27
So, the formula that can be used to compute the predicted tips is Tip=0.22x restaurant bill−0.27
Cengage Financial Algebra 1st Edition Chapter 2 Exercise 2.2 Modeling a Business Page 74 Exercise 15 Answer
Here, we have to explain why the sign of the slope of a regression line must be the same as the sign of the correlation coefficient.

A positive slope means the line is increasing, which means as x increase, y increases.
If y increases as x increase, the correlation coefficient is positive.
A negative slope means the line is decreasing, which means as x increases, y decreases.
If y decreases as x increases, the correlation coefficient is negative.
Page 74 Exercise 16 Answer
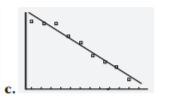
Here, we have to find which of the following scatterplots shows a correct line of best fit.
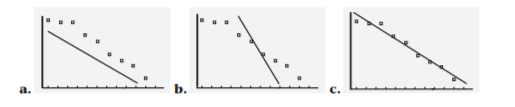
For the best fit, sum of distance of points from line should be minimum and this is clearly seen that all the points are on one side of line so it is definitely not a best fit line as if we will move the line towards the points distance from all the points will decrease and hence sum will also decrease so this is not the best fit line.
For the best fit, sum of distance of points from line should be minimum and this is clearly seen that if we rotate the line about mid point in anticlockwise sense the distance of line from all the points will decrease and hence sum will also decrease so this is not the best fit line.
This is the best fit line as it seems to have a sum of distance if points from the line are minimum if we try to rotate it sum points will go away some will come near and so is the case for displacing the line.
So, among the following scatter plots, the best fit line is Figure (c)
Cengage Financial Algebra 1st Edition Chapter 2 Exercise 2.2 Modeling a Business Page 74 Exercise 18 Answer
Here, we have to determine whether is it possible for a linear regression line to go through every point on the scatter plot and also is it possible for a linear regression line to not go through any point on the scatter plot.
Yes, if the points are linear, the regression line will go through every point. If the points are not linear, it may not go through any point on the scatter plot.
Cengage Financial Algebra Exercise 2.2 Modeling A Business Key
Chapter 2 Solving Linear Inequalities
- Cengage Financial Algebra 1st Edition Chapter 2 Assessment Modeling a Business
- Cengage Financial Algebra 1st Edition Chapter 2 Exercise 2.1 Modeling a Business
- Cengage Financial Algebra 1st Edition Chapter 2 Exercise 2.3 Modeling a Business
- Cengage Financial Algebra 1st Edition Chapter 2 Exercise 2.4 Modeling a Business
- Cengage Financial Algebra 1st Edition Chapter 2 Exercise 2.5 Modeling a Business
- Cengage Financial Algebra 1st Edition Chapter 2 Exercise 2.6 Modeling a Business
- Cengage Financial Algebra 1st Edition Chapter 2 Exercise 2.7 Modeling a Business
- Cengage Financial Algebra 1st Edition Chapter 2 Exercise 2.8 Modeling a Business