
Cengage Financial Algebra 1st Edition Chapter 2 Exercise 2.1 Modeling a Business
Page 66 Problem 1 Answer
Given: A local coffee shop sells hot chocolate.
The manager keeps track of the temperature for the entire year and the hot chocolate sales.
A scatterplot is graphed with temperature on the horizontal axis and hot chocolate sales on the vertical ax
To find; Do you think the scatterplot shows a positive or negative correlation? Is there causation? Explain.
As the temperature rises, the hot chocolate sales generally decrease
So, there is a correlation between the data.
Because the y-values increase when the x-values decreases ,the correlation is negative
Additionally, the rise in temperature caused the decreased in the number of hot chocolate sold.
Therefore,the temperature is the explanatory variable and the number of hot c
Hence we conclude that the temperature is the explanatory variable and the number of hot chocolate is the response variable
Page 67 Problem 2 Answer
Given: negative correlation but there is no causation
To find; Think of an example of data that might have a negative correlation but there is no causation.
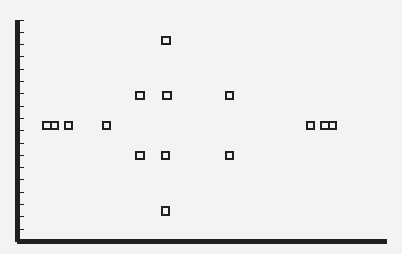
let suppose The scatter plot at the right shows the relationship between the number of text messages made by each of ten juniors while studying for Mr. Patel chemistry test last week and their scores on the test.
As the number of text messages increases, test grades do not increase,
so there is no positive correlation.
As the number of text messages increases, test grades do not decrease,
so there is negative correlation. There is no trend in the data, so there is no correlation
Read and Learn More Cengage Financial Algebra 1st Edition Answers
Another example for negative correlation are

Possible examples could then be:- Amount of water remaining in a pool and the number of minutes the pool has been draining.
The amount of money owed on a loan and the number of months making payments.
The distance from home and the number of minutes walking from school to home.
Hence we conclude that there is a negative correlation. There is no trend in the data, so there is no correlation
Cengage Financial Algebra 1st Edition Chapter 2 Exercise 2.1 Modeling a Business Solutions
Cengage Financial Algebra 1st Edition Chapter 2 Exercise 2.1 Modeling a Business Page 67 Problem 3 Answer
Given; Students in a biology class measure the circumference and diameter of every tree on the school property.
The students create a table of ordered pairs and plan to draw a scatterplot.
To find; Should there be a positive correlation, a negative
A scatter plot (aka scatter chart, scatter graph) uses dots to represent values for two different numeric variables.
The position of each dot on the horizontal and vertical axis indicates values for an individual data point.
Scatter plots are used to observe relationships between variables.
The example scatter plot above shows the diameters and heights for a sample of fictional trees.
Each dot represents a single tree; each point’s horizontal position indicates that tree’s diameter (in centimeters) and the vertical position indicates that tree’s height (in meters).
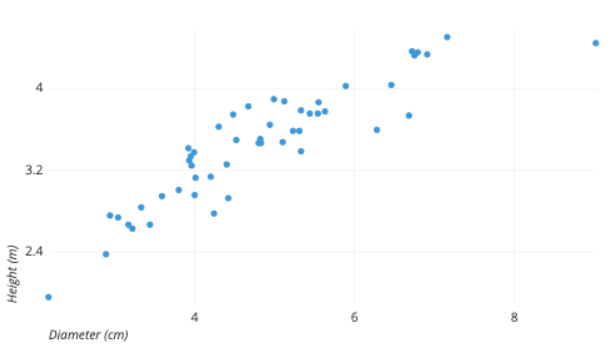
From the plot, we can see a generally tight positive correlation between a tree’s diameter and its height.
We can also observe an outlier point, a tree that has a much larger diameter than the others.
This tree appears fairly short for its girth, which might warrant further investigation.
Hence we conclude that From the plot, we can see a generally tight positive correlation between a tree’s diameter and its height.
Page 68 Problem 4 Answer
Given: statement about the bussiness
To find: here we have explain how the quote can be interpreted by a business person
Here gieving with some example “To guess is cheap” implies that making a guess doesn’t cost you a lot, because you can use little resources in order to make a guess and thus it won’t cost you a lot of money to make a guess about something.
However, if you guess wrongly, then it could become very expensive.
Because if you invest a lot of money in your guess and your guess was incorrect, then you could potentially lost a lot of your money (or even all of your money) and guessing wrongly thus could be expensive.
Here we conclude that Making a guest doesn’t cost a lot of money, but you could lose a lot of money if you guess wrongly.
Page 68 Problem 5 Answer
Given; A scatterplot shows the number of days that have passed and the number of days left in a month.
To find; Is there a positive or negative correlation? Explain.
There is a negative correlation, because if the number of days that have passed increase, the number of days that are left will decrease.
Hence we conclude that by negative correlation, the number of days that are left will decrease.
Page 68 Problem 6 Answer
Given ;

To find: Examine each scatterplot. Identify each as showing a positive correlation, a negative correlation, or no correlation.
we have scatter plot here from the graph we see that the value of one variable increases when the value of the other increases.
so there will be positive corelation will exit
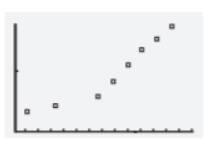
Hence we conclude that the graph will contain positive corelation
Cengage Financial Algebra 1st Edition Chapter 2 Exercise 2.1 Modeling a Business Page 68 Problem 7 Answer
Given :

To find: Examine each scatterplot. Identify each as showing a positive correlation, a negative correlation, or no correlation.
we have Here we see that In the given scatterplot, we note that the pattern slopes downwards and thus we have a negative correlation.
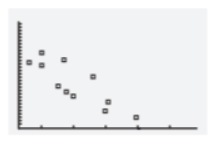
Hence we conclude that the pattern slopes downwards and thus we have a negative correlation.
Page 68 Problem 8 Answer
Given :
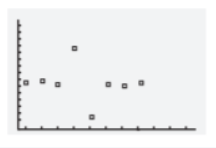
To find: Examine each scatterplot. Identify each as showing a positive correlation, a negative correlation, or no correlation.
we have Here we see that from the graph No correlation, exist because if you sketch a line through the given points, this line will be horizontal (or have a zero slope) and thus the data contains no correlation.

Hence we conclude that the graph No correlation, exist because if you sketch a line through the given points, this line will be horizontal and thus the data contains no correlation.
Cengage Financial Algebra Chapter 2 Exercise 2.1 Modeling A Business Answers
Cengage Financial Algebra 1st Edition Chapter 2 Exercise 2.1 Modeling a Business Page 68 Problem 9 Answer
Given ;
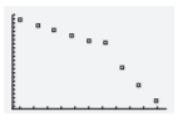
To find; Examine each scatterplot. Identify each as showing a positive correlation, a negative correlation, or no correlation
we have From the graph we see that because if you sketch a line through the given points, this line will be descending (or have a negative slope) and thus the data contains a negative correlation.

Hence we conclude that the graph will contain negative correlation as the slope the line are descending .
Page 68 Problem 10 Answer
Given ;

To find ; Examine each scatter plot. Identify each as showing a positive correlation, a negative correlation, or no correlation.
we have given graph
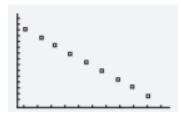
Here if we see from the graph we conclude that if you sketch a line through the given points, this line will be descending (or have a negative slope) and thus the data contains a negative correlation.
Hence the graph will contain negative corelation as given points, the line are descending
Cengage Financial Algebra 1st Edition Chapter 2 Exercise 2.1 Modeling a Business Page 68 Problem 11 Answer
Given ;

To find ; Examine each scatterplot. Identify each as showing a positive correlation, a negative correlation, or no correlation.
we have
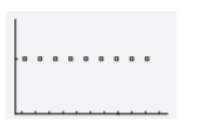
Here we see form the graph that there will be No correlation, because if you sketch a line through the given points, this line will be horizontal (or have a zero slope) and thus the data contains no correlation.
Hence we conclude that there will be no relation will exist the data contains no correlation.
Page 68 Problem 12 Answer
Given: the personal income per capita (per person) in the United States for seven selected years.
To find; Draw a scatterplot for the data.

As the x-values increase, the y-values decrease.
Therefore, this scatterplot shows a negative correlation between the two variables.

Hence we see tha scatter plot this scatterplot shows a negative correlation between the two variables.
Page 68 Problem 13 Answer
Given ; The table shows the personal income per capita (per person) in the United States for seven selected years.
To find; Describe the correlation.
As the x-values increase, the y-values decrease.
Therefore, this scatterplot shows a negative correlation between the two variables.
The year is on the x−axis and the per capita income in dollars is on the y−axis.
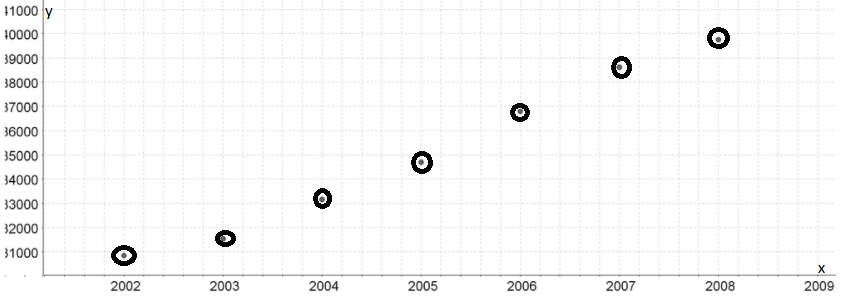
The graph indicates a positive correlation, because the points in the scatterplot slope upwards, or in other words, if you sketch a line through the given points, this line will be ascending (have a positive slope).
Hence we conclude that The year is on the x−axis and the per capita income in dollars is on the y−axis.

The graph indicates a positive correlation, because the points in the scatterplot slope upwards, or in other words, if you sketch a line through the given points, this line will be ascending (have a positive slope).
Solutions For Cengage Financial Algebra Chapter 2 Exercise 2.1 Modeling A Business
Cengage Financial Algebra 1st Edition Chapter 2 Exercise 2.1 Modeling a Business Page 69 Exercise 1 Answer
Given ;
(100,4),(100,4),(100,3),(250,3),(250,2),(250,2)
(500,1),(500,2),(500,1),(1,000,1),(1,000,2),(1,000,1)
Twelve people were given different daily doses of vitamin C, in milligrams, for a year
To find; Construct a scatterplot.
The daily dose of vitamin C is on the x-axis and the number of colds is on the y-axis

Hence we have plotted the scatter graph for ordered pairs gives the results of a science experiment.
Twelve people were given different daily doses of vitamin C
Page 69 Exercise 2 Answer
Given; They reported the number of colds they got during the year
(100,4),(100,4),(100,3),(250,3),(250,2),(250,2)
(500,1),(500,2),(500,1),(1,000,1),(1,000,2),(1,000,1)
To find; Describe the correla
The daily dose of vitamin C is on the x-axis and the number of colds is on the y
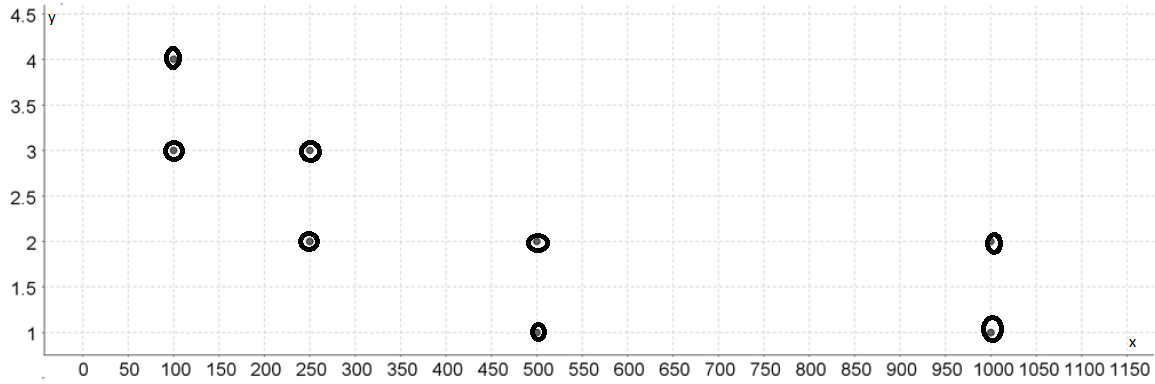
Hence we see the Negative correlation, because if you sketch a line through the given points, this line will be descending (or have a negative slope) and thus the data contains a negative correlation.

Hence we conclude that the data contains a negative correlation.
Page 69 Exercise 3 Answer
Given ;
(100,4),(100,4),(100,3),(250,3),(250,2),(250,2)
(500,1),(500,2),(500,1),(1,000,1),(1,000,2),(1,000,1)
To find : Should the scientists label the vitamin C intake the explanatory variable and the number of colds the response variable?
Explain here we see that The variable which cause the change in the other variable in the explanatory variable, while the affected variable is the response variable.
The number of colds is affected by the daily dose of vitamin C (and not the other way around), thus the daily dose of vitamin C is the explanatory variable and the number of colds is the response variable.
Hence we conclude that yes the scientists label the vitamin C intake the explanatory variable and the number of colds the response variable
Page 69 Exercise 4 Answer
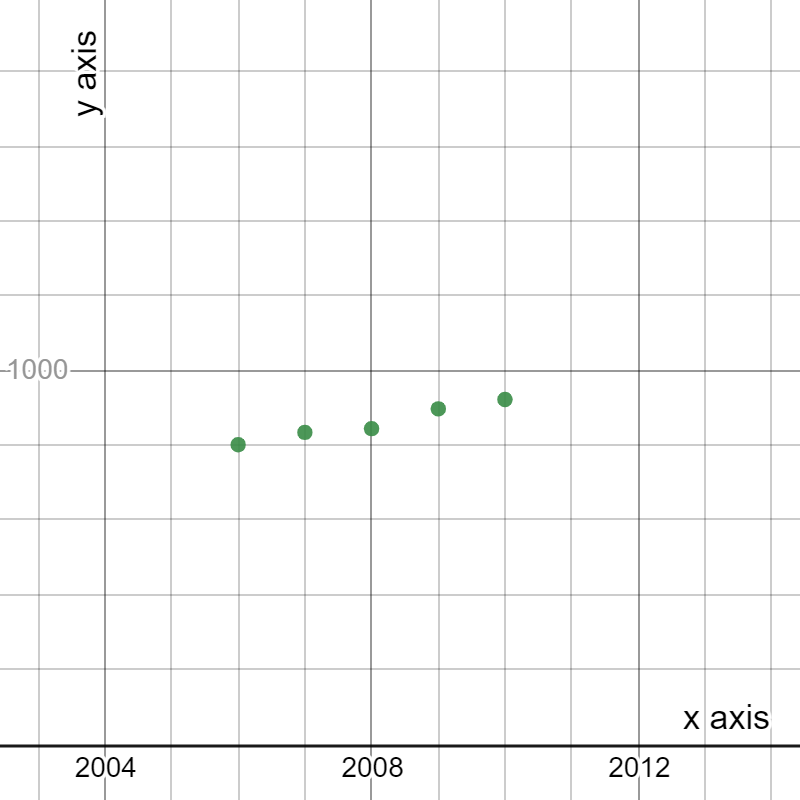
Given; If x represents the year and y represents the enrollment,
To find; draw a scatter plot to depict t
The year is on the x axis and the enrollment is on the y-axis.
Hence we draw a scatter plot to depict the data. by The enrollment at North Shore High School

Cengage Financial Algebra Exercise 2.1 Modeling A Business Key
Page 69 Exercise 5 Answer
Given; The enrollment at North Shore High School is given in the table. In each year, the number of students on the baseball team was 19
To find; Describe the correlation from the scatter plot.
The year is on the x axis and the enrollment is on the y-axis.

The grap g shows the Positive correlation because if you sketch a line through the given points, this line will be ascending (or have a positive slope) and thus the data contains a positive correlation.
hence we conclude that the data contains a positive correlation.
Cengage Financial Algebra 1st Edition Chapter 2 Exercise 2.1 Modeling a Business Page 69 Exercise 6 Answer
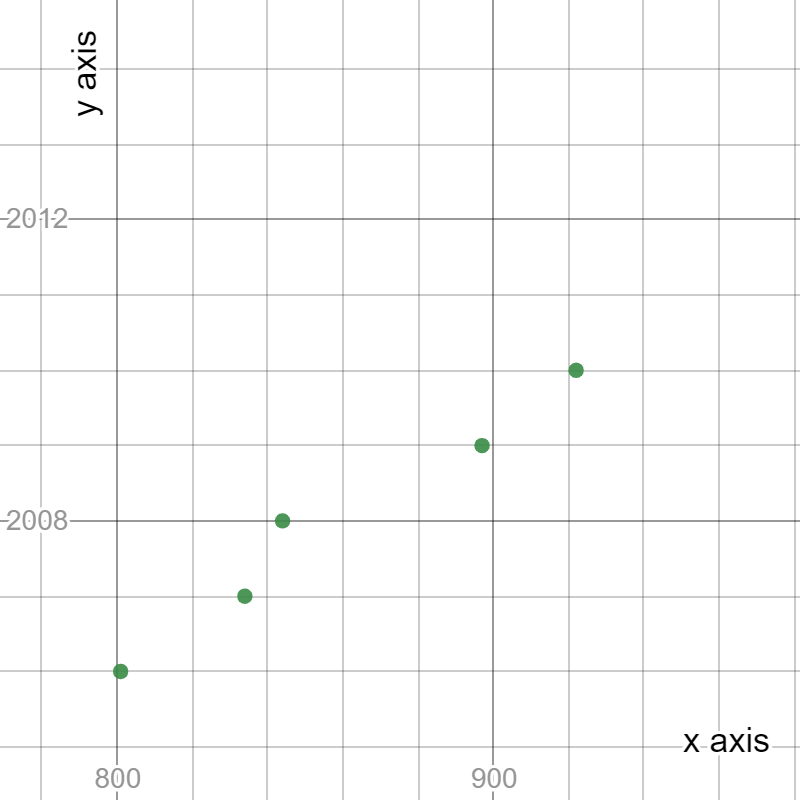
Given; If x represents the enrollment and y represents the number of students on the baseball team
To find; draw a scatterplot to depict the data.
The enrollment is on the x -axis and the year is on the y-axis
Hence the scatter plot for the given for the enrollment and y represent the number of students on the baseball team

Page 69 Exercise 7 Answer
Given; The enrollment at North Shore High School is given in the table. Each year,
To find: Describe the correlation from the scatterplot
The enrollment is on the x-axis and the year is on the y-axis

Hence we conclude that ithe graph has a Positive correlation, because if you sketch a line through the given points, this line will be ascending (or have a positive slope) and thus the data contains a positive correlation.
Hence we cocnlude that the data contains a positive correlation.

Detailed Solutions For Cengage Financial Algebra Chapter 2 Exercise 2.1 Informational
Cengage Financial Algebra 1st Edition Chapter 2 Exercise 2.1 Modeling a Business Page 69 Exercise 8 Answer
Given; state’s population
To find ; . Find your state’s population for each of the last ten years.
here we will choose to use the state of america, but you could use the population of any other states instead.
I was able to find the population per year for the state but there might be other useful websites online.
| Year x | Population y |
| 2010 | 6,355,882 |
| 2011 | 6,396,281 |
| 2012 | 6,450,632 |
| 2013 | 6,490,795 |
| 2014 | 6,540,007 |
| 2015 | 6,590,726 |
| 2016 | 6,649,404 |
| 2017 | 6,715,984 |
| 2018 | 6,782,564 |
| 2019 | 6,849,144 |
Hence we have found the population for each of the last ten years. for america
Page 69 Exercise 9 Answer
Given: Let x represent the year, and let y represent the population.
To find: Create a table of bivariate data
Here we will choose to use the population of America, but you could use the population of any country, state, city, etc. instead.
It is most often very easy to find the population of a country for a number of years online
| Year x | Population y |
| 1955 | 8,887,274 |
| 1960 | 9,167,365 |
| 1965 | 9,443,939 |
| 1970 | 9,632,180 |
| 1975 | 9,771,586 |
| 1980 | 9,868,995 |
| 1985 | 9,916,578 |
| 1990 | 10,006,544 |
| 1995 | 10,186,305 |
| 2000 | 10,282,033 |
| 2005 | 10,546,886 |
| 2010 | 10,938,739 |
| 2015 | 11,287,940 |
Hence we created a table of bivariate data for cities
| 1955 | 8,887,274 |
| 1960 | 9,167,365 |
| 1965 | 9,443,939 |
| 1970 | 9,632,180 |
| 1975 | 9,771,586 |
| 1980 | 9,868,995 |
| 1985 | 9,916,578 |
| 1990 | 10,006,544 |
| 1995 | 10,186,305 |
| 2000 | 10,282,033 |
| 2005 | 10,546,886 |
| 2010 | 10,938,739 |
| 2015 | 11,287,940 |
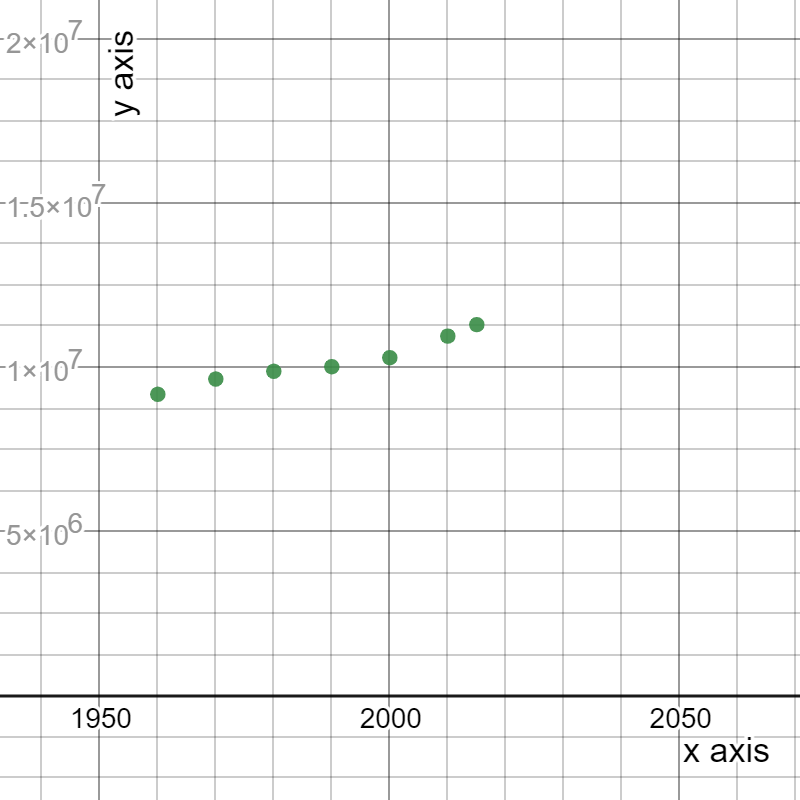
Page 69 Exercise 10 Answer
Here we will choose to use the population of America, but you could use the population of any country, state, city, etc. instead.
It is most often very easy to find the population of a country for a number of years online
| Year x | Population y |
| 1955 | 8,887,274 |
| 1960 | 9,167,365 |
| 1965 | 9,443,939 |
| 1970 | 9,632,180 |
| 1975 | 9,771,586 |
| 1980 | 9,868,995 |
| 1985 | 9,916,578 |
| 1990 | 10,006,544 |
| 1995 | 10,186,305 |
| 2000 | 10,282,033 |
| 2005 | 10,546,886 |
| 2010 | 10,938,739 |
| 2015 | 11,287,940 |

Hence we conclude and scatter the plot for the given data
Cengage Financial Algebra 1st Edition Chapter 2 Exercise 2.1 Modeling a Business Page 69 Exercise 11 Answer
Here we will choose to use the state of america, but you could use the population of any other states instead.
I was able to find the population per year for the state, but there might be other useful websites online.
| Year x | Population y |
| 2010 | 6,355,882 |
| 2011 | 6,396,281 |
| 2012 | 6,450,632 |
| 2013 | 6,490,795 |
| 2014 | 6,540,007 |
| 2015 | 6,590,726 |
| 2016 | 6,649,404 |
| 2017 | 6,715,984 |
| 2018 | 6,782,564 |
| 2019 | 6,849,144 |
We note that as the year increases that the population increases, which indicates that there is a positive correlation
Hence we cocclude the difference and relation between the corelation and we cocnlude that as the year increases that the population increases, which indicates that there is a positive correlation.
Practice Problems For Cengage Financial Algebra Exercise 2.1 Modeling A Business
Chapter 2 Solving Linear Inequalities
- Cengage Financial Algebra 1st Edition Chapter 2 Exercise 2.1 Modeling a Business
- Cengage Financial Algebra 1st Edition Chapter 2 Exercise 2.2 Modeling a Business
- Cengage Financial Algebra 1st Edition Chapter 2 Exercise 2.3 Modeling a Business
- Cengage Financial Algebra 1st Edition Chapter 2 Exercise 2.4 Modeling a Business
- Cengage Financial Algebra 1st Edition Chapter 2 Exercise 2.5 Modeling a Business
- Cengage Financial Algebra 1st Edition Chapter 2 Exercise 2.6 Modeling a Business
- Cengage Financial Algebra 1st Edition Chapter 2 Exercise 2.7 Modeling a Business
- Cengage Financial Algebra 1st Edition Chapter 2 Exercise 2.8 Modeling a Business