HMH Algebra 2 Volume 1 1st Edition Module 2 Chapter 2 Exercise 2.1 Absolute Value, Functions, Equations And Inequalities
Page 64 Problem 1 Answer
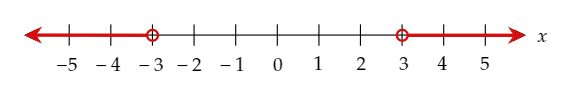
The given equation is r+9=7.
The question requires to solve the given equation.
To find the required value, use subtraction in the given equation to isolate the variable r on one side of the equation.
Subtract 9 from both sides of the given equation, and combine the terms.
r+9−9=7−9
r=−2
Thus, the solution is r=−2.
The required solution is r=−2.
Page 64 Problem 2 Answer
The given equation is w/4=−3.
The question requires to solve the given equation.
To find the required value, use multiplication in the given equation to isolate the variable w on one side of the equation.
Multiply both sides of w/4=−3 by 4.
W/4(4)=−3(4)
w=−12
Thus, the solution is w=−12.
The required solution is w=−12.
Page 64 Problem 3 Answer
The given equation is 10b=14.
The question requires to solve the given equation.
To find the required value, use division in the given equation to isolate the variable b on one side of the equation.
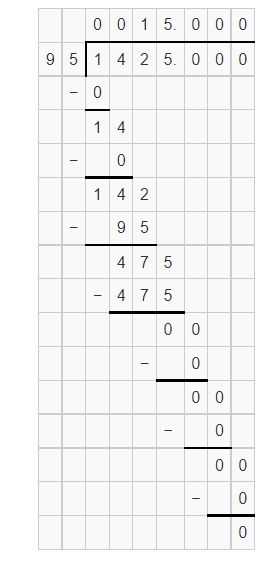
Divide both sides of 10b=14 by 10.
10b/10=14/10
b=1.4
Thus, the solution is b=1.4.
The required solution is b=1.4.
HMH Algebra 2 Module 2 Chapter 2 Exercise 2.1 Solutions
HMH Algebra 2 Volume 1 1st Edition Module 2 Chapter 2 Exercise 2.1 Absolute Value, Functions, Equations And Inequalities Page 64 Problem 4 Answer
The given equation is 3y=2(x−3).
The question requires to determine the slope and y-intercept.
To determine the required slope and y-intercept, isolate the variable y on one side of the equation using division to rewrite it in slope-intercept form.
Then, compare the obtained equation with the slope-intercept form y=mx+b to find the values of m and b, and thus, the required slope and y-intercept.
Multiply the terms in the equation 3y=2(x−3), and then divide both sides by 3.
3y=2x−6
3y/3=2x−6/3
y=2/3
x−2…………(1)
Compare equation (1) with the slope-intercept form y=mx+b, and write the values of m and b.
m=2/3
b=−2
Thus, the slope and y-intercept of the given equation are 2/3 and −2respectively.
The required slope and y-intercept are 2/3 and −2 respectively.
Page 64 Problem 5 Answer
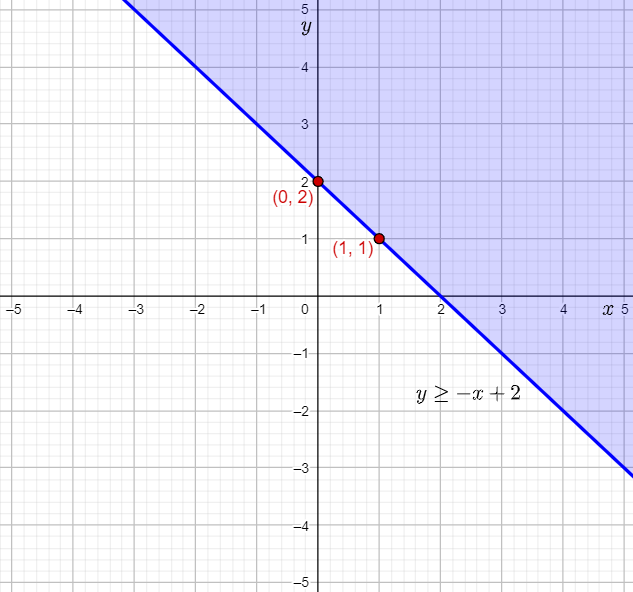
The given inequality is y≥−x+2.
The question requires to graph and label the given inequality on the coordinate plane.
To graph, the inequality, write the equation for the boundary line of the given inequality, and compare it to the slope-intercept form y=mx+b to find the values of m and b, and thus, find the slope and y-intercept of the boundary line.
Then, use the slope and y-intercept to find two points lying on the boundary line.
Next, use an arbitrary point to determine the direction in which the graph of the inequality will be shaded.
Finally, use the obtained points to graph and label the given inequality on the coordinate plane.
The equation of the boundary line for the inequality y≥−x+2 is: y=−x+2
Compare the equation of the boundary line with the slope-intercept form y=mx+b, and write the values of m and b.
m=−1
b=2
Therefore, the slope and y-intercept are −1 and 2 respectively.
Thus, the boundary line passes through (0,2).
The slope of the boundary line is −1, that is −1/1.
The point (0,2) lies on the boundary line.
Therefore, a second point lying on the boundary line is 0+1,2−1)=(1,1).
Assume the arbitrary point (0,0).
Substitute 0 for x and 0 for y in the inequality y≥−x+2.
0≥−0+2
0≥2
Therefore, the point (0,0) does not satisfy the inequality y≥−x+2.
Thus, the inequality y≥−x+2 will be shaded away from the the origin (0,0).
Graph the y-intercept of (0,2), plot the second point (1,1), draw a solid line through the points, and shade the region above the line, that is away from the origin (0,0).

Then, label the inequality graphed.
The required labelled graph is
HMH Algebra 2 Volume 1 1st Edition Module 2 Chapter 2 Exercise 2.1 Absolute Value, Functions, Equations And Inequalities Page 64 Problem 6 Answer
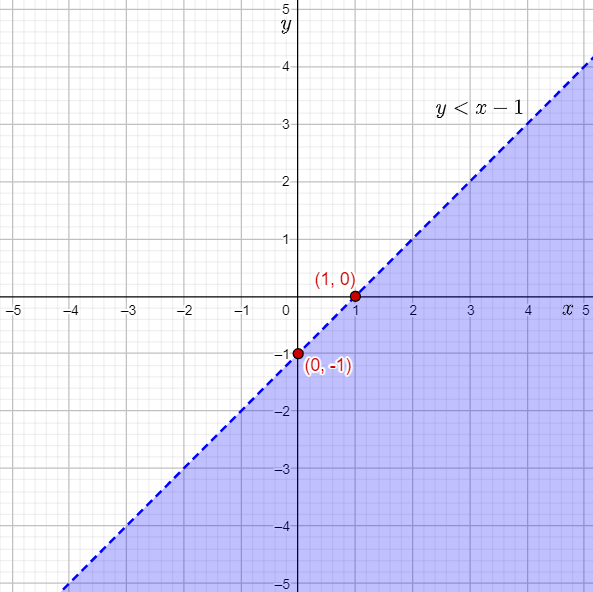
The given inequality is y<x−1.
The question requires to graph and label the given inequality on the coordinate plane.
To graph the inequality, write the equation for the boundary line of the given inequality, and compare it to the slope-intercept form y=mx+b to find the values of m and b, and thus, find the slope and y-intercept of the boundary line.
Then, use the slope and y-intercept to find two points lying on the boundary line.
Next, use an arbitrary point to determine the direction in which the graph of the inequality will be shaded.
Finally, use the obtained points to graph and label the given inequality on the coordinate plane.
The equation of the boundary line for the inequality y<x−1 is: y=x−1
Compare the equation of the boundary line with the slope-intercept form y=mx+b, and write the values of m and b.
m=1
b=−1
Therefore, the slope and y-intercept are 1 and −1 respectively.
Thus, the boundary line passes through (0,−1).
The slope of the boundary line is 1, that is 1/1.
The point (0,−1) lies on the boundary line.
Therefore, a second point lying on the boundary line is 0+1,−1+1)=(1,0).
Assume the arbitrary point (0,0).
Substitute 0 for x and 0 for y in the inequality y<x−1.
0<0−1
0<−1
Therefore, the point (0,0) does not satisfy the inequality y<x−1.
Thus, the inequality y<x−1 will be shaded away from the origin (0,0).
Graph the y-intercept of (0,−1), plot the second point (1,0), draw a dashed line through the points, and shade the region below the line, that is away from the origin (0,0).
Then, label the inequality graphed.
The required labelled graph is:
The features of the graph of an absolute value function can be identified by sketching its graph and observing the features.
First, the input-output table for the absolute value function has to be constructed.
Next, the coordinates of a few points lying on the graph are written and plotted.
Then, the graph of the absolute value function is graphed using the points.
The drawn graph can be observed to find the features of the absolute value function such as its shape, symmetry, domain, and range.
The features of the graph of an absolute value function can be identified by sketching its graph and observing the features such as its shape, symmetry, domain, and range.

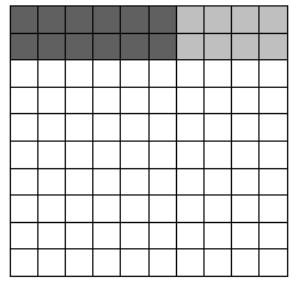
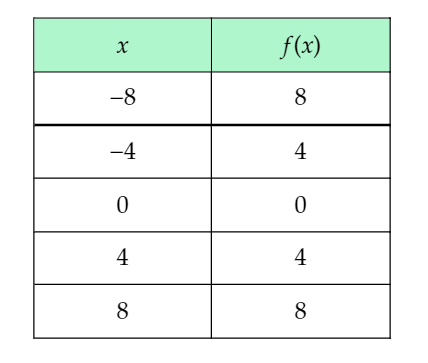
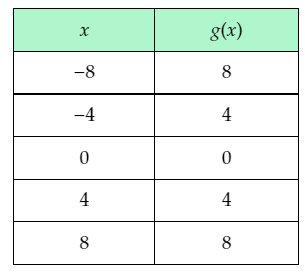
Page 65 Problem 7 Answer
The given table shows the values of some inputs of the absolute value function f(x)=∣x∣, which can be written as the piecewise function:
f(x)={x x≥0−x x<0
The question requires to complete the given input-output table.
To complete the table, use the given piecewise function to determine the value of output for each input, and then use the outputs to complete the input-output table.
Substitute −8 for x in the absolute value function f(x)=∣x∣, and simplify using the piecewise definition of the absolute value function.
f(−8)=∣−8∣
=−(−8)
=8
Therefore, when the input is −8, the output is 8.
Substitute −4 for x in the absolute value function f(x)=∣x∣, and simplify using the piecewise definition of the absolute value function.
f(−4)=∣−4∣
=−(−4)
=4
Therefore, when the input is −4, the output is 4.
Substitute 0 for x in the absolute value function f(x)=∣x∣, and simplify using the piecewise definition of the absolute value function.
f(0)=∣0∣
=0
Therefore, when the input is 0, the output is 0.
Substitute 4 for x in the absolute value function f(x)=∣x∣, and simplify using the piecewise definition of the absolute value function.
f(4)=∣4∣
=4
Therefore, when the input is 4, the output is 4.
Substitute 8 for x in the absolute value function f(x)=∣x∣, and simplify using the piecewise definition of the absolute value function.
f(8)=∣8∣
=8
Therefore, when the input is 8, the output is 8.
Complete the given input-output table using the calculated outputs.

The completed input-output table is:

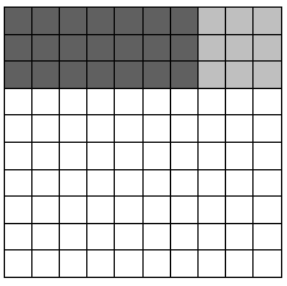
Page 65 Problem 8 Answer
It is given that the absolute value function f(x)=∣x∣ can be written as the piecewise function:
f(x)={ x x≥0−x x<0
The question requires to plot the points obtained from the previous part of this exercise on the coordinate grid, and use the points to complete the graph of the absolute value function.
Given the input-output table completed in the previous part of this exercise:
To plot the points and graph the function, use the input-output table to write the coordinates of points lying on the graph of f(x)=∣x∣, and connect the points to sketch the graph of the function.
The points lying on the graph of f(x)=∣x∣ are of the form (x,f(x)).
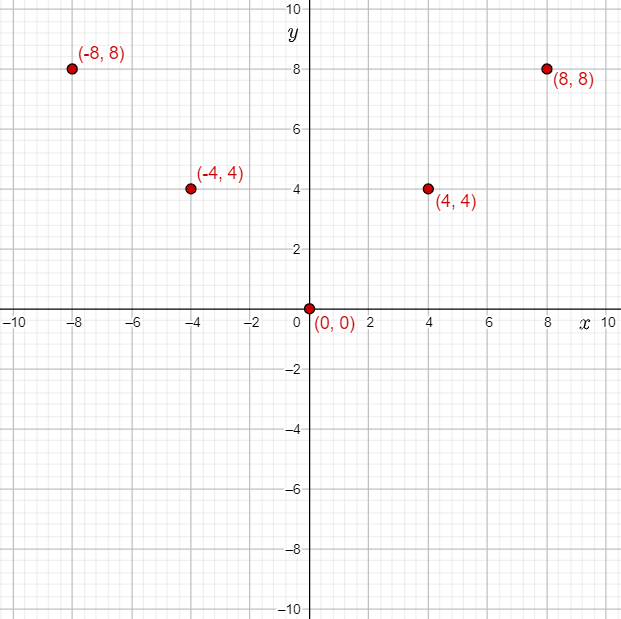
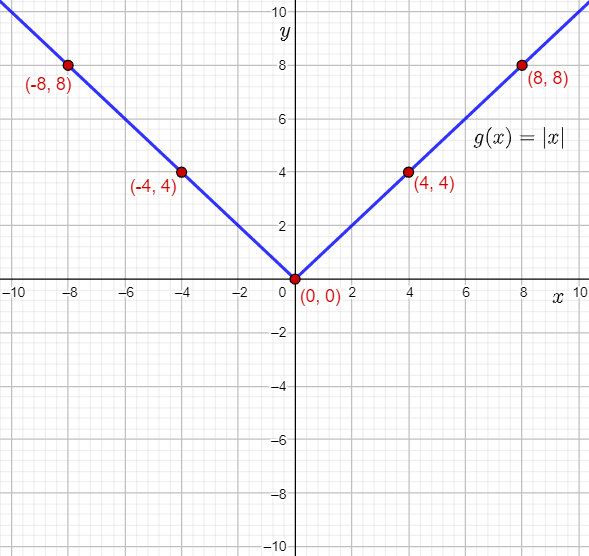
From the input-output table, it can be determined that the points (−8,8),(−4,4),(0,0),(4,4),(8,8) lie on the graph of f(x)=∣x∣.
Plot the points on the coordinate grid.
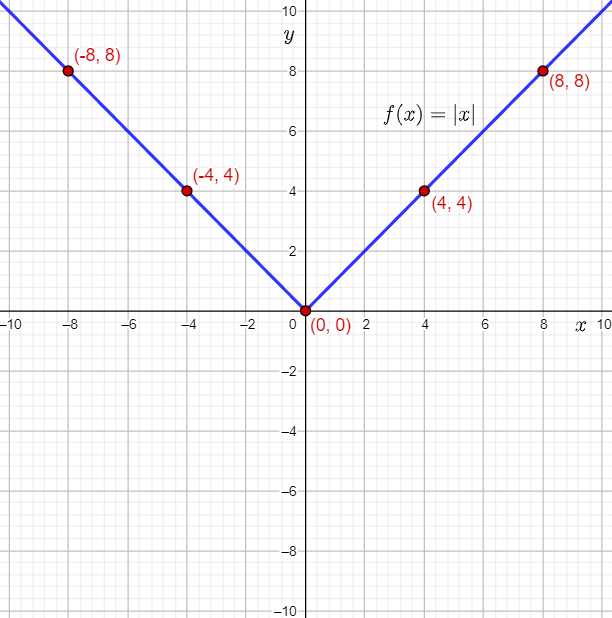
Join the points and draw straight lines to form the graph of the function f(x)=∣x∣.
The required plot of the points, and the graph of the function f(x)=∣x∣ is:

Absolute Value Functions And Inequalities Exercise 2.1 Answers HMH Algebra 2
HMH Algebra 2 Volume 1 1st Edition Module 2 Chapter 2 Exercise 2.1 Absolute Value, Functions, Equations And Inequalities Page 65 Problem 9 Answer
The given incomplete statements state the features of the graph of the absolute value function f(x)=∣x∣.
The question requires to complete the given statements about the features of the absolute value function, using the graph sketched in the previous part of this exercise.
Given the graph of the absolute value function f(x)=∣x∣ sketched in the previous part of this exercise:
To complete the statements, observe the graph of the function and use it to determine the line about which the function is symmetric, its domain, and its range.

From the graph of the absolute value function, it can be observed that f(x)=∣x∣ is symmetric about the y-axis.
This means that the absolute value function f(x)=∣x∣ is an even function.
It can be observed that the graph of the function f(x)=∣x∣ stretches infinitely towards the left and right. Therefore, the absolute value function is defined for all values of x.
Hence, the domain of f(x)=∣x∣ is all real numbers.
It can be observed that the points lying on the graph of the function f(x)=∣x∣lie either on, or above the x-axis. Therefore, the values of the outputs f(x) can be either 0, or greater than 0.
Thus, the range of f(x)=∣x∣ is all non-negative real numbers.
The function f(x)=∣x∣ is symmetric about the y-axis, and therefore is an even function.
The domain of f(x)=∣x∣ is all real numbers.
The range of f(x)=∣x∣ is all non-negative real numbers.
Page 66 Problem 10 Answer
The given function is g(x)= −1/2(x+3)+1 . The incomplete solution to graph the function is given.
The question requires to predict how the graph of the given function will look, and verify this using a graphing calculator.
Then, it is required to sketch the graph of the given function.
To sketch the graph, write the translations used to form the given function from the parent absolute value function f(x)=∣x∣, and use them on the vertex to determine the vertex of g(x).
Next, write the coefficient of the expression with the independent variable in the given function to write the stretch or compress required.
Then, take two points lying on the parent absolute value function, and determine the location where they will be mapped on g(x) using the transformations used to form g(x) from f(x).
Finally, plot the points and vertex and graph the given function.
The vertex of the parent absolute value function f(x)=∣x∣ is (0,0).
The vertex of g(x) is the point where (0,0) will be mapped using translations.
It can be observed that g(x) involves translations of f(x) by 3 units to the left and 1 unit up.
Therefore, the vertex of g(x) is the point (0−3,0+1)=(−3,1).
The points (2,2) and (−2,2) lie on the parent absolute value function f(x)=∣x∣.
Compare the function g(x) to g(x)=∣−1/b(x+h)+k|, and write the value of the constant b.b=2
Since ∣b∣=2, that is ∣b∣>1, the graph of g(x) will involve a horizontal stretch of the parent absolute value function by a factor 2.
Since b is negative, the graph of g(x) will involve a reflection of the parent absolute value function about the y-axis.
The transformations used to form g(x)=∣−1/2(x+3)+1∣ from the parent absolute value function can be used to determine the two points lying on g(x).
The x-coordinate of the points lying on f(x) will be reflected in the y-axis, horizontally stretched by a factor of 2, and shifted 3 units to the left when mapped to g(x).
The y-coordinate of the points lying on f(x) will be moved up 1 unit.
Therefore, the point (2,2) moves to (−2⋅2−3,∣2∣+1)=(−7,3).
The point (−2,2) moves to (−2⋅(−2)−3,∣2∣+1)=(1,3).
Plot the vertex (−3,1) and the points (−7,3) and (1,3), and then draw straight lines to sketch the graph of g(x)=∣−1/2(x+3)+1∣.
The vertex of g(x) is (−3,1).
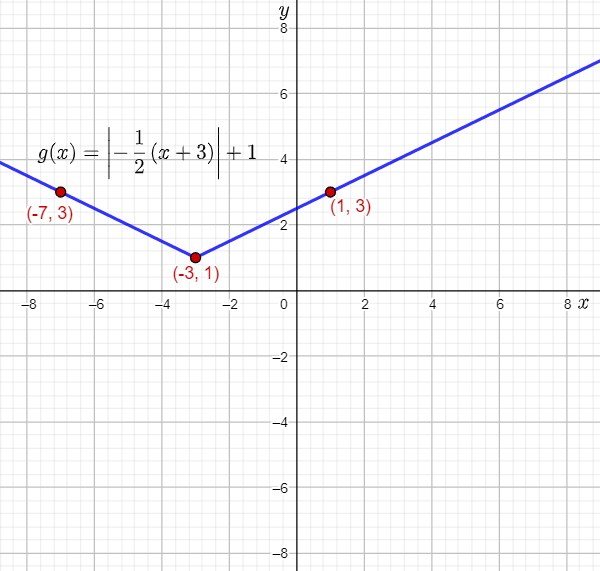
Two points lying on g(x) are (−7,3) and (1,3).
The required grap

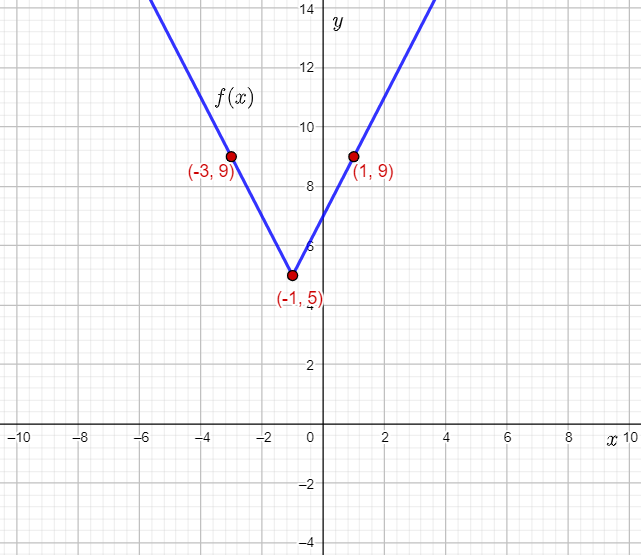
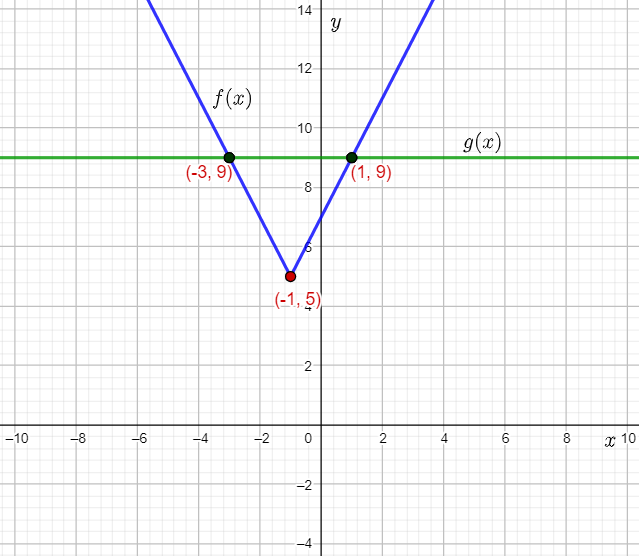
Page 67 Problem 11 Answer
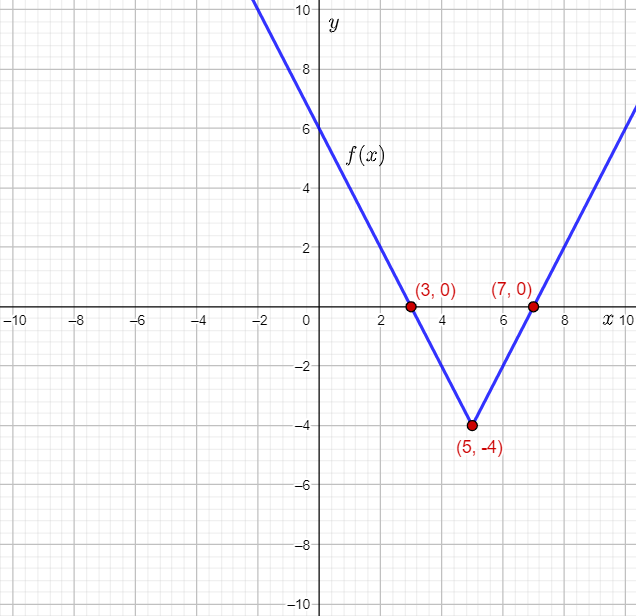
The given graph shows the graph of an absolute value function. The incomplete steps used to find the function are given.
The question requires to write the function in the form g(x)=a∣1/b(x−h)+k| for the given graph, when b=1.
To determine the function, let the given function be g(x)=a∣1/b(x−h)+k|, use the graph to find the vertex, and thus, the values of h,k.
Then, rewrite the function using the obtained values.
Next, find a point other than vertex lying on the graph, and substitute its coordinates in the function to find the value of a. Finally, use the value of a in the function to obtain the function in the required form.
Let the given function be g(x)=a∣1/b(x−h)+k|.
From the graph, it can be observed that the vertex of g(x) is at (1,6).
This means that the values of h and k are 1 and 6 respectively.
Substitute 1 for b, 1 for h, and 6 for k in g(x)=a∣1/b(x−h)+k|.
g(x)=a∣1/1(x−1)+6|
g(x)=a∣x−1∣+6………………(1)
From the graph, it can be observed that the point with the integer coordinates (0,3) lies on the graph.
Substitute 0 for x, and 3 for g(x) in equation (1), subtract 6 from both sides, and solve for a.
g(x)=a∣x−1∣+6
3=a∣0−1∣+6
3=a∣−1∣+6
−3=a(1)
−3=a
Substitute −3 for a in g(x)=a∣x−1∣+6.
g(x)=−3∣x−1∣+6
Thus, the required form of the absolute value function is g(x)=−3∣x−1∣+6.
The required form of the graphed function is g(x)=−3∣x−1∣+6.
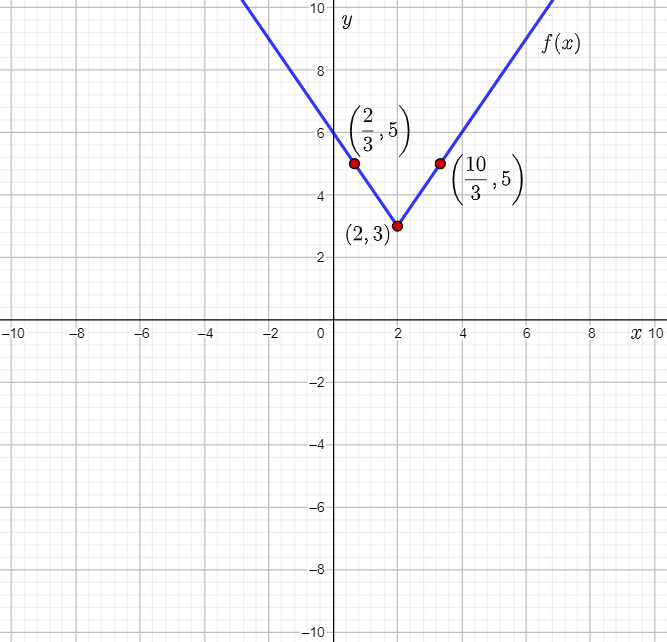
Page 67 Problem 12 Answer
The given function is g(x)=−1/5∣(x+6)∣+4.
The question requires to find the vertex and two points of the given function, and use them to graph g(x).
To graph the function, compare the given function to the parent absolute value function, and use the translations on its vertex to determine the vertex of g(x).
Then, take two points lying on the parent absolute value function, and determine the location where they will be mapped on g(x) using the transformations used to form g(x)
from f(x).
Finally, plot the points and vertex and graph the given function.
The vertex of the parent absolute value function f(x)=∣x∣ is (0,0).
The vertex of g(x) is the point where (0,0) will be mapped using translations.
It can be observed that g(x) involves a translation of f(x) by 6 units to the left and 4 units up.
Therefore, the vertex of g(x) is the point (0−6,0+4)=(−6,4).
The points (8,8) and (−8,8) lie on the parent absolute value function f(x)=∣x∣.
The transformations used to form g(x)=−1/5∣(x+6)∣+4 from the parent absolute value function can be used to determine the two points lying on g(x).
The coefficient of the absolute value in the given function g(x)=−1/5∣(x+6)∣+4 is −1/5, which is less than 1.
The x-coordinate of the points lying on f(x) will be shifted 6 units to the left when mapped to g(x).
The y-coordinate of the points lying on f(x) will be reflected about the x-axis by multiplying by −1, vertically compressed by the factor 1/5, and then shifted 4 units up when mapped to g(x).
Calculate the location where the point (8,8) will be mapped.
(8−6,−1/5⋅∣8∣+4)=(2,−1/5⋅8+4)
=(2,−8/5+4)
=(2,12/5)
Thus, (2,12/5) lies on the graph of g(x).
Calculate the location where the point (−8,8) will be mapped.
(−8−6,−1/5⋅∣8∣+4)=(−14,−1/5⋅8+4)
=(−14,−8/5+4)
=(−14,12/5)
Thus, (−14,12/5) lies on the graph of g(x).
Plot the vertex (−6,4) and the points (2,12/5) and (−14,12/5), and then draw straight lines to sketch the graph of g(x)=−1/5∣(x+6)∣+4.
The vertex of g(x) is (−6,4).
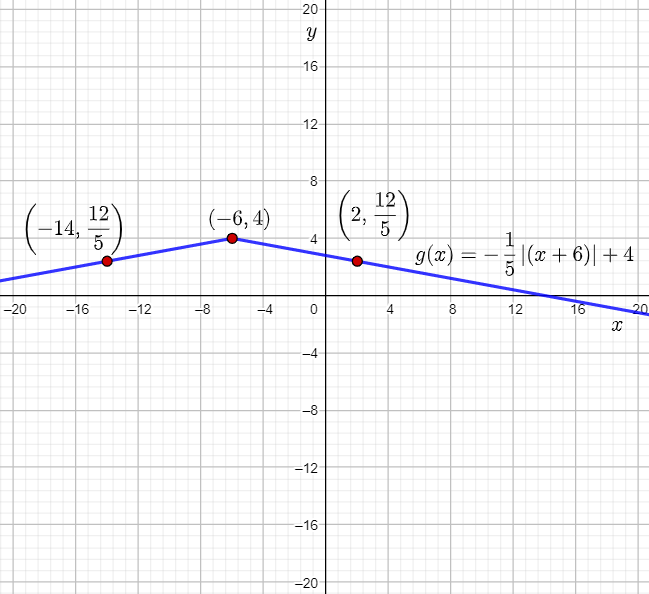
Two points lying on g(x) are (−14,12/5) and (2,12/5).
The required graph of g(x) is:

HMH Algebra 2 Chapter 2 Exercise 2.1 Solutions Guide
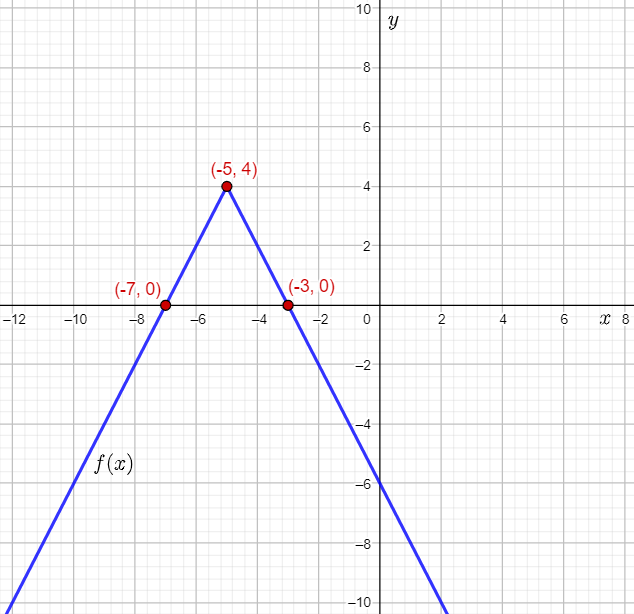
HMH Algebra 2 Volume 1 1st Edition Module 2 Chapter 2 Exercise 2.1 Absolute Value, Functions, Equations And Inequalities Page 68 Problem 13 Answer
The given graph shows the graph of an absolute value function.
The question requires to write the function graphed in the form g(x)=a∣1/b(x−h)+k|.
To determine the function, assume b=1, use the graph to find the vertex, and thus, the values of h,k. Then, rewrite the function using the obtained values.
Next, find a point other than vertex lying on the graph, and substitute its coordinates in the function to find the value of a.
Finally, use the value of a in the function to obtain the function in the required form.
Let b=1.
From the graph, it can be observed that the vertex of the graphed absolute value function is (−5,−1).
This means that the values of h and k are −5 and −1 respectively.
Substitute 1 for b, −5 for h, and −1 for k in the equation g(x)=a∣1/b(x−h)+k|.
g(x)=a∣1/1(x−(−5))+(−1)|
g(x)=a∣x+5∣−1………………(1)
From the graph, it can be observed that the point (−8,5) lies on the graph.
Substitute −8 for x, and then 5 for g(−8) in equation (1), add 1
on both sides, and then divide both sides by 2.
g(−8)=a∣−8+5∣−1
5=a∣−3∣−1
6=a(3)
2=a
Substitute 2 for a in g(x)=a∣x+5∣−1.
g(x)=2∣x+5∣−1
Thus, the required form is g(x)=2∣x+5∣−1.
The required form of the graphed function is g(x)=2∣x+5∣−1.
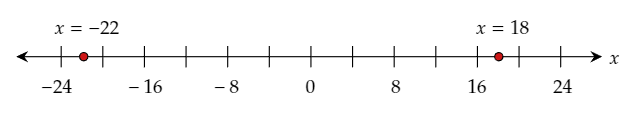
Page 69 Problem 14 Answer
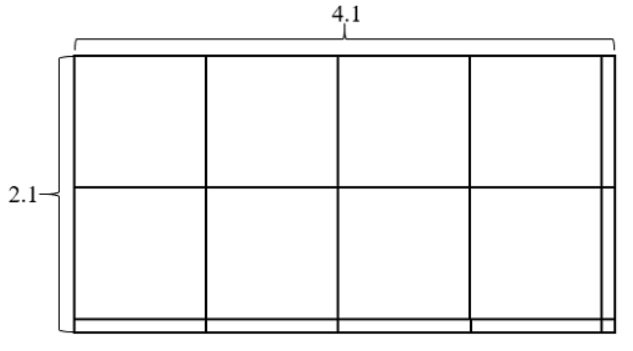
It is given that a beam of light that originates from a point 10 ft above the floor, reflects off a mirror 15 ft away from the wall containing the source of the light.
Also, it is given that after reflecting, it hits the opposite wall which is 8.5 ft away from the mirror.
The question requires to determine the height from the floor where the light hits the other wall after reflecting off the mirror.
To determine the height, draw the diagram representing the given situation, label the diagram, and let the base of the first wall be the origin.
Then, observe that the path of the ball is the graph of an absolute value function, and write a general function for the path.
Assume b=1, use the graph to find the vertex, and thus, the values of h,k.
Then, rewrite the function using the obtained values. Next, find a point other than vertex lying on the graph, and substitute its coordinates in the function to find the value of a.
Then, use the value of a in the function to obtain the function representing the path of the light.
Finally, use the distance of the second wall from the origin in the function, simplify to find the required height, and justify the answer.
Label the diagram representing the given sit
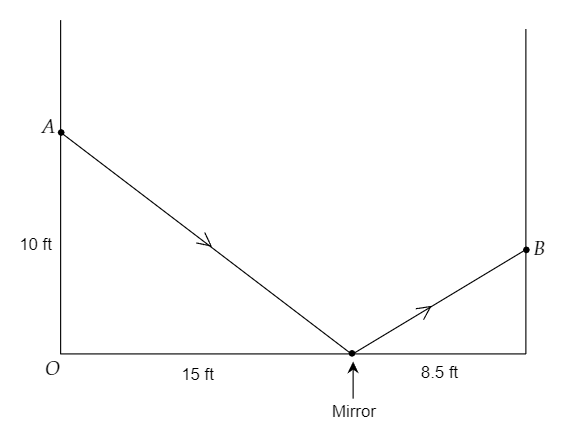
Here, A and B represent the points at which the light originates from and hits the other wall respectively.
The model of the path of the light will be of the form g(x)=a∣1/b(x−h)+k|.
Let the base of the first wall be the origin (0,0).
Therefore, the vertex of g(x) is the point at which the mirror is placed, that is (15,0).
Assume that b=1.
The vertex of the path of the ball is (15,0).
This means that the values of h and k are 15 and 0 respectively.
Substitute 1 for b, 15 for h, and 0 for k in the equation g(x)=a∣1/b(x−h)+k|.
g(x)=a∣/1/1(x−15)+0|
g(x)=a∣x−15∣………………(1)
Another point on g(x) is the point from which the light originates from, that is (0,10).
Substitute 0 for x, and then 10 for g(0) in equation (1), and then divide both sides by 15.
g(0)=a∣0−15∣
10=a∣−15∣
10=a(15)2/3=a
Substitute 2/3 for a in g(x)=a∣x−15∣.
g(x)=2/3∣x−15∣
Thus, the function representing the path of the light is g(x)=2/3∣x−15∣.
The value of g(x) at x=15+8.5, that is 23.5 ft will give the height of the light beam on the opposite wall.
Substitute 23.5 for x in g(x)=2/3∣x−15∣, and simplify the expression.
g(23.5)=2/3∣23.5−15∣
=2/3∣8.5∣
=2/3(8.5)
=17/3
≈5.67
Therefore, the value of g(23.5) is about 5.67.
Thus, the beam hits the opposite wall at a height of about 5.67 ft.
The answer of 5.67 ft makes sense because the function is symmetric with respect to the vertical line passing through the vertex (15,0), that is x=15.
The distance from this vertical line to the second wall is a little more than half the distance from the line to the first wall from where the beam originates.
Since the beam originates at a height of 10 off the floor, the beam, after reflection, should hit the second wall at a height of a little over 1/2(10)=5 ft.
Thus, the answer 5.67 ft is justified.
The light beam hits the other wall at a height of about 5.67 ft.
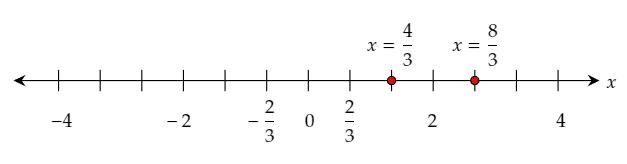
HMH Algebra 2 Volume 1 1st Edition Module 2 Chapter 2 Exercise 2.1 Absolute Value, Functions, Equations And Inequalities Page 70 Problem 15 Answer
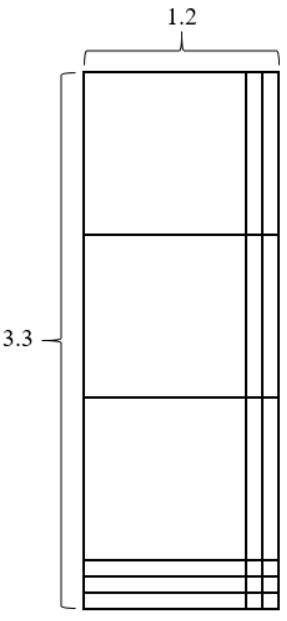
It is given that a student bounces a ball 3 m away from himself from a height of 1.4 m, to pass it to the other student standing.
The question requires to determine the position where the second student must stand to catch the ball at the height 1.2 m.
To determine the position, draw the diagram representing the given situation, label the diagram, and assume the point at which the first student stands as the origin.
Then, observe that the path of the ball is the graph of an absolute value function, and write a general function for the path.
Assume b=1, use the graph to find the vertex, and thus, the values of h,k. Then, rewrite the function using the obtained values.
Next, find a point other than vertex lying on the graph, and substitute its coordinates in the function to find the value of a.
Then, use the value of a in the function to obtain the function representing the path of the ball.
Finally, use the height at which the second student has to catch the ball in the function, and solve for x to find the required position.
Draw the diagram representing the given situation.
Here, A and B represent the points at which first and second student catch the ball respectively.
Point C represents the point where the ball bounces.
The graph of the path of the ball can be represented by the function g(x)=a∣1/b(x−h)+k|.
Let the point O where the first student stands be the origin (0,0).
Therefore, the vertex of the graph of the function is (3,0).
Assume that b=1.
The vertex of the path of the ball is (3,0).
This means that the values of h and k are 3 and 0 respectively.
Substitute 1 for b, 3 for h, and 0 for k in the equation g(x)=a∣1/b(x−h)+k|.
g(x)=a∣1/1(x−3)+0|
g(x)=a∣x−3∣………………(1)
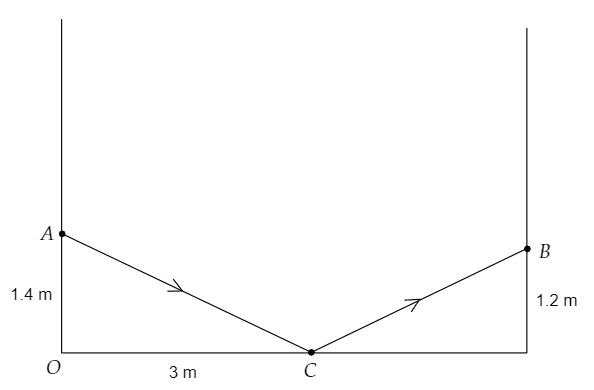
From the graph, it can be observed that the point (0,1.4) represents the point where the first student catches the ball.
Substitute 0 for x, and then 1.4 for g(0) in equation (1), and then divide both sides by 3.
g(0)=a∣0−3∣
1.4=a∣−3∣
1.4=a(3)
1.4/3=a
Substitute 1.4/3 for a in g(x)=a∣x−3∣.
g(x)=1.4/3∣x−3∣
Thus, the function representing the path of the ball is g(x)=1.4/3∣x−3∣.
The second student catches the ball at a height of 1.2 m.
Substitute 1.2 for g(x) in g(x)=1.4/3∣x−3∣, and multiply both sides by 3/1.4.
1.2=1.4/3∣x−3∣1.2(3/1.4)=1.4/3(3/1.4)∣x−3∣
6(3/7)=∣x−3∣18/7=∣x−3∣………………(2)
Form two equations by rewriting the absolute value in equation (2).
18/7=x−3
18/7=−(x−3)
Simplify the right-hand side of 18/7=−(x−3), and solve for x.
18/7=−x+3
x=3−18/7
x=3/7
x≈0.43
This value of x implies that the student must stand 0.43 m to the right of the origin.
However, the ball bounces 3 m away from the origin, and between the two students.
Thus, the value of x cannot be 0.43.
Add 3 on both sides of the other equation 18/7=x−3.
18/7+3=x−3+3
39/7=x
5.57≈x
This value of x implies that the student must stand 5.57 m to the right of the origin.
Thus, the second student must stand about 5.57 m away from the first student to catch the ball at a height of 1.2 m.
The answer of 5.57 m makes sense because the function is symmetric with respect to the vertical line passing through the vertex (3,0), that is x=3.
The height at which the second student catches the ball is about 1.2
1.4≈0.857 times the height at which the first student catches the ball.
Therefore, the beam bounces at a distance of 3 m away from the first wall, it should hit the second wall when the distance of the vertical line from the second wall is about 0.857(3)=2.57 m.
This means that the second student should stand at about 3+2.57=5.57 m from the first student.
Thus, the answer 5.57 m is justified.
The second student must stand about 5.57 m away from the first student to catch the ball at a height of 1.2 m.
Page 70 Problem 16 Answer
The parameters in the general form g(x)=a∣1/b(x−h)+k| of the absolute value function are a,b,h,k.
The parameters h and k represent the x-coordinate and y-coordinate of the vertex of the function.
Parameter b determines the factor by which the x-coordinates of points lying on the parent absolute value function are stretched, compressed, and/or reflected to form the x-coordinates of the points lying on g(x).
The parameter a determines the factor by which the y-coordinates of points lying on the parent absolute value function are stretched, compressed, and/or reflected to form the y-coordinates of the points lying on g(x).
In the general form g(x)=a∣1/b(x−h)+k| of the absolute value function, the parameters h and k represent the x-coordinate and y-coordinate of the vertex of the function, the parameter b determines the factor by which the x-coordinates of points lying on the parent absolute value function are stretched, compressed, and/or reflected to form the x-coordinates of the points lying on g(x), and finally, the parameter a determines the factor by which the y-coordinates of points lying on the parent absolute value function are stretched, compressed, and/or reflected to form the y-coordinates of the points lying on g(x).
How To Solve Absolute Value Functions Exercise 2.1 HMH Algebra 2
HMH Algebra 2 Volume 1 1st Edition Module 2 Chapter 2 Exercise 2.1 Absolute Value, Functions, Equations And Inequalities Page 70 Problem 17 Answer
The vertex of f(x)=∣x∣ is the origin (0,0).When the function f(x)=∣x∣ is vertically stretched or compressed, the y-coordinates of the points lying on it are multiplied by a factor.
When the function is horizontally stretched or compressed, the x-coordinates of the points lying on it are multiplied by a factor.
Since the product of 0 and the factor is always 0, the coordinates of the vertex remain (0,0) after multiplication by the factor.
Therefore, the vertex remains same when the function is stretched or compressed.
When the function f(x)=∣x∣ is vertically translated up or down, a constant is added or subtracted from the y-coordinates of the points lying on it.
When the function is horizontally translated to the left or right, a constant is added or subtracted from the x-coordinates of the points lying on it.
When a constant is added or subtracted from the coordinates of the vertex (0,0), the resulting vertex is a point other than (0,0).
Therefore, the vertex does not remain the same when the function is translated.
The vertex remains same when the function is stretched or compressed because the coordinates of the vertex remain (0,0) after multiplication by any factor.
The vertex does not remain the same when the function is translated because the vertex is not (0,0) after a constant is added to or subtracted from either of the coordinates.
Page 70 Problem 18 Answer
Every absolute value function is of the form g(x)=a∣1/b(x−h)+k|.
The graph of an absolute value function is formed using two inclined straight lines with the vertex as the common initial point.
The graph of an absolute value function is symmetric about the vertical line passing through the vertex.The domain of graph of an absolute value function is all real numbers.
The shape of the graph of an absolute value function is similar to the letter V or an inverted V, formed using two inclined straight lines with the vertex as the common initial point.
The graph of an absolute value function is symmetric about the straight vertical line that passes through its vertex.
The domain of the graph of every absolute value function is all real numbers.
Page 71 Exercise 1 Answer
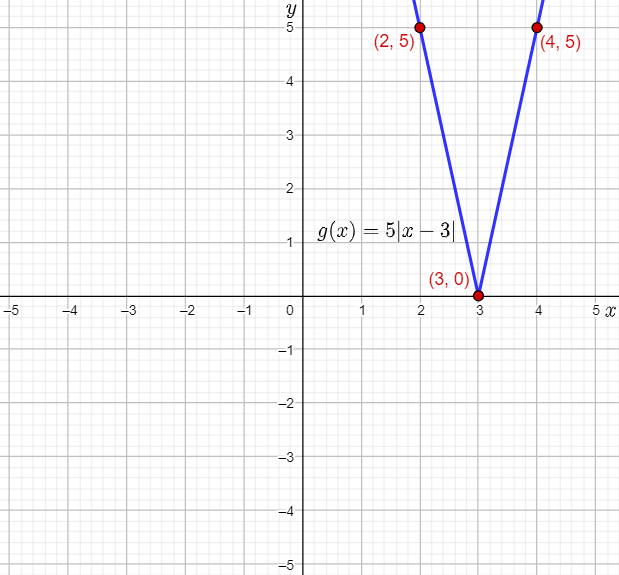
The given function is g(x)=5∣x−3∣.
The question requires to predict how the graph of the given function will look, and verify this using a graphing calculator.
Then, it is required to sketch the graph of the given function.
To answer the question, compare the function to g(x)=a∣1/b(x−h)+k|to find the values of the constants, and then predict the shape and position of the graph in comparison to the graph of the parent absolute value function.
Next, graph the function on a graphing calculator and verify the prediction.

To sketch the graph, compare the given function to the parent absolute value function, and use the translations on its vertex to determine the vertex of g(x).
Then, take two points lying on the parent absolute value function, and determine the location where they will be mapped on g(x) using the transformations used to form g(x) from f(x).
Finally, plot the points and vertex and graph the given function.
Rewrite the given function in the form g(x)=a∣1/b(x−h)+k|.
g(x)=5∣1/1(x−3)+0|
Compare the function g(x) to g(x)=a∣1/b(x−h)+k|, and write the values of the constants.
a=5
b=1
h=3
k=0
The value of a is positive. Therefore, the graph of g(x) will open upwards.
Since a=5, the graph of g(x) will be a vertically stretch of the parent absolute value function by a factor 5.
Since h=3, the graph of g(x) will be a horizontal translation of the parent absolute value function by 3 units to the right.
Since k=0, the graph of g(x) will not be involve a vertical translation of the parent absolute value function.
Therefore, it is predicted that the graph of g(x) will open upwards.
It will be a vertically stretch of the parent absolute value function by a factor 5, will involve a horizontal translation of the parent absolute value function by 3 units to the right, and will not be involve a vertical translation of the parent absolute value function.
On the graphing calculator, press the Y= key, and assign 5∣x−3∣ to Y1.
Next, set the viewing rectangle to [−5,5] by [−5,5], and press the GRAPH key to obtain the required graph of the function.
From the graph, it can be observed that the prediction is verified.
The vertex of the parent absolute value function f(x)=∣x∣ is (0,0).
The vertex of g(x) is the point where (0,0) will be mapped using translations.
Therefore, the vertex of g(x) is the point (0+3,0)=(3,0).
The points (1,1) and (−1,1) lie on the parent absolute value function f(x)=∣x∣.
The transformations used to form g(x)=5∣x−3∣ from the parent absolute value function can be used to determine the two points lying on g(x).
The x-coordinate of the points lying on f(x) will be shifted 3 units to the right when mapped to g(x).
The y-coordinate of the points lying on f(x) will be vertically stretched by the factor 5 when mapped to g(x).
Calculate the location where the point (1,1) will be mapped.
(1+3,5⋅∣1∣)=(1+3,5⋅1)
=(4,5)
Thus, (4,5) lies on the graph of g(x).
Calculate the location where the point (−1,1) will be mapped.
(−1+3,5⋅∣1∣)=(−1+3,5⋅1)
=(2,5)
Thus, (2,5) lies on the graph of g(x).
Plot the vertex (3,0) and the points (4,5) and (2,5), and then draw straight lines to sketch the graph of g(x)=5∣x−3∣.
It is predicted that the graph of g(x) will open upwards, will be a vertically stretch of the parent absolute value function by a factor of 5, will involve a horizontal translation of the parent absolute value function by 3 units to the right, and will not be involve a vertical translation of the parent absolute value function.
The prediction is verified using the following graph made using a graphing calculator:
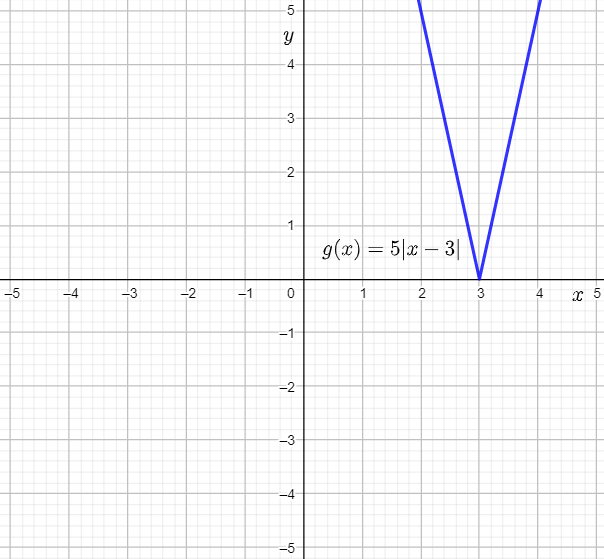
The required sketched graph of g(x) is:

HMH Algebra 2 Volume 1 1st Edition Module 2 Chapter 2 Exercise 2.1 Absolute Value, Functions, Equations And Inequalities Page 71 Exercise 2 Answer
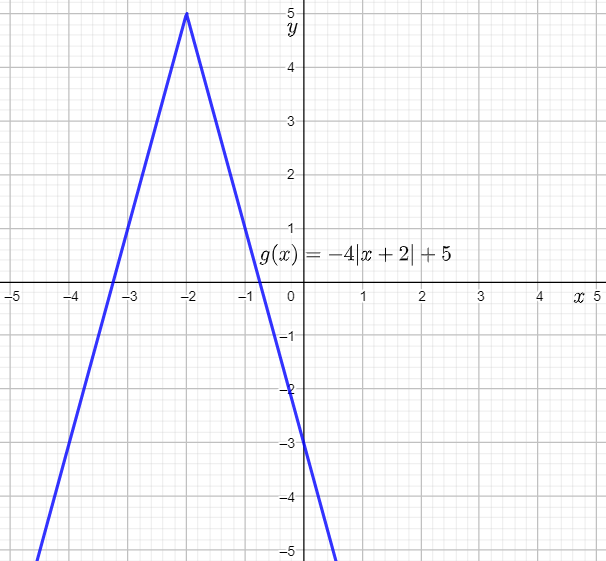
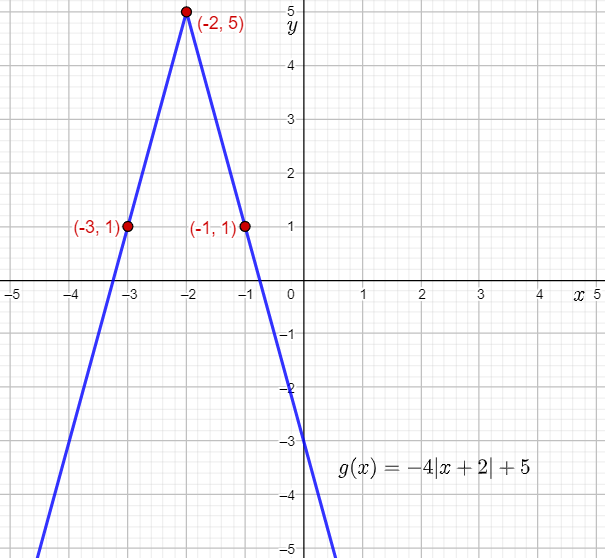
The given function is g(x)=−4∣x+2∣+5.
The question requires to predict how the graph of the given function will look, and verify this using a graphing calculator.
Then, it is required to sketch the graph of the given function.
To answer the question, compare the function to g(x)=a∣1/b(x−h)+k| to find the values of the constants, and then predict the shape and position of the graph in comparison to the graph of the parent absolute value function.
Next, graph the function on a graphing calculator and verify the prediction.
To sketch the graph, compare the given function to the parent absolute value function, and use the translations on its vertex to determine the vertex of g(x).
Then, take two points lying on the parent absolute value function, and determine the location where they will be mapped on g(x) using the transformations used to form g(x)
from f(x).
Finally, plot the points and vertex and graph the given function.
Rewrite the given function in the form g(x)=a∣1/b(x−h)+k|.
g(x)=−4∣1/1(x+2)+5|
Compare the function g(x) to g(x)=a∣1/b(x−h)+k|, and write the values of the constants.
a=−4
b=1
h=−2
k=5
The value of a is negative. Therefore, the graph of g(x) will open downwards.
Since a=−4, the graph of g(x) will be a vertically stretch of the parent absolute value function by a factor 4, and a reflection about the x-axis.
Since h=−2, the graph of g(x) will be a horizontal translation of the parent absolute value function by 2 units to the left.
Since k=5, the graph of g(x) will involve a vertical translation of the parent absolute value function by 5 units up.
Therefore, it is predicted that the graph of g(x) will open downwards.
It will be a reflection of the parent absolute value function about the x-axis, a vertically stretch by a factor 4, a horizontal translation by 2 units to the left, and finally, a vertical translation by 5 units up.
On the graphing calculator, press the Y= key, and assign −4∣x+2∣+5 to Y1.
Next, set the viewing rectangle to [−5,5] by [−5,5], and press the GRAPH key to obtain the required graph of the function.
From the graph, it can be observed that the prediction is verified.
The vertex of the parent absolute value function f(x)=∣x∣ is (0,0).
The vertex of g(x) is the point where (0,0) will be mapped using translations.
Therefore, the vertex of g(x) is the point (0−2,0+5)=(−2,5).
The points (1,1) and (−1,1) lie on the parent absolute value function f(x)=∣x∣.
The transformations used to form g(x)=−4∣x+2∣+5 from the parent absolute value function can be used to determine the two points lying on g(x).
The x-coordinate of the points lying on f(x) will be shifted 2 units to the left when mapped to g(x).
The y-coordinate of the points lying on f(x) will be reflected about the x-axis by multiplying by −1, vertically stretched by the factor 4, and translated 5 units up when mapped to g(x).
Calculate the location where the point (1,1) will be mapped.
(1−2,−4⋅∣1∣+5)=(1−2,−4⋅1+5)
=(−1,−4+5)
=(−1,1)
Thus, (−1,1) lies on the graph of g(x).
Calculate the location where the point (−1,1) will be mapped.
(−1−2,−4⋅∣1∣+5)=(−1−2,−4⋅1+5)
=(−3,−4+5)
=(−3,1)
Thus, (−3,1) lies on the graph of g(x).
Plot the vertex (−2,5) and the points (−1,1) and (−3,1), and then draw straight lines to sketch the graph of g(x)=−4∣x+2∣+5.

It is predicted that the graph of g(x) will open downwards, will be a reflection of the parent absolute value function about the x-axis, a vertical stretch by a factor 4, a horizontal translation by 2 units to the left, and finally, a vertical translation by 5 units up.
The prediction is verified using the following graph made using a graphing calculator:

The required sketched graph of g(x) is:
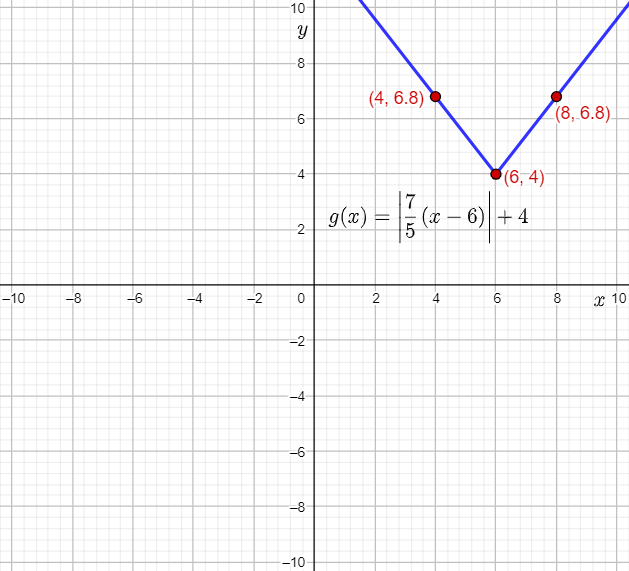
Page 71 Exercise 3 Answer
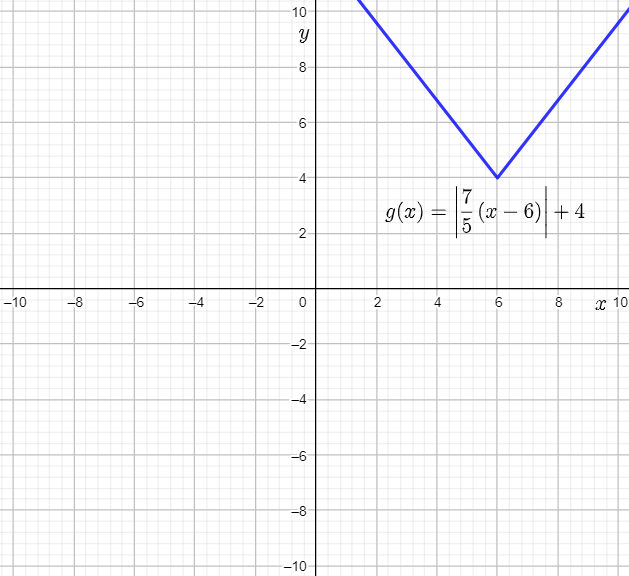
The given function is g(x)=∣7/5(x−6)+4|.
The question requires to predict how the graph of the given function will look, and verify this using a graphing calculator.
Then, it is required to sketch the graph of the given function.
To answer the question, rewrite and compare the function to g(x)=a∣(x−h)∣+k to find the values of the constants, and then predict the shape and position of the graph in comparison to the graph of the parent absolute value function.
Next, graph the function on a graphing calculator and verify the prediction.
To sketch the graph, compare the given function to the parent absolute value function, and use the translations on its vertex to determine the vertex of g(x).
Then, take two points lying on the parent absolute value function, and determine the location where they will be mapped on g(x) using the transformations used to form g(x)
from f(x).
Finally, plot the points and vertex and graph the given function.
Rewrite the given function in the form g(x)=a∣(x−h)∣+k.
g(x)=7/5∣x−6∣+4
Compare the function g(x) to g(x)=a∣(x−h)∣+k, and write the values of the constants.
a=7/5
h=6
k=4
The value of a is positive. Therefore, the graph of g(x) will open upwards.
Since a=7/5, the graph of g(x) will be a vertically stretch of the parent absolute value function by a factor 7/5.
Since h=6, the graph of g(x) will be a horizontal translation of the parent absolute value function by 6 units to the right.
Since k=4, the graph of g(x) will involve a vertical translation of the parent absolute value function by 4 units up.
Therefore, it is predicted that the graph of g(x) will open upwards. It will be a vertically stretch of the parent absolute value function by a factor 7/5, a horizontal translation by 6 units to the right, and finally, a vertical translation by 4 units up.
On the graphing calculator, press the Y= key, and assign |7/5(x−6)+4| to Y1.
Next, set the viewing rectangle to [−10,10] by [−10,10], and press the GRAPH key to obtain the required graph of the function.
From the graph, it can be observed that the prediction is verified.
The vertex of the parent absolute value function f(x)=∣x∣ is (0,0).
The vertex of g(x) is the point where (0,0) will be mapped using translations.
Therefore, the vertex of g(x) is the point (0+6,0+4)=(6,4).
The points (2,2) and (−2,2) lie on the parent absolute value function f(x)=∣x∣.
The transformations used to form g(x)=7/5∣x−6∣+4 from the parent absolute value function can be used to determine the two points lying on g(x).
The x-coordinate of the points lying on f(x) will be shifted 6 units to the right when mapped to g(x).
The y-coordinate of the points lying on f(x) will be vertically stretched by the factor 7/5, and translated 4 units up when mapped to g(x).
Calculate the location where the point (2,2) will be mapped.
(2+6,7/5⋅∣2∣+4)=(2+6,7/5⋅2+4)
=(8,14/5+4)
=(8,34/5)
=(8,6.8)
Thus, (8,6.8) lies on the graph of g(x).
Calculate the location where the point (−2,2) will be mapped.
(−2+6,7/5⋅∣2∣+4)=(−2+6,7/5⋅2+4)
=(4,14/5+4)
=(4,34/5)
=(4,6.8)
Thus, (4,6.8) lies on the graph of g(x).
Plot the vertex (6,4) and the points (4,6.8) and (8,6.8), and then draw straight lines to sketch the graph of g(x)=∣7/5(x−6)+4|.
It is predicted that the graph of g(x) will open upwards, will be vertically stretch of the parent absolute value function by a factor 7/5, a horizontal translation by 6 units to the right, and finally, a vertical translation by 4 units up.
The prediction is verified using the following graph made using a graphing calculator:

The required sketched graph of g(x) is:

Solutions For Chapter 2 Exercise 2.1 Absolute Value And Inequalities HMH
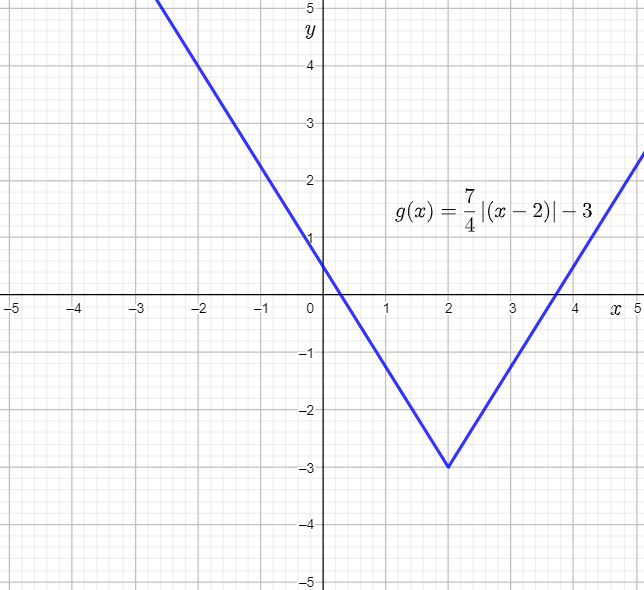
HMH Algebra 2 Volume 1 1st Edition Module 2 Chapter 2 Exercise 2.1 Absolute Value, Functions, Equations And Inequalities Page 71 Exercise 4 Answer
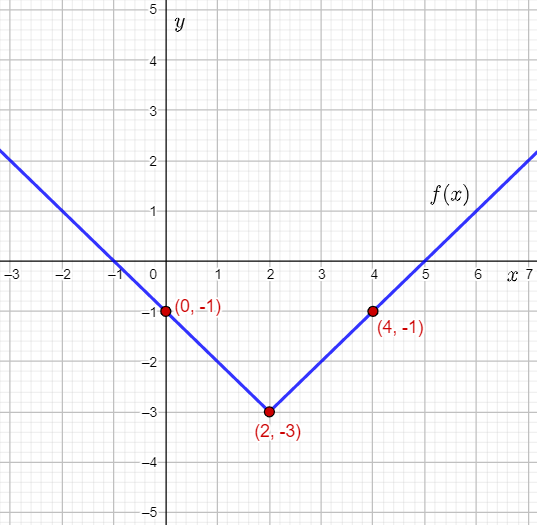
The given function is g(x)=7/4∣(x−2)∣−3.
The question requires to predict how the graph of the given function will look, and verify this using a graphing calculator.
Then, it is required to sketch the graph of the given function.
To answer the question, compare the function to g(x)=a∣(x−h)∣−k to find the values of the constants, and then predict the shape and position of the graph in comparison to the graph of the parent absolute value function.
Next, graph the function on a graphing calculator and verify the prediction.
To sketch the graph, compare the given function to the parent absolute value function, and use the translations on its vertex to determine the vertex of g(x).
Then, take two points lying on the parent absolute value function, and determine the location where they will be mapped on g(x) using the transformations used to form g(x)
from f(x).
Finally, plot the points and vertex and graph the given function.
Compare the function g(x) to g(x)=a∣(x−h)∣−k, and write the values of the constants.
a=7/4
h=2
k=3
The value of a is positive. Therefore, the graph of g(x) will open upwards.
Since a=7/4, the graph of g(x) will be a vertically stretch of the parent absolute value function by a factor 7/4.
Since h=2, the graph of g(x) will be a horizontal translation of the parent absolute value function by 2 units to the right.
Since k=3, the graph of g(x) will involve a vertical translation of the parent absolute value function by 3 units down.
Therefore, it is predicted that the graph of g(x) will open upwards. It will be a vertical stretch of the parent absolute value function by a factor 7/4, a horizontal translation by 2 units to the right, and finally, a vertical translation by 3 units down.
On the graphing calculator, press the Y= key, and assign 7/4∣(x−2)∣−3 to Y1.
Next, set the viewing rectangle to [−5,5] by [−5,5], and press the GRAPH key to obtain the required graph of the function.
From the graph, it can be observed that the prediction is verified.
The vertex of the parent absolute value function f(x)=∣x∣ is (0,0).
The vertex of g(x) is the point where (0,0) will be mapped using translations.
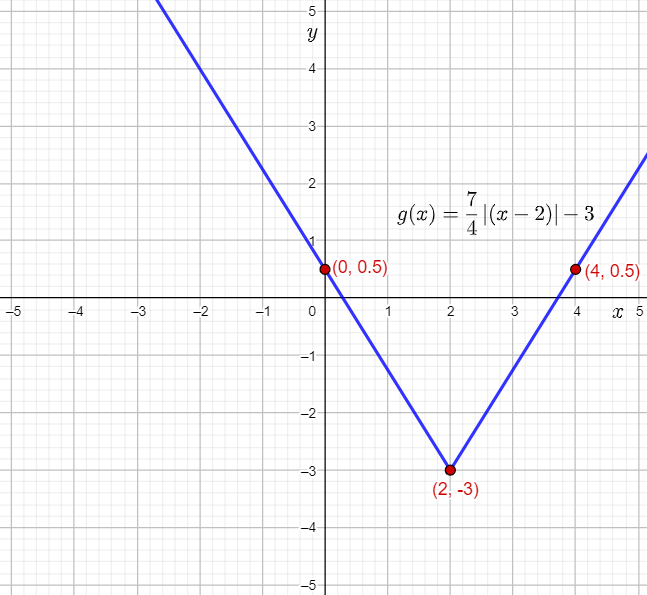
Therefore, the vertex of g(x) is the point (0+2,0−3)=(2,−3).
The points (2,2) and (−2,2) lie on the parent absolute value function f(x)=∣x∣.
The transformations used to form g(x)=7/4∣(x−2)∣−3 from the parent absolute value function can be used to determine the two points lying on g(x).
The x-coordinate of the points lying on f(x) will be shifted 2 units to the right when mapped to g(x).
The y-coordinate of the points lying on f(x) will be vertically stretched by the factor 7/4, and translated 3 units down when mapped to g(x).
Calculate the location where the point (2,2) will be mapped.
(2+2,7/4⋅∣2∣−3)=(2+2,7/4⋅2−3)
=(4,7/2−3)
=(4,1/2)
=(4,0.5)
Thus, (4,0.5) lies on the graph of g(x).
Calculate the location where the point (−2,2) will be mapped.
(−2+2,7/4⋅∣2∣−3)=(−2+2,7/4⋅2−3)
=(0,7/2−3)
=(0,1/2)
=(0,0.5)
Thus, (0,0.5) lies on the graph of g(x).
Plot the vertex (2,−3) and the points (4,0.5) and (0,0.5), and then draw straight lines to sketch the graph of g(x)=7/4∣(x−2)∣−3.

It is predicted that the graph of g(x) will open upwards, will be vertical stretch of the parent absolute value function by a factor 7/4, a horizontal translation by 2 units to the right, and finally, a vertical translation by 3 units down.
The prediction is verified using the following graph made using a graphing calculator:

The required sketched graph of g(x) is:
Page 72 Exercise 5 Answer
The given function is g(x)=∣x∣.
The question requires to graph the given function, and determine its domain and range.
To graph the function, use the piecewise definition of the absolute value function g(x)=∣x∣ to form an input-output table.
Then, use the input-output table to write the coordinates of points lying on the graph of g(x)=∣x∣, and connect the points to sketch the graph of the function.
Finally, use the graph to determine the domain and range of the function.
The absolute value function g(x)=∣x∣ can be defined as the piecewise function:g(x)={x x≥0−x x<0
Substitute −8 for x in the absolute value function g(x)=∣x∣, and simplify using the piecewise definition of the absolute value function.
g(−8)=∣−8∣
=−(−8)
=8
Therefore, when the input is −8, the output is 8.
Substitute −4 for x in the absolute value function g(x)=∣x∣, and simplify using the piecewise definition of the absolute value function.
g(−4)=∣−4∣
=−(−4)
=4
Therefore, when the input is −4, the output is 4.
Substitute 0 for x in the absolute value function g(x)=∣x∣, and simplify using the piecewise definition of the absolute value function.
g(0)=∣0∣
=0
Therefore, when the input is 0, the output is 0.
Substitute 4 for x in the absolute value function g(x)=∣x∣, and simplify using the piecewise definition of the absolute value function.
g(4)=∣4∣
=4
Therefore, when the input is 4, the output is 4.
Substitute 8 for x in the absolute value function g(x)=∣x∣, and simplify using the piecewise definition of the absolute value function.
g(8)=∣8∣
=8
Therefore, when the input is 8, the output is 8.
Construct an input-output table using the calculated inputs and outputs.
The points lying on the graph of g(x)=∣x∣ are of the form (x,g(x)).
From the input-output table, it can be determined that the points (−8,8),(−4,4),(0,0),(4,4),(8,8) lie on the graph of g(x)=∣x∣.
Plot the points, join them, and draw straight lines to form the graph of the function g(x)=∣x∣.
From the graph, it can be observed that the graph of the function g(x)=∣x∣ stretches infinitely towards the left and right.
Therefore, the given absolute value function is defined for all values of x.
Hence, the domain of g(x)=∣x∣ is (−∞,∞).
Also, it can be observed that the points lying on the graph of the function g(x)=∣x∣ lie either on, or above the x-axis.
Therefore, the values of the outputs g(x) can be either 0, or greater than 0.
Thus, the range of g(x)=∣x∣ is [0,∞).
The required graph is:

The domain of g(x)=∣x∣ is (−∞,∞).
The range of g(x)=∣x∣ is [0,∞).
Page 72 Exercise 6 Answer
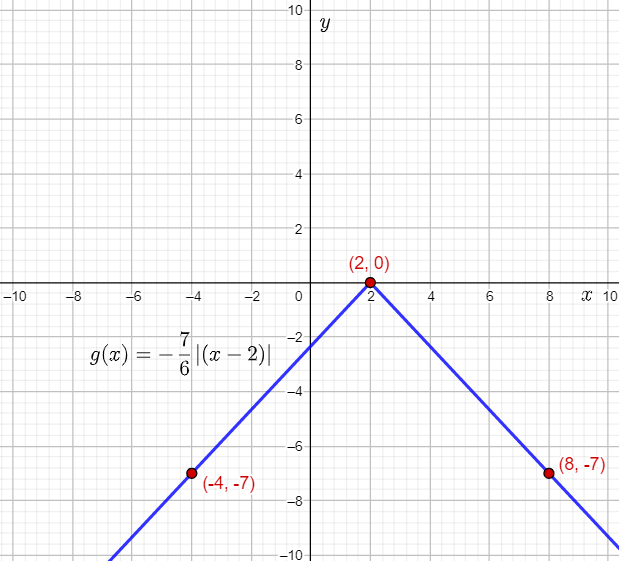
The given function is g(x)=−7/6∣(x−2)∣.
The question requires to predict how the graph of the given function will look, and verify this using a graphing calculator.
Then, it is required to sketch the graph of the given function.
To sketch the graph, write the translations used to form the given function from the parent absolute value function f(x)=∣x∣, and use them on the vertex to determine the vertex of g(x).
Next, write the coefficient of the absolute value in the given function to find the factor by which the parent absolute function will be vertically stretched.
Then, take two points lying on the parent absolute value function, and determine the location where they will be mapped on g(x)
using the transformations used to form g(x) from f(x). Next, plot the points and vertex and graph the given function.
Finally, use the drawn graph to find and write the domain and range of the function.
The vertex of the parent absolute value function f(x)=∣x∣ is (0,0).
The vertex of g(x) is the point where (0,0) will be mapped using translations.
It can be observed that g(x) involves a translation of f(x) by 2 units to the right.
Therefore, the vertex of g(x) is the point (0+2,0)=(2,0).
Compare the function g(x) to g(x)=−a∣(x−h)∣, and write the value of the constant a.a=7/6
Since a=7/6, that is ∣a∣>1, the graph of g(x) will involve a vertical stretch of the parent absolute value function by a factor 7/6.
Since the coefficient of the absolute value ∣(x−2)∣ in the given function is −7/6, that is negative, the graph of g(x) will involve reflection of the parent absolute value function about the x-axis.
The points (6,6) and (−6,6) lie on the parent absolute value function f(x)=∣x∣.
The transformations used to form g(x)=−7/6∣(x−2)∣ from the parent absolute value function can be used to determine the two points lying on g(x).
The x-coordinate of the points lying on f(x) will be shifted 2 units to the right when mapped to g(x).
The y-coordinate of the points lying on f(x) will be reflected about the x-axis, and then vertically stretched by the factor 7/6.
Calculate the location where the point (6,6) will be mapped.
(6+2,−7/6⋅∣6∣)=(6+2,−7/6⋅6)=(8,−7)
Calculate the location where the point (−6,6) will be mapped.
(−6+2,−7/6⋅∣6∣)=(−6+2,−7/6⋅6)
=(−4,−7)
Therefore, the two points (−4,−7) and (8,−7) lie on the graph of g(x).
Plot the vertex (2,0) and the points (−4,−7) and (8,−7), and then draw straight lines to sketch the graph of g(x)=−7/6∣(x−2)∣.

From the graph, it can be observed that the graph of the function g(x)=−7/6∣(x−2)∣ stretches infinitely towards the left and right. Therefore, the given absolute value function is defined for all values of x.
Hence, the domain of g(x)=−7/6∣(x−2)∣ is (−∞,∞).
Also, it can be observed that the y-coordinates of the points lying on the graph of the function g(x)=−7/6∣(x−2)∣ are either 0, or less than 0.
Thus, the range of g(x)=−7/6∣(x−2)∣ is (−∞,0].
The required graph is:
The domain of g(x) is (−∞,∞).
The range of g(x) is (−∞,0].
HMH Algebra 2 Volume 1 Exercise 2.1 Walkthrough
HMH Algebra 2 Volume 1 1st Edition Module 2 Chapter 2 Exercise 2.1 Absolute Value, Functions, Equations And Inequalities Page 71 Exercise 7 Answer
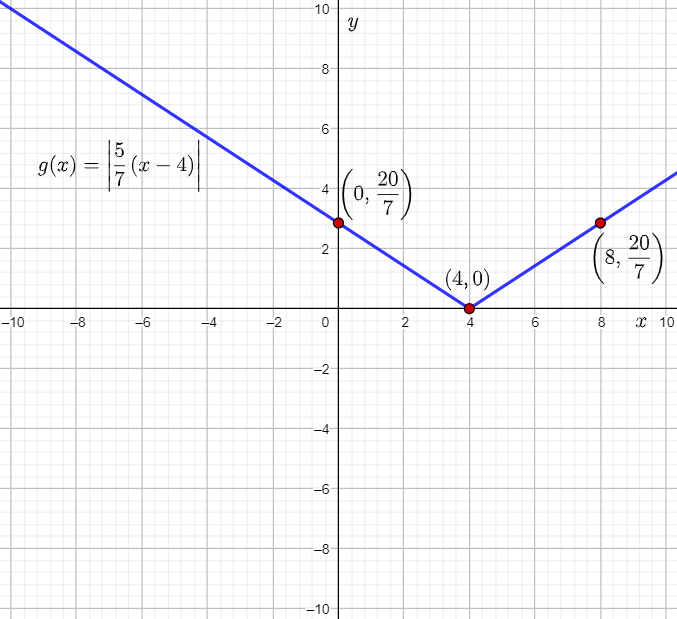
The given function is g(x)=∣5/7(x−4)|.
The question requires to predict how the graph of the given function will look, and verify this using a graphing calculator.
Then, it is required to sketch the graph of the given function.
To sketch the graph, write the translations used to form the given function from the parent absolute value function f(x)=∣x∣, and use them on the vertex to determine the vertex of g(x).
Next, write the coefficient of the absolute value in the given function to find the factor by which the parent absolute function will be vertically stretched.
Then, take two points lying on the parent absolute value function, and determine the location where they will be mapped on g(x) using the transformations used to form g(x) from f(x).
Next, plot the points and vertex and graph the given function.
Finally, use the drawn graph to find and write the domain and range of the function.
The vertex of the parent absolute value function f(x)=∣x∣ is (0,0).
The vertex of g(x) is the point where (0,0) will be mapped using translations.
It can be observed that g(x) involves a translation of f(x) by 4 units to the right.
Therefore, the vertex of g(x) is the point (0+4,0)=(4,0).
Rewrite the given function.
g(x)=5/7∣(x−4)∣
Compare the function g(x) to g(x)=a∣(x−h)∣−k, and write the value of the constant a.
a=5/7
Since a=5/7, that is 0<a<1, the graph of g(x) will involve a vertical compression of the parent absolute value function by a factor 5/7.
The points (4,4) and (−4,4) lie on the parent absolute value function f(x)=∣x∣.
The transformations used to form g(x)=5/7∣(x−4)∣ from the parent absolute value function can be used to determine the two points lying on g(x).
The x-coordinate of the points lying on f(x) will be shifted 4 units to the right when mapped to g(x).
The y-coordinate of the points lying on f(x) will be vertically compressed by the factor 5/7 when mapped to g(x).
Calculate the location where the point (4,4) will be mapped.
(4+4,5/7⋅∣4∣)=(4+4,5/7⋅4)
=(8,20/7)
Calculate the location where the point (−4,4) will be mapped.
(−4+4,5/7⋅∣4∣)=(−4+4,5/7⋅4)
=(0,20/7)
Therefore, the two points (0,20/7) and (8,20/7) lie on the graph of g(x).
Plot the vertex (4,0) and the points (0,20/7) and (8,20/7), and then draw straight lines to sketch the graph of g(x)=∣5/7(x−4)∣.
From the graph, it can be observed that the graph of the function g(x)=∣5/7(x−4)∣ stretches infinitely towards the left and right.
Therefore, the given absolute value function is defined for all values of x.
Hence, the domain of g(x)=∣5/7(x−4)∣ is (−∞,∞).
Also, it can be observed that the y-coordinates of the points lying on the graph of the function g(x)=∣5/7(x−4)∣ are either 0 or greater than 0.

Thus, the range of g(x)=∣5/7(x−4)∣is [0,∞).
The required The domain of g(x) is (−∞,∞).
The range of g(x) is [0,∞).
Page 72 Exercise 8 Answer
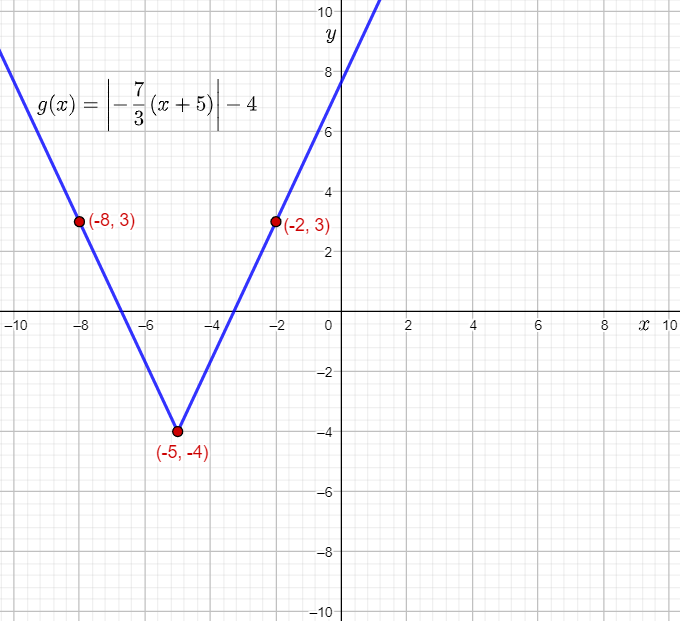
The given function is g(x)=∣−7/3(x+5)−4|.
The question requires to predict how the graph of the given function will look, and verify this using a graphing calculator.
Then, it is required to sketch the graph of the given function.
To sketch the graph, write the translations used to form the given function from the parent absolute value function f(x)=∣x∣, and use them on the vertex to determine the vertex of g(x).
Next, write the coefficient of the absolute value in the given function to find the factor by which the parent absolute function will be vertically stretched.
Then, take two points lying on the parent absolute value function, and determine the location where they will be mapped on g(x) using the transformations used to form g(x) from f(x).
Next, plot the points and vertex and graph the given function. Finally, use the drawn graph to find and write the domain and range of the function.
The vertex of the parent absolute value function f(x)=∣x∣ is (0,0).
The vertex of g(x) is the point where (0,0) will be mapped using translations.
It can be observed that g(x) involves translations of f(x) by 5 units to the left and 4 units down.
Therefore, the vertex of g(x) is the point (0−5,0−4)=(−5,−4).
Rewrite the given function.
g(x)=7/3∣−(x+5)∣−4
g(x)=7/3∣(x+5)∣−4
Compare the function g(x) to g(x)=a∣(x+h)∣−k, and write the value of the constant a.
a=7/3
Since a=7/3, that is a>1, the graph of g(x) will involve a vertical stretch of the parent absolute value function by a factor 7/3.
The points (3,3) and (−3,3) lie on the parent absolute value function f(x)=∣x∣.
The transformations used to form g(x)=7/3∣(x+5)∣−4 from the parent absolute value function can be used to determine the two points lying on g(x).
The x-coordinate of the points lying on f(x) will be shifted 5 units to the left when mapped to g(x).
The y-coordinate of the points lying on f(x) will be vertically stretched by the factor 7/3, and shifted down by 4 units.
Calculate the location where the point (3,3) will be mapped.
(3−5,7/3⋅∣3∣−4)=(3−5,7/3⋅3−4)
=(−2,7−4)
=(−2,3)
Calculate the location where the point (−3,3) will be mapped.
(−3−5,7/3⋅∣3∣−4)=(−3−5,7/3⋅3−4)
=(−8,7−4)
=(−8,3)
Therefore, the two points (−8,3) and (−2,3) lie on the graph of g(x).
Plot the vertex (−5,−4) and the points (−8,3) and (−2,3), and then draw straight lines to sketch the graph of g(x)=∣−7/3(x+5)−4|.

From the graph, it can be observed that the graph of the function g(x)=∣−7/3(x+5)−4| stretches infinitely towards the left and right.
Therefore, the given absolute value function is defined for all values of x.
Hence, the domain of g(x)=∣−7/3(x+5)−4| is (−∞,∞).
Also, it can be observed that the y-coordinates of the points lying on the graph of the function g(x)=∣−7/3(x+5)−4| are either −4, or greater than −4.
Thus, the range of g(x)=∣−7/3(x+5)−4| is [−4,∞).
The required graph is:
The domain of g(x) is (−∞,∞).
The range of g(x) is [−4,∞).
HMH Algebra 2 Volume 1 1st Edition Module 2 Chapter 2 Exercise 2.1 Absolute Value, Functions, Equations And Inequalities Page 72 Exercise 9 Answer
The given graph shows the graph of an absolute value function.
The question requires to write the function in standard form for the given graph, when a=1.
To determine the function, let the given function be g(x)=a∣1/b(x−h)+k|, use the graph to find the vertex, and thus, the values of h,k.
Then, rewrite the function using the obtained values.
Next, find a point other than vertex lying on the graph, and substitute its coordinates in the function to find the value of b.
Finally, use the value of b in the function to obtain the function in the required form.
Let the given function be g(x)=a∣1/b(x−h)+k|, that is an absolute value function in standard form.
From the graph, it can be observed that the vertex of the graphed absolute value function is (−7,4).
This means that the values of h and k are −7 and 4 respectively.
Substitute 1 for a, −7 for h, and 4 for k in g(x)=a∣1/b(x−h)+k|.
g(x)=1∣1/b(x−(−7))+4|
g(x)=∣1/b(x+7)+4|………………(1)
From the graph, it can be observed that the point (−6,6) lies on the graph.
Substitute −6 for x, and then 6 for g(−6) in equation (1), and subtract 4 from both sides.
g(−6)=∣1/b(−6+7)+4|
6=∣1/b(1)+4|
2=∣1/b|……………(2)
Form two equations by rewriting the absolute value in equation (2).
2=1/b
2=−1/b
If 2 is equal to 1/b, then b=1/2.
If 2 is equal to −1/b, then b=−1/2.
Since the absolute value in g(x)=∣1/b(x+7)+4| remains the same for both values of b, consider the value b=1/2.
Substitute 1/2 for b in g(x)=∣1/b(x+7)+4|, and simplify the equation.
g(x)=∣1/12(x+7)+4|
g(x)=∣2(x+7)∣+4
g(x)=2∣(x+7)∣+4
Thus, the graphed absolute value function is g(x)=2∣(x+7)∣+4.
The required absolute value function is g(x)=2∣(x+7)∣+4.
Page 72 Exercise 10 Answer
The given graph shows the graph of an absolute value function.
The question requires to write the function in standard form for the given graph, when b=1.
To determine the function, let the given function be g(x)=a∣1/b(x−h)+k|, use the graph to find the vertex, and thus, the values of h,k.
Then, rewrite the function using the obtained values
. Next, find a point other than vertex lying on the graph, and substitute its coordinates in the function to find the value of a.
Finally, use the value of a in the function to obtain the function in the required form.
Let the given function be g(x)=a∣1/b(x−h)+k|, that is an absolute value function in standard form.
From the graph, it can be observed that the vertex of the graphed absolute value function is (4,3).
This means that the values of h and k are 4 and 3 respectively.
Substitute 1 for b, 4 for h, and 3 for k in g(x)=a∣1/b(x−h)+k|.
g(x)=a∣1/1(x−4)+3|
g(x)=a∣x−4∣+3………………(1)
From the graph, it can be observed that the point (0,2) lies on the graph.
Substitute 0 for x, and then 2 for g(0) in equation (1), subtract 3 from both sides, and then divide both sides by 4.
g(0)=a∣0−4∣+3
2=a∣−4∣+3
−1=a(4)
−1/4=a
Substitute −1/4 for a in g(x)=a∣x−4∣+3.
g(x)=−1/4∣x−4∣+3
Thus, the graphed absolute value function is g(x)=−1/4∣x−4∣+3.
The required absolute value function is g(x)=−1/4∣x−4∣+3.
Page 74 Exercise 11 Answer
The vertex of f(x)=∣x∣, that is the parent absolute value function, is (0,0).
The vertex of y=∣x+6∣−4 is the point where (0,0) will be mapped using translations.
It can be observed that y=∣x+6∣−4 involves translations of f(x) by 6 units to the left and 4 units down.
Therefore, the vertex of the function y=∣x+6∣−4 is the point:
(0−6,0−4)=(−6,−4)
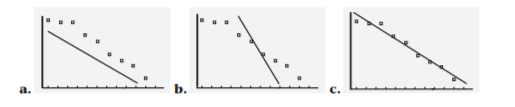
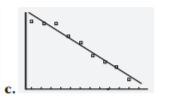
From the given graphs, only the graph in option (C) has the vertex at (−6,−4).
Thus, the graph of the function y=∣x+6∣−4 is the graph in option (C).
The graph in option (A) has the vertex at (6,−4), and not at (−6,−4).
Thus, the graph in option (A) is not the graph of the function y=∣x+6∣−4.
The graph in option (B) has the vertex at (6,4), and not at (−6,−4).
Thus, the graph in option (B) is not the graph of the function =∣x+6∣−4.
The graph of the function y=∣x+6∣−4 is the graph in option (C).
Exercise 2.1 Absolute Value Worked Examples HMH Algebra 2
HMH Algebra 2 Volume 1 1st Edition Module 2 Chapter 2 Exercise 2.1 Absolute Value, Functions, Equations And Inequalities Page 74 Exercise 12 Answer
The vertex of f(x)=∣x∣, that is the parent absolute value function, is (0,0).
The vertex of y=∣x−6∣−4 is the point where (0,0) will be mapped using translations.
It can be observed that y=∣x−6∣−4 involves translations of f(x) by 6 units to the right and 4 units down.
Therefore, the vertex of the function y=∣x−6∣−4 is the point:
(0+6,0−4)=(6,−4)
From the given graphs, only the graph in option (A) has the vertex at (6,−4).
Thus, the graph of the function y=∣x−6∣−4 is the graph in option (A).
The graph in option (B) has the vertex at (6,4), and not at (6,−4).
Thus, the graph in option (B) is not the graph of the function y=∣x−6∣−4.
The graph in option (C) has the vertex at (−6,−4), and not at (6,−4).
Thus, the graph in option (C) is not the graph of the function y=∣x−6∣−4.
The graph of the function y=∣x−6∣−4 is the graph in option (A).
Page 74 Exercise 13 Answer
The vertex of f(x)=∣x∣, that is the parent absolute value function, is (0,0).
The vertex of y=∣x−6∣+4 is the point where (0,0) will be mapped using translations.
It can be observed that y=∣x−6∣+4 involves translations of f(x)
by 6 units to the right and 4 units up.
Therefore, the vertex of the function y=∣x−6∣+4 is the point: (0+6,0+4)=(6,4)
From the given graphs, only the graph in option (B) has the vertex at (6,4).
Thus, the graph of the function y=∣x−6∣+4 is the graph in option (B).
The graph in option (A) has the vertex at (6,−4), and not at (6,4).
Thus, the graph in option (A) is not the graph of the function y=∣x−6∣+4.
The graph in option (C) has the vertex at (−6,−4), and not at (6,4).
Thus, the graph in option (C) is not the graph of the function y=∣x−6∣+4.
The graph of the function y=∣x−6∣+4 is the graph in option (B).
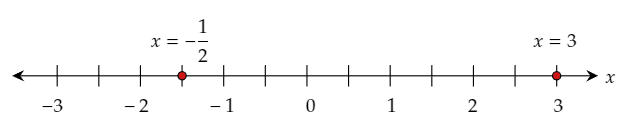
Page 75 Exercise 14 Answer
The vertex of f(x)=∣x∣, that is the parent absolute value function, is (0,0).
The vertex of y=∣x+3∣+2 is the point where (0,0) will be mapped using translations.
It can be observed that y=∣x+3∣+2 involves translations of f(x) by 3 units to the left and 2 units up.
Therefore, the vertex of the given function is the point (0−3,0+2)=(−3,2).
The given graph is not the graph of the function y=∣x+3∣+2 because the vertex of the function in the graph is (3,2) and not (−3,2).
The function in the graph involves translations of the parent absolute value function f(x)=∣x∣ by 3 units to the right and 2 units up.
Thus, the correct equation shown in the graph is y=∣x−3∣+2.
The graphed function is not the graph of y=∣x+3∣+2 because the vertex of the function in the graph is (3,2), and the vertex of the given function is (−3,2).
The correct equation shown in the graph is y=∣x−3∣+2.
HMH Algebra 2 Volume 1 1st Edition Module 2 Chapter 2 Exercise 2.1 Absolute Value, Functions, Equations And Inequalities Page 71 Exercise 15 Answer
It is given that the golf ball is at the point (2.5,2), the hole where the golf ball is to be shot is at (9.5,2), and the point where the golf ball banks off the side wall is (6,8).
The question requires to equation of the path of the ball.
To determine the equation, draw the graph representing the given situation.
Then, observe that the path of the ball is the graph of an absolute value function, and write a general function for the path.
Assume b=1, use the graph to find the vertex, and thus, the values of h,k. Then, rewrite the function using the obtained values.
Next, find a point other than vertex lying on the graph, and substitute its coordinates in the function to find the value of a.
Finally, use the value of a in the function to obtain the function representing the path of the ball.
Draw the graph representing the given points, and join them to show the path of the ball.
It can be observed that the path of the ball is the graph of an absolute value function.
Let the equation for the path of the ball be represented by the function g(x)=a∣1/b(x−h)+k|.
Assume that b=1.
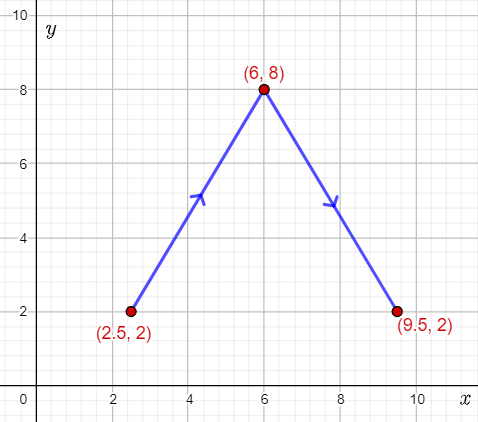
From the graph, it can be determined that the vertex of the graph of the function is (6,8).
This means that the values of h and k are 6 and 8 respectively.
Substitute 1 for b, 6 for h, and 8 for k in the equation g(x)=a∣1/b(x−h)+k|.
g(x)=a∣1/1(x−6)+8|
g(x)=a∣x−6∣+8………………(1)
The path of the ball starts from the point (2.5,2).
Substitute 2.5 for x, and then 2 for g(2.5) in equation (1). Then, subtract 8 from both sides, and divide both sides by 3.5.
g(2.5)=a∣2.5−6∣+8
2=a∣−3.5∣+8
−6=a(3.5)
−6/3.5=a
−12/7=a
Substitute −12/7 for a in g(x)=a∣x−6∣+8.
g(x)=−12/7∣x−6∣+8
Thus, the equation representing the path of the ball is g(x)=−12/7∣x−6∣+8.
The required equation is g(x)=−12/7∣x−6∣+8.
Page 75 Exercise 16 Answer
It is given that the golf ball is at the point (2.5,2), the hole where the golf ball is to be shot is at (9.5,2), and the point where the golf ball banks off the side wall is (6,8).
The question requires to determine if the player makes the shot.
Given the equation g(x)=−12/7∣x−6∣+8 representing the path of the ball as calculated in the previous part of this exercise.
To answer the question, substitute the point (9.5,2) on the equation for path of the ball, and check whether the point lies on the path.
Substitute 9.5 for x and 2 for g(9.5) in equation g(x)=−12/7∣x−6∣+8, and simplify both sides of the equation.
g(9.5)=−12/7∣9.5−6∣+8
2=−12/7∣3.5∣+8
2=−12/7(3.5)+8
2=−6+8
2=2
The point (9.5,2) satisfies the equation for the path of the ball because the equation 2=2 is always true.
Therefore, the point (9.5,2)representing the hole where the golf ball is aimed at lies on the path of the ball.
Thus, the player makes the shot.
Yes, the player makes the shot because the point (9.5,2) representing the hole, where the golf ball is to be shot, lies on the path of the ball.
Page 76 Exercise 17 Answer
It is given that the orchestra starts at fortissimo, changes to pianissimo after four measures, and again increases to fortissimo after four more measures.
Also, it is given that a fortissimo and pianissimo are at sound levels 90 and 50 decibels respectively.
The question requires to determine the function representing the sound level s as a function of the number of measures m.
To determine the function, use the points of the form (m,s) and the given information to find three points lying on the graph of the required function.
Plot the points, join them, observe the graph formed, and write the required function as a general absolute value function.
Assume b=1, use the graph to find the vertex, and thus, the values of h,k.
Then, rewrite the function using the obtained values.
Next, find a point other than vertex lying on the graph, and substitute its coordinates in the function to find the value of a.
Then, use the value of a in the function to obtain the function representing the sound level.
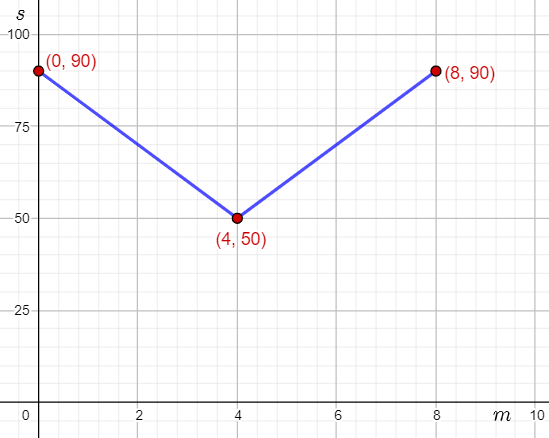
The points (m,s) can be used to represent the sound level at a particular number of measures.
The initial sound level at zero number of measures is s=90 decibels.
The sound level after four number of measures is s=50 decibels.
The sound level after eight number of measures is s=90 decibels.
Therefore, the points (0,90),(4,50),(8,90) lie on the graph of the function representing the sound level.
Plot the points, and join them to show the graph of the function representing the sound level.
The graph of the function representing the sound level s as a function of the number of measures m can be represented by the function s=a∣1/b(m−h)+k|.
Assume that b=1.
The vertex of the function is the point is the relative extrema (4,50).
This means that the values of h and k are 4 and 50 respectively.
Substitute 1 for b, 4 for h, and 50 for k in the equation s=a∣1/b(m−h)+k|.
s=a∣1/1(m−4)+50|
s=a∣m−4∣+50………………(1)
The point representing the initial sound level at zero numbers of measures is the point (0,90).
Substitute 0 for x and 90 for s in equation (1). Then, subtract 50 from both sides, and then divide both sides by 4.
90=a∣0−4∣+50
90=a∣−4∣+50
40=a(4)
10=a
Substitute 10 for a in s=a∣m−4∣+50.
s=10∣m−4∣+50
Thus, the function representing the sound level s as a function of the number of measures m is s=10∣m−4∣+50.
The required function is s=10∣m−4∣+50.
HMH Algebra 2 Volume 1 1st Edition Module 2 Chapter 2 Exercise 2.1 Absolute Value, Functions, Equations And Inequalities Page 76 Exercise 18 Answer
It is given that the orchestra starts at fortissimo, changes to pianissimo after four measures, and again increases to fortissimo after four more measures.
Also, it is given that a fortissimo and pianissimo are at sound levels 90 and 50 decibels respectively.
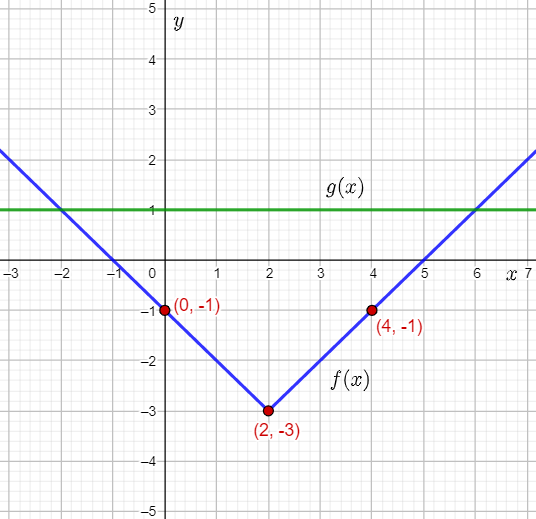
The question requires to determine the number of measures at which the orchestra is at the loudness of mezzo forte, that is 70 decibels.
Given the equation s=10∣m−4∣+50 representing the sound level s as a function of the number of measures m, as calculated in the previous part of this exercise.
To determine the number of measures, substitute the sound level as 70 in the function for the sound level, and solve the equation for m by rewriting the absolute value.
Substitute 70 for s in equation s=10∣m−4∣+50, subtract 50 from both sides, and divide both sides by 10.
70=10∣m−4∣+50
20=10∣m−4∣
2=∣m−4∣………………(1)
Form two equations by rewriting the absolute value in equation (1).
2=m−4
2=−(m−4)
Add 4 on both sides of 2=m−4 to solve for m.
2+4=m−4+4
6=m
Simplify the right-hand side of 2=−(m−4), and solve for m.
2=−m+4
m=4−2
m=2
The two values of m are 2 and 6.
Thus, the orchestra is at the loudness of mezzo forte in 2 measures and in 6 measures.
The required number of measures at which orchestra is at the loudness of mezzo forte are 2 measures and 6 measures.
Page 76 Exercise 19 Answer
It is given that the orchestra starts at fortissimo, changes to pianissimo after four measures, and again increases to fortissimo after four more measures.
Also, it is given that a fortissimo and pianissimo are at sound levels 90 and 50 decibels respectively.
The question requires to describe how the graph of the given function will look.
Given the equation s=10∣m−4∣+50 representing the sound level s as a function of the number of measures m, as calculated in part (a) of this exercise.
To answer the question, compare the given function to the general form s=a∣(m−h)∣+k to find the values of the constants, and then describe the graph using the transformations that are required to form the function from the parent absolute value function.
Compare the function for sound level to the general form s=a∣(m−h)∣+k, and write the values of the constants.
a=10
h=4
k=50
The value of a is positive. Therefore, the graph of s=10∣m−4∣+50 will open upwards.
Since ∣a∣=10, that is greater than 1, the graph will be a vertical stretch of the parent absolute value function by a factor 10.
Since h=4, the graph will be a horizontal translation of the parent absolute value function by 4 units to the right.
Since k=50, the graph will involve a vertical translation of the parent absolute value function by 50 units up.
Therefore, the graph of s=10∣m−4∣+50 will open upwards.
It will be a vertical stretch of the parent absolute value function by a factor 10, a horizontal translation by 4 units to the right, and finally, a vertical translation 50 units up.
The graph of s=10∣m−4∣+50 will open upwards and will be a vertical stretch of the parent absolute value function by a factor 10, a horizontal translation by 4 units to the right, and finally, a verical translation 50 units up.