
Chapter 4 Represent And Solve Equations And Inequalities
Section 4.10: Relate Tables, Graphs And Equations
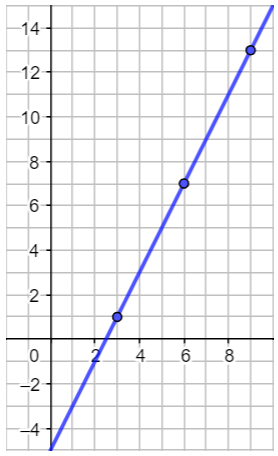
Page 239 Exercise 1 Answer
Draw a line through the three given points on the graph.
Remember that each ordered pair on the line is of the form (m,n) so the ordered pair on the line that includes m = 5 is the ordered pair (5,9).
Since m is the number of blocks that Maria has walked and n is the number of blocks that Nancy has walked, then the ordered pair (5,9) means
Nancy has walked 9 blocks when Maria has walked 5 blocks

Result
The ordered pair is (5,9) and means Nancy has walked 9 blocks when Maria has walked 5 blocks.
Read And Learn More: enVisionmath 2.0 Grade 6 Volume 1 Solutions
enVisionmath 2.0: Grade 6 Page 239 Exercise 1 Answer
Since Nancy walked 4 blocks to Maria’s house and then they continued walking together, then Nancy walked 4 more blocks than Maria. The number of blocks that Nancy walked will then always be equal to the number of blocks Maria walked plus 4.
This relationship is represented in the given equation n = m + 4 since n represents the number of blocks Nancy walked, m represents the number of blocks Maria walked, and the equation represents the pattern of n equalling 4 more than m.
We are also given the following table:

Since 5 = 1 + 4, 6 = 2 + 4, and 7 = 3 + 4, then the values of n in the table are equal to the value of m plus 4.
The given graph has the ordered pairs from the table so the graph also represents the value of n being equal to the value of m plus 4.
Result
The equation, table, and graph all have values of n that equal the values of m plus 4 so they all represent Nancy walking 4 more blocks than Maria.
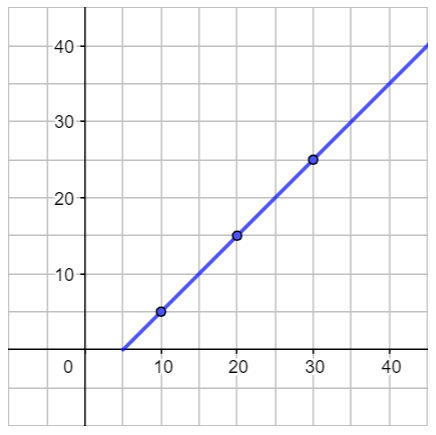
Page 240 Exercise 1 Answer
It is given that the booster club raises $0.41 For each pom pom they sell so the total money raised, r is equal to $0.41 times the number of pom poms, n.
That is r = $0.41 x n so the equation for this situation is r = 0.41n
To complete the table, we need to find the value of r for n = 150. Substituting n = 150 into the equation and simplifying gives:
r = 0.41n = 0.41(150) = 61.50
The table is then completed as:

To complete the graph, plot the three ordered pairs from the table and then draw a line passing through the points. Since n and r can’t be negative, your line should start at the origin:

To find how many pom poms they must sell to raise $50, we can substitute r = 50 into the equation and then solve for n:
r = 0.41n
50 = 0.41n Substitute r = 50.
50 ÷ 0.41 = 0.41n ÷ 0.41 Divide both sides by 0.41.
121.95 ≈ n Simplify.
The number of pom poms must be a whole number so they need to sell 122 pom poms to raise $50.
Finding three values for x and y helps us represent the relationship between x and y because it gives us three ordered pairs for the relationship. These ordered pairs can be used to create a table and a graph. The ordered pairs can also be used to write the equation if it wasn’t given.
Result
They need to sell 122 pom poms to raise $50.
Finding three values for x and y helps us represent the relationship between x and y because it gives us three ordered pairs for the relationship. These ordered pairs can be used to create a table and a graph. The ordered pairs can also be used to write the equation if it wasn’t given.
Page 241 Exercise 2 Answer
It is given that all of the supplies have a cost of $5 and that the company sells the decorations for $2 a piece.
Profit is equal to revenue minus cost so to find the profit, y, we need to multiply the number of decorations sold, x by $2 to get the revenue, and then subtract the cost of $5.
If the number of decorations sold are x = 3, x = 6, and x = 9, then the profits are:
x = 3 : y = $2(3) – $5 = $6 – $5 = $1
x = 6 : y = $2(6) – $5 = $12 – $5 = $7
x = 9 : y = $2(9) – $5 = $18- $5 = $13
y = $2(x) – $5
A possible way to complete the table is then:

Note that you can choose any two values of x for the last two rows of the table so your table may vary from mine if you chose different values for x.
From completing the table, we determined that the equation is y = 2x – 5.
To complete the graph, plot the three ordered pairs from your table and then draw a line passing through the points. Remember that profit y, can be negative but the number of decoration, x, can’t be negative so your line should start on the y-axis at (0,-5).
If the company must have a profit of $15, then y = 15. Substituting this into the equation and solving for x gives:
y = 2x − 5
15 = 2x − 5 Substitute y = 15.
15 + 5 = 2x − 5 + 5 Add 5 on both sides.
20 = 2x Simplify.
10 ÷ 2 = 2x ÷ 2 Divide both sides by 2.
10 = x Simplify.
The company must then sell 10 decorations to have a profit of $15. Notice this matches with our graph since the line passes through the point (10,15).
Result
Possible table:
y = 2x – 5
The company must sell 10 decorations to have a profit of $15.
Page 242 Exercise 1 Answer
The independent variable is represented on the x-axis and the dependent variable is on the y-axis.
An equation describes the relationship between the independent and the dependent variable by telling us what numbers and operations relate the values of the two variables. The equation can be made into a table, one column show the values of the independent and the other the values of the dependent variable. The table then gives coordinate pairs which can be plotted and a graph can be drawn.
Result
An equation describes the relationship between the independent and the dependent variable by telling us what numbers and operations relate the values of the two variables. The equation can be made into a table which gives coordinate pairs that can be plotted and a graph can be drawn.
Page 242 Exercise 2 Answer
To raise $75 for charity they need to sell x pom poms for the cost of $0.45 each. Thus, the answer is the solution of the equation:$ x × 0.45 = 75.$
x × 0.45 = 75
x × 0.45 ÷ 0.45 = 75 ÷ 0.45 (Divide both sides by 0.45.)
x ≈166.67
They must sell 167 pom poms to raise $75.
Result
167
Page 242 Exercise 3 Answer
It is given that for every 4 bananas a grocery store sells, it sells 2 apples.
This means that if the grocery store sells b = 4 bananas, it would also sell a = 2 apples so the number of apples sold, a, is half the number of bananas sold, b. That is, a = \(\frac{1}{2}\)b.
Therefore, Maria’s equation of 4b × 2 = a does not correctly represent the relationship. We can verify this by substituting a = 2 and b = 4 into her equation and showing both sides are not equal:
4b x 2 = a
4(4) x 2 = 2
16 x 2 = 2
32 ≠ 2
Result
Mary’s equation does not correctly represent the relationship. The correct equation is a = \(\frac{1}{2}\)b.
Page 242 Exercise 4 Answer
It is given that d = 4t. Substituting each of the given values of t into this equation and simplifying gives:
d = 4t
t = 1 : d = 4(1) = 4
t = 2 : d = 4(2) = 8
t = 3 : d = 4(3) = 12
The completed table is then:

Result
Page 242 Exercise 5 Answer
In Exercise 4, we made the following table:
From the table, we know that three ordered pairs found on the line are then (1,4), (2,8) and (3,12)
To find a fourth ordered pair, we need to substitute a fourth value of t into the equation. Substituting t = 4 and simplifying gives:
d = 4t = 4(4) = 16
A fourth ordered pair on the line is then (4,16)
Result
(1,4), (2,8), (3,12), and (4,16)
Page 242 Exercise 6 Answer
We know the equation d = 4t where d is the distance and t is the time represents the relationship between the variables.
This relationship described in words is:
The distance, d, is equal to 4 times the time, t.
Result
The distance, d, is equal to 4 times the time, t.
Page 242 Exercise 7 Answer
We are given the equation d = 5 + 5t where d is the distance and t is the time.
First, we need to complete the table for t = 0, t = 2, and one additional value of t. I have chosen to find d for t = 4. To find the values of d, substitute each value of t into the equation and then simplify:
d = 5 + 5t
t = 0 : d = 5 + 5(0) = 5 + 0 = 5
t = 2 : d = 5 + 5(2) = 5 + 10 = 15
t = 4 : d = 5 + 5(4) = 5 + 20 = 25
The table can then be completed as follows:

To complete the graph, plot the ordered pairs from your table and then draw a line passing through the points. Since d and t can’t be negative, your line should start on the y-axis at (0, 5):

Result
Page 243 Exercise 8 Answer
We are given the equation l = w + \(\frac{1}{2}\)
We need to complete the table for w = 1, w = 2, and one additional value of w. I have chosen to find l when w = 3. To find the values of l, substitute each of the given values of w into the equation and then simplify:
l = w + \(\frac{1}{2}\)
\(w=1: l=1+\frac{1}{2}=1 \frac{1}{2}\) \(w=2: l=2+\frac{1}{2}=2 \frac{1}{2}\) \(w=3: l=3+\frac{1}{2}=3 \frac{1}{2}\)The table can then be completed as:

To complete the graph, plot the ordered pairs from your table and then draw a line passing through the points. Since l and w can’t be negative, your line should start on the y-axis at (0, \(\frac{1}{2}\)):

Result
Page 243 Exercise 9 Answer
We are given the equation s = r – 5.
We need to complete the table for r = 10, r = 20, and one additional value of r. I have chosen to find s when r = 30. To find the values of s, substitute each of the given values of r into the equation and then simplify:
s = r – 5
r = 10 : s = 10 – 5 = 5
r = 20 : s = 20 – 5 = 15
r = 30 : s = 30 – 5 = 25
The table can then be completed as:

To complete the graph, plot the ordered pairs from your table and then draw a line passing through the points. Since r and s can’t be negative, your line should start on the x-axis at (5, 0):
Result
Page 243 Exercise 10 Answer
Since both points, (2,4) and (−2,−4), are on the graph of y = a × x, when the coordinates of the points are substituted as the values of the equation, the equation must be true.
Use substitution to find the value of a.
y = a x x
4 = a x 2
4 ÷ 2 = a (Divide both sides by 2.)
2 = a
−4 = a × (−2)
−4 ÷ (−2) = a (Divide both sides by −2.)
2 = a
The value of a is 2.
Result
a = 2
Page 243 Exercise 11 Answer
If a point is on the graph, its coordinates, when substituted as values of the equation, make the equation true.
The equation is y = 2 × x. A point on the graph is (x,y).
Let’s say x = 1, then y = 2 × 1 = 2. A point (1,2) is on the graph.
Let’s say x = 3, then y = 2 × 3 = 6. A point (3,6) is on the graph.
Let’s say x = 4, then y = 2 × 4 = 8. A point (4,8) is on the graph.
Result
(1,2), (3,6), (4,8)
Page 243 Exercise 12 Answer
It cost $40 and then an additional $0.10 per mile. Since they will drive for m miles, the product m × $0.10 represents how much they will have to pay for the miles. Add to that the $40 they must pay in the beginning.
The equation which represents the cost for renting a car is:
c = $40 + m × $0.10.
Result
c = $40 + m × $0.10
Page 244 Exercise 13 Answer
Let x be the number of weeks. We know the puppy gains \(\frac{1}{2}\) pound each week so after x weeks, the number of pounds the puppy has gained is:
(amount gained each week) . (number of weeks) = \(\frac{1}{2}\)x
The puppy initially weighs 1 pound so the puppy’s weight after x weeks is:
initial weight + amount of weight gained = 1 + \(\frac{1}{2}\)x
Letting y be the puppy’s weight then gives the equation y = 1 + \(\frac{1}{2}\)x
To complete the table, we need to find the corresponding y-values for x = 0, x = 2, and one additional value of x. I have chosen to find the y-value for y = 4. To find the y-values, substitute each of the x-values into the equation and then simplify:
y = 1 + \(\frac{1}{2}\)x
\(x=0: y=1+\frac{1}{2}(0)=1+0=1\) \(x=2: y=1+\frac{1}{2}(2)=1+1=2\) \(x=4: y=1+\frac{1}{2}(4)=1+2=3\)The completed table is then:

From the table, the puppy weighs 3 pounds after 4 weeks.
To complete the graph, plot the points from your table and then draw a line passing through them. Remember that the number of weeks and the puppies weight can’t be negative so your line should start at the y-axis at (0, 1):

Result
y = 1 + \(\frac{1}{2}\)x-values
The puppy weighs 3 pounds after 4 weeks.
Page 244 Exercise 14 Answer
To write the equation, we need to use the following relationship:
total amount refunded = (matinee ticket price) x (number of people)
It is given that the matinee ticket price is $5.00. If we let r be the total amount refunded and n be the total number of people, then we get:
r = $5.00 x n
The equation representing the amount of money refunded is then r = 5n.
Result
r = 5n
Page 244 Exercise 15 Answer
We are given the following table:

In the table, we can see that the values of y increase by 3 each time the values of x increase by 1. This means the equation will have 3 times the value of x. Each value of y can then be written as the sum of a multiple of 3 and some other number. We can then rewrite the values of y as:
8 = 3 + 5 = 3(1) + 5
11 = 6 + 5 = 3(2) + 5
14 = 9 + 5 = 3(3) + 5
17 = 12 + 5 = 3(4) + 5
y = 3(x) + 5
The equation that matches with the table is then y = 3x + 5.
Result
The equation is y = 3x + 5. I found this equation by finding how much the values of y changed each time x increased by 1 and then used this to rewrite each y-value as a sum.
Page 244 Exercise 16a Answer
To find which equation represents the graph choose a point, for example (1,2), which is on the graph and substitute variables in both equations with their values.
If the equation is true for selected values, than it represents the graph.
y = 2x
2 = 2(1)
2 = 2
y = x + 2
2 = 1 + 2
2 ≠ 3
The equation y = 2x represents the graph.
Result
y = 2x
Page 244 Exercise 16b Answer
From PART A, we know the equation for the graph is y = 2x.
This relationship in words is: The value of y is 2 times the value of x.
Result
The value of y is 2 times the value of x.