
Envision Math Grade 8 Volume 1 Student Edition Solutions Chapter 2 Analyze And Solve Linear Equations Exercise 2.7
Page 129 Exercise 1 Answer
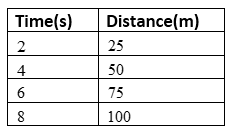
It is given that A group of college students developed a solar-powered car and entered it in a race.
The car travels at a constant speed of 100 meters per 4 seconds.
We have to graphically represent the distance over time.
We know that the students have developed a solar powered car.
The speed of the car is constant which is 100 meters in 4 seconds.
We can graphically represent the same as below:
On x-axis we will mark the time, while distance on y-axis.
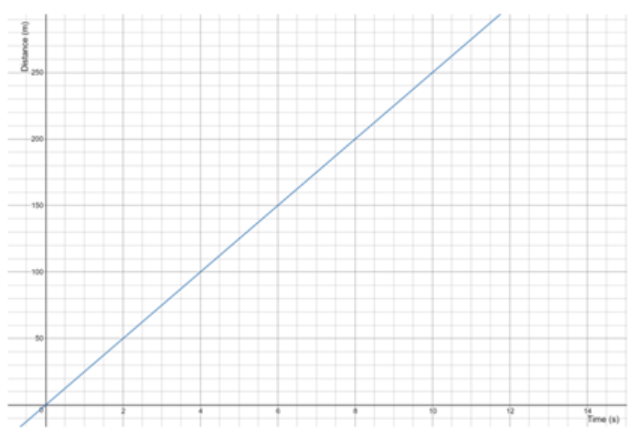
The given graph is the representation of distance over time.
It is given that A group of college students developed a solar-powered car and entered it in a race.
The car travels at a constant speed of 100 meters per 4 seconds.
We have to find the expression which can show the distance the car will travel over time.
We know that the students have developed a solar powered car.
The speed of the car is constant which is 100 meters in 4 seconds.
The expression for the same can be evaluated, but for which first we need to find the unit rate.
Thus, we divide the distance with time and get unit rate as
\(\frac{100}{4}=25 \mathrm{~m} / \mathrm{s}\)Therefore, the expression will be y = 25x.
The expression which can show the distance the car will travel over time will be y = 25x
It is given that A group of college students developed a solar-powered car and entered it in a race.
The car travels at a constant speed of 100 meters per 4 seconds.
We have to compare the representation and the expression of distance over time, and tell which shows clearly.
We know that the students have developed a solar powered car.
The speed of the car is constant which is 100 meters in 4 seconds.
The representation of the distance over time is

The expression for the same can be evaluated, but for which first we need to find the unit rate.
Thus, we divide the distance with time and get unit rate as
\(\frac{100}{4}=25 \mathrm{~m} / \mathrm{s}\)Therefore, the expression will be 25x.
On comparing the both, we can observe that the expression will provide much clear results ad compared to representation.
This is because representation would not be able to give clear result when the time period is longer.
On comparing the both, we can observe that the expression y = 25x will provide much clear results ad compared to representation.
This is because representation would not be able to give clear result when the time period is longer.
Envision Math Grade 8 Volume 1 Chapter 2 Exercise 2.7 Linear Equations Solutions
Envision Math Grade 8 Volume 1 Student Edition Solutions Chapter 2 Analyze And Solve Linear Equations Exercise 2.7 Page 130 Question 1 Answer
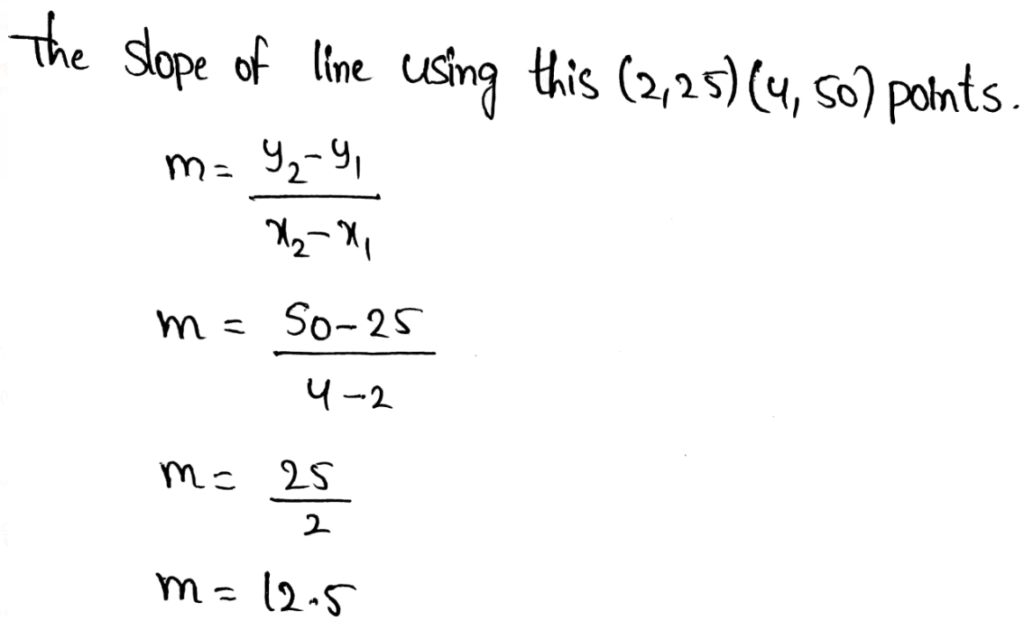
The table given shows the relationship between the number of miles Manuel walks and the amount of money he will raise. Petra will earn $15 for each mile that she walks.
We have to find the quantities to find the unit rate in order to compare the proportional relationship.
When there is a relationship between two variables, and the ratio of the two variables are equivalent, then it is known as proportional relationship.
We are given the data regarding the relationship between the number of miles Manuel walks and the amount of money he will raise.
If we have to compare the proportional relationships, we will use the quantities Money Raised and the Miles Walked.
On doing so, we can find the amount of money earned for each mile which is unit rate.
The quantities that we should use to find the unit rate are Money Raised and the Miles Walked so that the proportional relationships can be compared.
Page 130 Exercise 1 Answer
We have to build a fence for which the length and cost is given.
We have to find the relation between the length of the fence and the cost.
We know that the students in Meg’s class are building a fence around the class garden.
For fencing and costing, the length of fence and the cost for each feet is to be known.
The length of fencing and cost both factors are related to each other.
This is because, to calculate the complete costing of the fencing work, we will have to multiply the total length of the fence suppose in feets and the cost required to build fence of 1 feet, which is its rate.
The length of fencing and cost both factors are related to each other as both are needed to find total costing.
Envision Math Grade 8 Exercise 2.7 Analyze And Solve Linear Equations
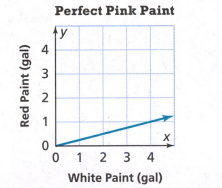
Envision Math Grade 8 Volume 1 Student Edition Solutions Chapter 2 Analyze And Solve Linear Equations Exercise 2.7 Page 130 Exercise 1 Answer
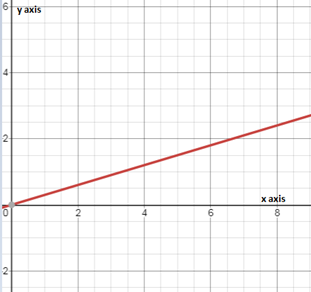
The graph of distance per gallon is given.
We have to find the slope of the line.
Slope is defined as the ratio of the change in the y-coordinate to the change in x-coordinate.
It is represented by the letter m.
The equation for line involving slope is, y = mx.
Thus, the equation for the given line will be y = 20x.
The relationship given will tell us the amount of gasoline used for a certain distance.
The slope of the line is obtained as 20 and the equation for line is y = 20x.
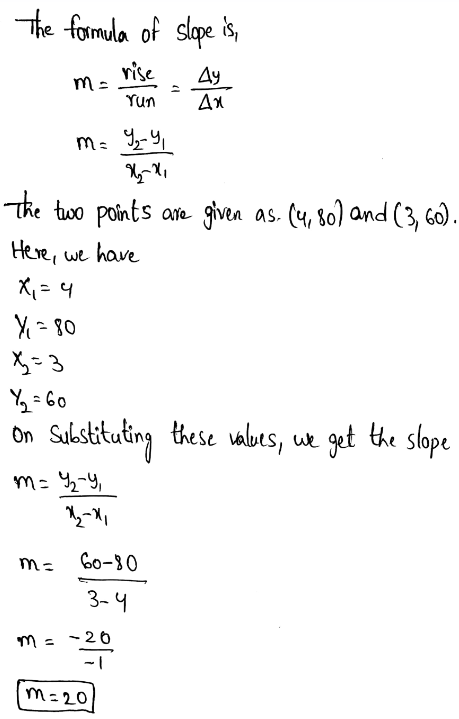
Page 131 Exercise 2 Answer
The graph of a line is given.
We have to find the equation of the line.
The general equation of a line is y = mx, where m is the slope of the line.
Slope is defined as the ratio of the change in the y-coordinate to the change in x-coordinate.
It is represented by the letter m.
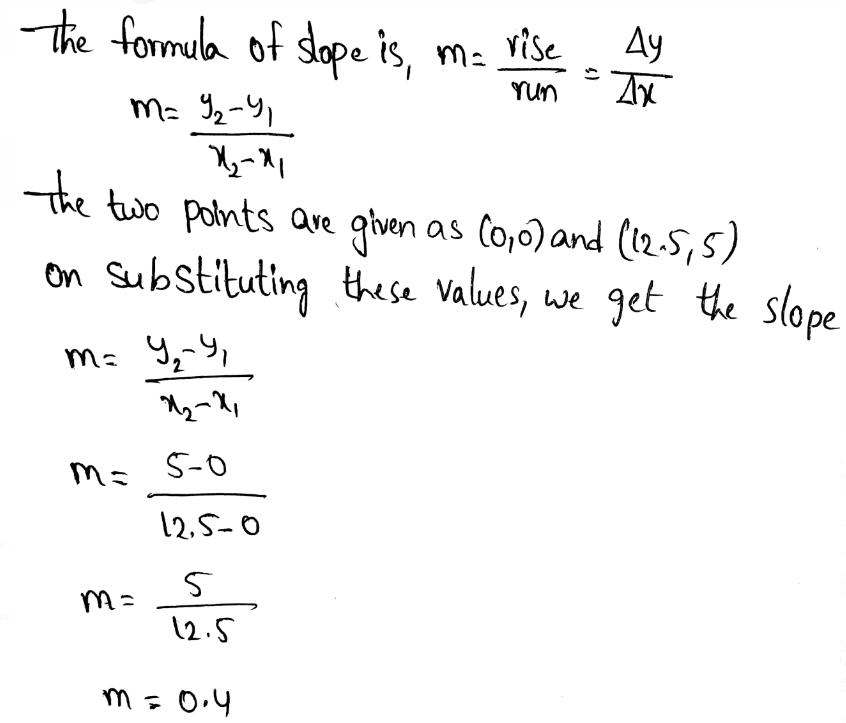
On substituting the value of slope in equation of line we get,
y = 0.4x
The equation of the line is obtained as y = 0.4x.
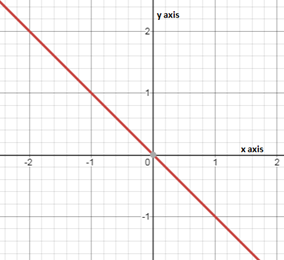
The graph of a line is given.
We have to find the equation of the line.
The general equation of a line is y = mx, where m is the slope of the line.
Here the equation given is y=−3x, so the slope is −3.
We consider the first point as (0,0).
For the second point, we take as x = 5 and then y = −3x = −3(5) = −15
So, the second point will be (5,−15)
Using, these two points we will draw the graph as below:
The graph of the line is obtained as
Analyze And Solve Linear Equations Grade 8 Exercise 2.7 Envision Math
Envision Math Grade 8 Volume 1 Student Edition Solutions Chapter 2 Analyze And Solve Linear Equations Exercise 2.7 Page 130 Exercise 1 Answer
We need to explain how to do the equations y = mx and y = kx can be compared.
The equation y = mx represents that the relationship is proportional to each other.
That is the equation represents a linear equation.
Here, m is the slope of the line.
The equation y = kx is compared with y = mx
Thus, it denotes that,
k = m
This means that the slope of the line is k
This refers that the rate of change is k
When we compare both equations, the slope or the rate of change of the equation is m = k
Page 131 Exercise 1 Answer
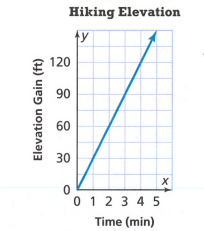
We need to generalize the concept that the lines that slant upward from left to right have positive slopes. Lines that slant downward from left to right have negative slopes.
We know that when we plot linear equations, the graph will be of a straight line.
The straight line may go upwards or downwards depends upon the slope or its rate of change.
If the slope or the rate of change of the equation is negative, then the lines will slant downwards from left to right.
This will result in a negative slope.
If the slope or the rate of change of the equation is positive, then the lines will slant upwards from left to right.
This will result in a positive slope.
If the slope or the rate of change of the equation is negative, then the lines will slant downwards from left to right.
If the slope or the rate of change of the equation is positive, then the lines will slant upwards from left to right.
Envision Math Grade 8 Volume 1 Student Edition Solutions Chapter 2 Analyze And Solve Linear Equations Exercise 2.7 Page 132 Exercise 1 Answer
Any equation of proportional relationship looks like y = mx where “m” is the slope.
This means that the slope will show us how fast will the line increase or decrease and tells us the unit rate.
Any equation of proportional relationship looks like y = mx where “m” is the slope.
This means that the slope will show us how fast will the line increase or decrease and tells us the unit rate.
Page 132 Exercise 2 Answer
The graphs of lines that are in the form like y = mx always pass through the origin.
The graphs of lines that are in the form like y = mx always pass through the origin. They will only differ in the rate of increasing or decreasing of the line.
Page 132 Exercise 3 Answer
Given
To find the slope of the line using this (2,25)(4,50) points.
Hence, the equation is y = 12.5x
Page 132 Exercise 4 Answer
Given:
To find the slope and the constant of the proportionality we simply have to use two points that we can read from the graph.
The slope and the constant of proportionality are both 30.
Given:
To find the slope and the constant of the proportionality we simply have to use two points that we can read from the graph.
The graphs of the straight lines have equation that is equivalent to So, the equation is y = 30x
Therefore, the equation of the line is y = 30x
Envision Math Grade 8 Chapter 2 Exercise 2.7 Solutions
Envision Math Grade 8 Volume 1 Student Edition Solutions Chapter 2 Analyze And Solve Linear Equations Exercise 2.7 Page 132 Exercise 5 Answer
Given:
\(y=-\frac{1}{2} x\) To solve the graph equation
We are going to use two points that we can get from equation and through those two points we simply have to draw a straight line.
We are going to find the y when x = 0 and x = −2
y=\(-\frac{1}{2} * 0\)
y = 0
y=\(-\frac{1}{2} *-2\)
y = 1
The two points are (0,0) and (-2,1)
The graph of the line is
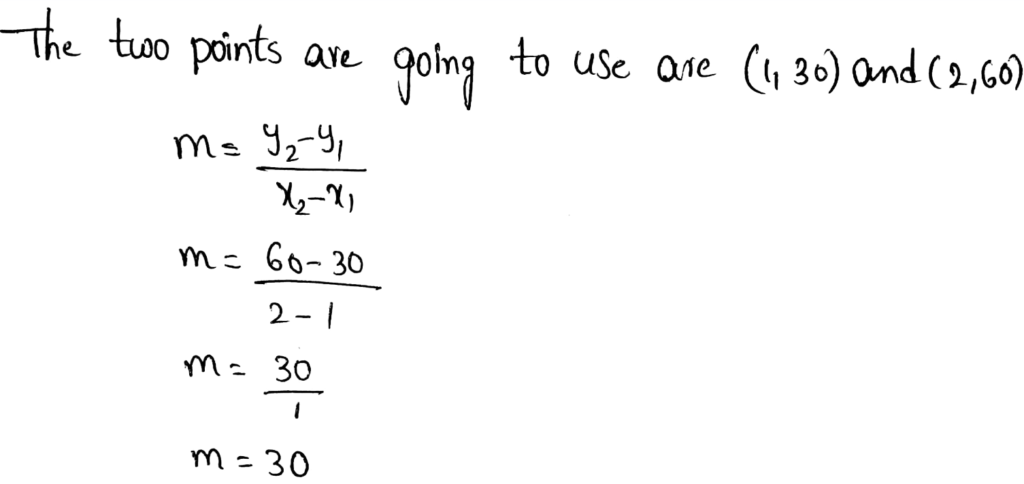
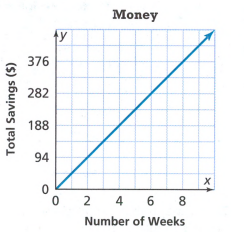
Page 133 Exercise 6 Answer
To find the equation of the line
We are going to use two points which are (4, 280) and (2, 140)
\(m=\frac{y_2-y_1}{x_2-x_1}\) \(m=\frac{280-140}{4-2}\)=\(\frac{140}{2}\)
= 70
The slope of the line is 70.
The equation of the line is y = 70x.
The heart’s resting heart rate is 70 beats each minute.
The heart’s resting heart rate is 70 beats each minute.
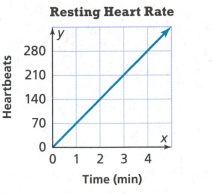
Envision Math Grade 8 Volume 1 Student Edition Solutions Chapter 2 Analyze And Solve Linear Equations Exercise 2.7 Page 133 Exercise 7 Answer
We can use two points from the graph which are (3, 0.75) and (4, 1)
\(m=\frac{y_2-y_1}{x_2-x_1}\) \(m=\frac{1-0.75}{4-3}\)=\(\frac{0.25}{1}\)
=\(\frac{1}{4}\)
The slope of the line is \(\frac{1}{4}\)
The equation of the given line is equivalent to y = mx
Hence, the equation of the line is y = \(\frac{1}{4}\)x.
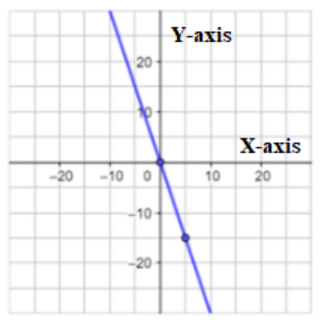
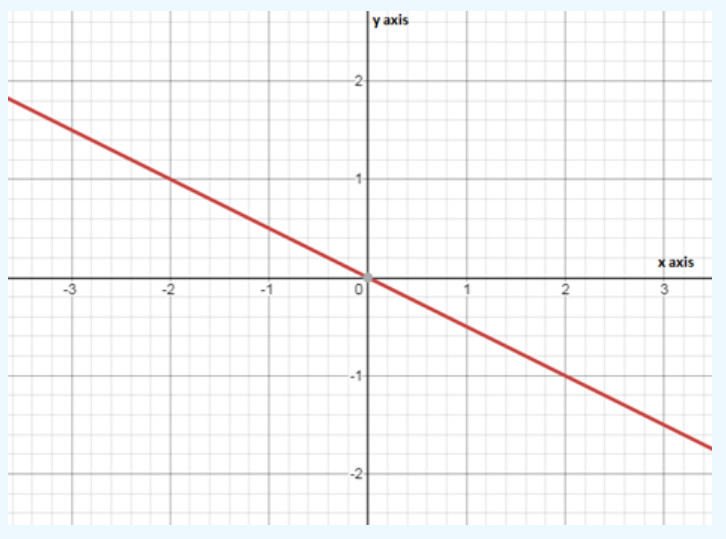
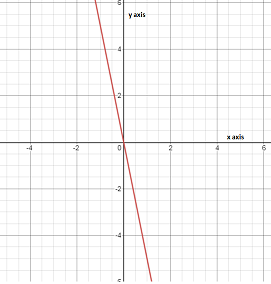
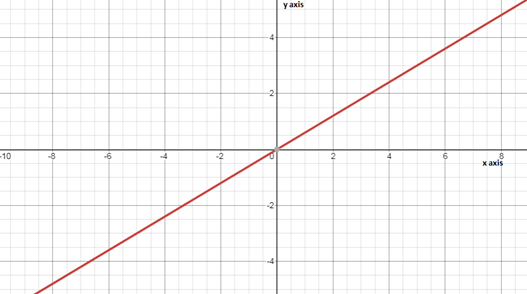
Page 133 Exercise 8 Answer
Given
y = −x
Since we have minus sign before the x−that means that our line will be decreasing and the line that he drew is increasing.
He forgot to reflect given line across x−axis
The right graph is
No, the graph is wrong.
The correct graph is
Envision Math 8th Grade Exercise 2.7 Step-By-Step Linear Equation Solutions
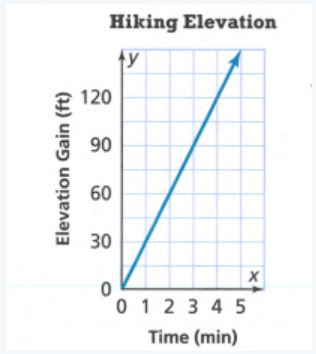
Envision Math Grade 8 Volume 1 Student Edition Solutions Chapter 2 Analyze And Solve Linear Equations Exercise 2.7 Page 133 Exercise 9 Answer
Given
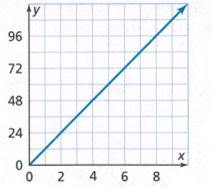
We can use two points from the graph which are (2,24) and (4,48)
\(m=\frac{y_2-y_1}{x_2-x_1}\)
=\(\frac{24}{2}\)
= 12
The slope of the line is 12.
Given
If an equation is equivalent to y = mx then the equation represents a proportional relationship.
The graph of a proportional relationship always goes through the point(0,0) and it will always be a straight line
The graph of a proportional relationship always goes through the point(0,0) and it will always be a straight line.
Envision Math Grade 8 Volume 1 Student Edition Solutions Chapter 2 Analyze And Solve Linear Equations Exercise 2.7 Page 134 Exercise 10 Answer
Given
y = −5x
We are going to use the points which are x = 0 and x = −1
y = −5x
y = −5(0) = 0
y = −5(−1) = 5
The two points are(0,0) and (−1,5).
To graph the line is
Page 134 Exercise 11 Answer
Given
\(y=\frac{3}{5} x\)We are going to use the points which are x = 0 and x = -5
\(y=\frac{3}{5} x\) \(y=\frac{3}{5}(0)\)= 0
\(y=\frac{3}{5}(-5)\)= -3
The two points are (0,0) and (-5, -3).
To graph the line is
How To Solve Exercise 2.7 Linear Equations In Envision Math Grade 8
Envision Math Grade 8 Volume 1 Student Edition Solutions Chapter 2 Analyze And Solve Linear Equations Exercise 2.7 Page 134 Exercise 12 Answer
If they are giving out a 70% off the price of the ticket that simply means that we pay 30%of the original amount.
So the equation is y = 0.3x.
Hence, the equation of the given situation is y = 0.3x
Given
y = 0.3x From the part (a)
We are going to find will have x = 0 and x = 5.
y = 0.3x
y = 0.3(0)
= 0
y = 0.3(5)
= 1.5
The two points are (0,0) and (5,1.5).
Now as we know the line can only be in the quadrant I because the price of the ticket cannot be negative.
The price of the ticket cannot be negative
Envision Math Grade 8 Exercise 2.7 Practice Problems
Page 134 Exercise 13 Answer
Given
We can use two points from the graph which are (2,94) and (4,188)

The equation of the given line is equivalent to y = mx
The equation of the line is y = 47x.