
Cengage Financial Algebra 1st Edition Chapter 5 Exercise 5.2 Automobile Ownership
Page 225 Problem 1 Answer
Given; Maxine compiled a list of these car prices: 7,500,6,500,5,750,4,900,6,250, and 4,200.
To find; Find the mean of the prices.
Maxine should start by finding the mean or arithmetic average of the five prices. The mean is often called the average.
mean=7,500+6,500+5,750,+4,900+6,250+4,200/6
=35100/6
=5850
Hence the mean price of the car is 5850
Page 226 Problem 2 Answer
Given: price of the car 1,200,1,650,1,500,2,000,1,400,1,850,and1,600.
To find: Find the mean and median of the following prices for a used car extended warranty:
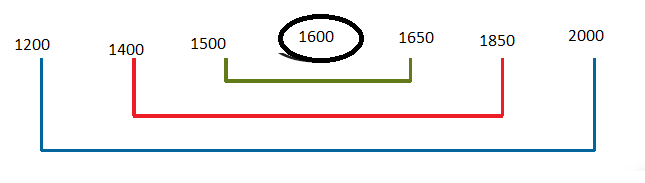
here we will first find the mean of the price
1,200+1,650+1,500+2,000+1,400+1,850+1,600./7
=11200/7
=1600
Hence the mean is found to be 1600
Now in next step we will arrange the given price in ascending order to get the median
1200 −1450−1500−1600−1650−1850−2000
Read and Learn More Cengage Financial Algebra 1st Edition Answers
from here we can see that the middel of the term is 1600
so it is given meadian 1600
Here we acknowledge that both mean and meadian are 1600 so the given data is skewed
Cengage Financial Algebra Chapter 5.2 Automobile Ownership Guide
Cengage Financial Algebra 1st Edition Chapter 5 Exercise 5.2 Automobile Ownership Page 226 Problem 3 Answer
Given ;
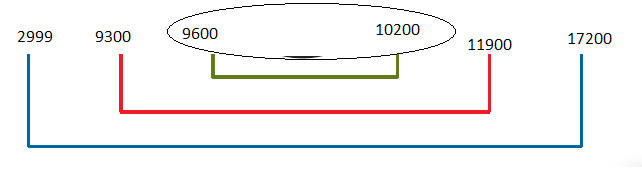
To find ; Find the median
Put the numbers in ascending order. Then, pair the numbers.
Since there is an even number of scores, there is no number left alone in the middle.
Circle the last two numbers that were paired.
find the mean of the two innermost circled numbers. 9600+10200/2
=19800/2
=9900
Hence the median of the price of the car is found to be 9900
Page 226 Problem 4 Answer
Given ; 6,700,, 5,800 , 9,100,8,650,7,700,and7,800.
To find: Find the range of the used car prices
The range of a data set is a measure that shows dispersion (how spread out the data are).
The range is the difference between the greatest and least numbers in the data.
The greatest price is 9100 and the least is 5800.
The range is the difference between these two prices.
9100−5800=3300
Therefore, the range is 3300
Hence the range of the car price is foudn to be 3300
Cengage Financial Algebra 1st Edition Chapter 5 Exercise 5.2 Automobile Ownership Page 227 Problem 5 Answer
Given; the quartiles for the tire pressures of cars at an auto clinic.
15,17,21,25,31,32,32,32,34
To find ; What percent of the numbers in a data set are aboveQ3
The numbers are in ascending order.
Q1 is the fi rst quartile or lower quartile, and 25 % of the numbers in the data set are at or below Q1.
Q2is the second quartile. Half the numbers are below Q2, and half are above, so Q2 is equal to the median.
Q3 is the third quartile, or upper quartile, and 75 % of the numbers are at or below Q3.
Q4 is the maximum value in the data set because 100 % of the numbers are at or below that number.
first find Q2.
Because Q2 equals the median,Q2=31.
For Q1, find the median of the numbers below the median, which are 15,17,21,and25.
The median of these numbers is Q1=19.
17+21/2
=19
For Q3, find the median of the numbers in the data set that are above the median, which are 32,32,32,34. The two middle numbers are 32,
so Q3=32
Now The quartile values are
Q1=19,Q2=31, Q3=32 ,Q4=34. and from the given data we can see that above 32 is only one data that is 34
15,17,21,25,31,32,32,32,34
so the percentage will be 25 %
Hence we have found the percent of the numbers in a data set are above Q3 is 25 %
Solutions For Exercise 5.2 Financial Algebra 1st Edition
Cengage Financial Algebra 1st Edition Chapter 5 Exercise 5.2 Automobile Ownership Page 228 Problem 6 Answer
Given ; $6,700,$5,800,$9,100,$8,650,$7,700, and $7,800.
To find; Find the interquartile range for the data is the fi rst quartile or lower quartile, and 25 % of the numbers in the data set are at or below Q1.

Q2 is the second quartile. Half the numbers are below Q2,and half are above, so Q2 is equal to the median.
Q3 is the third quartile, or upper quartile, and75 % of the numbers are at or below Q3.
Q4 is the maximum value in the data set because 100 % of the numbers are at or below that number.
$6,700,$5,800,$9,100,$8,650,$7,700, and $7,800.
Arrange in ascending order 5800 , 6700 , 7700 , 7800 , 8650 ,9100 ,
7,700+7,800/2
=7,750
Q2=7750
Q1=5800+6700/2
=6250
Now Q3
=8650+9100/2
=8875
The difference Q3−Q1 is the interquartile range (IQR).
The interquartile range gives the range of the middle 50 % of the numbers.
A small interquartile range means that the middle 50 % of the numbers are clustered together.
A large interquartile range means that the middle50 % of the numbers are more spread out.
To find the interquartile range, subtract. The interquartile range is Q3−Q1
=8875−6250
=2625
Hence we have found the interquartile range of the data is Q3−Q1=2625
Cengage Financial Algebra 1st Edition Chapter 5 Exercise 5.2 Automobile Ownership Page 22 Problem 7 Answer
Given; The store that charged 545 for a tire had a sale and lowered its price to399.
To find: Is the new price an upper outlier?
The interquartile range is used to identify outliers.Outliers may occur on the lower or upper end of the data set.
The numbers are in ascending order. 45,88,109,129,146,189,202,218,and 399(due to sale )
The median, Q2,is146
Q1=88+109/2
=98.5
Q3=202+218/2
=210
Use Q1−1.5(IQR) to compute the boundary for lower outliers
IQR=210−98.5=111.5
Any number below −68.75 is an outlier. There are no lower outliers.
98.5−1.5(111.5)=−68.75
Use Q3+1.5(IQR) to compute the boundary for upper outliers.
210+1.5(111.5)=377.25
Any number above 377.25 is an upper outlier, so399 is an upper outlier.
Hence we found that 399 is teh upper outlier and we alsofoudn that the new number ie, 399 is also a upper outlier
Page 228 Problem 8 Answer
Given ; 15,17,21,25,31,32,32,32,34
To find: Find the mode of the tire pressures
The mode is the most-occurring item and is often used with non-numerical variables, such as the winning tire pressure from the given data we can see that the most ofteen occuring data is 32
so the mode of the given data is 32
Hence the mode of the given data15,17,21,25,31,32,32,32,34 is 32
Cengage Financial Algebra 1st Edition Chapter 5 Exercise 5.2 Automobile Ownership Page 229 Problem 9 Answer
In the above question the have asked to answer
Statistical thinking will one day be as necessary for efficient citizenship as the ability to read and write.
Answer:- Reading and writing is currently a necessity to be able to participate in the current community.
However, Statistics will become equally important in the near future, because we come across data and Statistics on a daily basis (which will most likely become even worse in the near future) and thus we will require basic Statistical thinking to be able to understand this information.
In the near future, Statistical thinking will become equally important to reading and writing.
Page 229 Problem 10 Answer
Given 7,12,1,7,6,5,11
We need to find mean, median, mode, and range
Given 7,12,1,7,6,5,11
Mean:- Add all the values and divide by 7.
7+12+1+7+6+5+11/7
=49/7
=7
Median Arrange the values in ascending or descending order and identify the middle value.
1,5,6,7,7,11,12
Median=7.
Mode:- Mode is the value that appears more no. of times than any other value in the list. In this case only the value 7 appears twice.
mode = 7
Range:- The range is the difference between the greatest and least numbers in the data.
Range =12−1
=11
Therefore the mean median mode and range are 7,7,7 and 11 respectively.
Cengage Financial Algebra 1st Edition Chapter 5 Exercise 5.2 Automobile Ownership Page 229 Problem 11 Answer
Given 85,105,95,90,115
We need to find mean, median, mode, and range
Given 85,105,95,90,115
Mean:- Add all the values and divide by
85+105+95+90+115/5
=490/5
=98
Median:- Arrange the values in ascending or descending order and identify the middle value.
85,90,95,105,115
Median=95
Mode:-Mode is the value that appears more no. of times than any other value in the list. In this case no value appears more than once. So there is no mode.
Range:-The range is the difference between the greatest and least numbers in the data.
Range =115−85
=30
Therefore the mean median mode and range are 98, 95, no mode and 11 respectively
Page 229 Problem 12 Answer
Given 10,14,16,16,8,9,11,12,3
We need to find mean, median, mode, and range
Given 10,14,16,16,8,9,11,12,3
Mean Add all the values and divide by 9.
10+14+16+16+8+9+11+12+3/9
=99/9
=11
Median Arrange the values in ascending or descending order and identify the middle value.
3,8,9,10,11,12,14,16,16
Median=11
Mode:- Mode is the value that appears more no. of times than any other value in the list. In this case only the value 16 appears twice.
Range:- The range is the difference between the greatest and least numbers in the data.
Range =16−3
=13
Therefore the mean median mode and range are 11, 11, 16 and 13 respectively
Chapter 5 Exercise 5.2 Automobile Ownership Walkthrough Cengage
Cengage Financial Algebra 1st Edition Chapter 5 Exercise 5.2 Automobile Ownership Page 229 Problem 13 Answer
Given 10, 8, 7, 5, 9, 10, 7
We need to find mean, median, mode, and range
Given
Mean:- Add all the values and divide by 7
10 + 8 + 7 + 5 + 9 + 10 + 7/7=56/7
= 8
Median:- Arrange the values in ascending or descending order and identify the middle value.
Mode:- Mode is the value that appears more no. of times than any other value in the list. In this case both appear twice.
10.8.7.5.9, 10.7
5, 7, 7, 8, 9, 10, 10
median = 8
7 and 10
Range:- The range is the difference between the greatest and least numbers in the data.
Range = 10 − 5
= 5
Therefore the mean median mode and range are 8, 8, 7and10, and 5 respectively.
Page 225 Problem 14 Answer
Given 45,50,40,35,75
We need to find mean, median, mode, and range
Given 45,50,40,35,75
Mean:- Add all the values and divide by 5
45+50+40+35+75/7
=245/5
=49
Median Arrange the values in ascending or descending order and identify the middle value.
35,40,45,50,75
Median=45
Mode:- Mode is the value that appears more no. of times than any other value in the list. In this case no value appears more than once. So there is no mode.
Range:- The range is the difference between the greatest and least numbers in the data.
Range =75−35
=40
Therefore the mean median mode and range are 49, 45, no mode and 40 respectively
Cengage Financial Algebra 1st Edition Chapter 5 Exercise 5.2 Automobile Ownership Page 229 Problem 15 Answer
Given 15,11,11,16,16,9
We need to find mean, median, mode, and range
Given:-15,11,11,16,16,9
Mean:- Add all the values and divide by 6
15+11+11+16+16+9/6
=78/6
=13
Median:- Arrange the values in ascending or descending order and identify the middle value.
9,11,11,15,16,16
median = 13
Mode:- Mode is the value that appears more no. of times than any other value in the list. In this case both 11and16 appear twice.
This data set is bi-modal.
Range:- The range is the difference between the greatest and least numbers in the data.
Range =16−9
=7
Therefore the mean median mode and range are 13, 13, 11and16, and 7 respectively
Page 229 Problem 16 Answer
Given data:- $24,600,$19,000,$33,000,$15,000,$20,000
We need to find mean.
Given data values: $24, 600, $19, 000, $33, 000, $15, 000, $20, 000
We note that there are 5 data values.
The mean is the sum of all values divided by the number of values:
xˉ = =∑n xi/n
i=1
=24600 + 19000 + 33000 + 15000 + 20000/5
=111600/5 ≈ 22320
Thus the mean price is $22, 320
Therefore the mean price is $22, 320.
Cengage Financial Algebra 1st Edition Chapter 5 Exercise 5.2 Automobile Ownership Page 229 Problem 17 Answer
In the above question they have given $110,$145,$130,$160,$400
We need to find mean.
Given data values:
$110, $145, $130, $160, $400
We note that there are 5 data values.
The mean is the sum of all values divided by the number of values:
xˉ =∑n xi/n
i=1
=110 + 145 + 130 + 160 + 400/5
=945/5
= 189
Thus the mean price is $189.
Therefore the mean price is $189.
Page 229 Problem 18 Answer
In the above question they have given
$110,$145,$130,$160,$400
We need to find median.
Given data values:
$110, $145, $130, $160, $400
Order the data values from smallest to largest:
$110, $130, $145, $160, $400
The median is the middle value of the sorted data set Since there are 5 data values, the median is the third data value in the sorted data set:
M = $145
Thus the median price is $145.
Therefore the median price is $145.
Cengage Financial Algebra 1st Edition Chapter 5 Exercise 5.2 Automobile Ownership Page 229 Problem 19 Answer
Given data is $110,$145,$130,$160,$400
We need to find data outliner.
$400 is extremely different from others′ salary.
Other values are between 100 and 200 .
Therefore Stephanie′s salary is an outlier in the data set
Page 229 Problem 20 Answer
Given $110,$145,$130,$160,$400
We need to find number do you think is better representative of the data, the mean or the median
In part (c), we concluded that there was an outlier present among the salaries.
The mean is strongly influenced by the outlier, because it takes the sum of all data values (including the outlier) before dividing by the number of outliers.
However, the median is not influenced by the outlier as it is just the middle value of the sorted data set and thus the median is better representative as it is not influenced by the outlier.
I think the median is not influenced by the outlier.
Cengage Financial Algebra 1st Edition Chapter 5 Exercise 5.2 Automobile Ownership Page 229 Problem 21 Answer
Given $110,$145,$130,$160,$400
We need to given a explanation for part d
In part (c), we concluded that there was an outlier present among the salaries.
The mean is strongly influenced by the outlier, because it takes the sum of all data values (including the outlier) before dividing by the number of outliers.
However, the median is not influenced by the outlier as it is just the middle value of the sorted data set and thus the median is better representative as it is not influenced by the outlier.
Median is not influenced by the outlier, while the mean is strongly influenced by the outlier.
Page 229 Exercise 1 Answer
In the above question they have given $59.00,$71.00,$50.00
We need to find mean.
Given data values: $59.00, $71.00, $50.00
We note that there are 3 data values.
The mean is the sum of all values divided by the number of values:
xˉ =∑n xi/n
i=1
=59.00 + 71.00 + 50.00/3
=180.00/3
= 60.00
Thus the mean price is $60.00.
Therefore the mean price is $60.00.
Cengage Financial Algebra Automobile Ownership Exercise 5.2 Solutions
Cengage Financial Algebra 1st Edition Chapter 5 Exercise 5.2 Automobile Ownership Page 229 Exercise 2 Answer
In the above question they have given $59.00, $71.00, $50.00
We need find total cost .
Given data values: $59.00, $71.00, $50.00
The total cost of all three ads is the sum of the cost of each ad.
Total cost = Sum of cost of each ad
= 59.00 + 71.00 + 50.00
= 180.00
Thus the total cost of running all three ads would then be $180.00.
Therefore the total cost of running all three ads would then be $180.00.
Page 229 Exercise 3 Answer
Given: Lake Success Shop saver$59.00
Glen Head Buyer $71.00
Floral Park Money saver$50.00
To Find: The objective is to Find :
If each of the three newspapers used the mean price as their ad price, what would it cost Rosanne to run ads in all three papers
We will use the value of mean Which is find in a part.
Given data values are:
Now, from part(a):
The value of mean is 60.
Now, If she had to pay mean price to each ad then also it would cost$180.
Total Price = Mean price ×3
=60×3
=$180
Hence, the cost Rosanne to run ads in all three papers is $180
Cengage Financial Algebra 1st Edition Chapter 5 Exercise 5.2 Automobile Ownership Page 229 Exercise 4 Answer
Given: Lake Success Shop saver$59.00
Glen Head Buyer$71.00
Floral Park Money saver$50.00
To Find: The objective is to find the range of these ad prices.
We will use the definition of Range
Given data values are:
$59.00,$71.00.$50.00
Now, The range is the difference between the greatest and least numbers in the data.
So, Range=71−50
=$21
Hence, the range of the given ad prices is $21
Page 229 Exercise 5 Answer
Given: We are given Dan’s grade91,82,90,89
To Find: The objective is to find the grade does he need on his final exam to have a 90 average.
We will use the definition of mean.
We have Dan’s Grade.
91,82,90,89
Now, Firstly we let the missing grade be x
So, we note that there are Five data values.
91,82,90,89,x
Now, by the definition of mean. The mean is the sum of all values divided by the number of values:
xˉ=∑n xi/n
i=1
=91+82+90+89+x/5
=352+x/5
Now, we want mean to be 90
So, 352+x/5
=90
Now, we multiply each side by 5
So, we get:352+x=450
Finally subtract 352 from each side we get:x=98
Hence, 98 grade Dan’s need on his final exam to have a 90 average.
Cengage Financial Algebra 1st Edition Chapter 5 Exercise 5.2 Automobile Ownership Page 229 Exercise 6 Answer
Given: We are given:Elliot Savings from an entire year=$6,000
To Find: The objective is to find savings per week if he plans to work the entire year with only two weeks off.
We will use the formula: Savings per week = Savings per year
Number of (work) weeks
Now, we have
Elliot Savings from an entire year=$6,000
Now, As we know that there are52 weeks in a year and since we take 2 weeks off, there are 52−2=50 weeks that we plan to work.
Now, The amount we need to save each week is then the total savings from an entire year divided by the number of weeks.
So, we use the Formula Savings per week
= Savings per year/ Number of (work) weeks
=$6,000/50
=$120
Hence, Elliot should plan to save$120 each week if he plans to work the entire year with only two weeks off.
Page 230 Exercise 7 Answer
Given: We are given the mean of five numbers is 16.
Four numbers are 13,20,11 and 21
To Find: The objective is to find the fifth number.
We will use the definition and formula of mean.
We have the four numbers.
13,20,11 and 21
Now, Firstly we let the missing fifth number be x
So, we note that there are Five data values.
13,20,11,21,x
Now, by the definition of mean.
The mean is the sum of all values divided by the number of values:
xˉ=∑n xi/n
i=1
=13+20+11+21+x/5
=65+x/5
Now, we want mean to be16:
65+x/5
=16
Now, we multiply each side by5
so, we get:
65+x=80
Finally subtract 65
from each side, so we get:x=15
Therefore, the fifth number is 15
Hence, the fifth number is15
Cengage Financial Algebra 1st Edition Chapter 5 Exercise 5.2 Automobile Ownership Page 230 Exercise 8 Answer
Given: We are given: The quartiles of a data set are:Q1=50,
Q2=72,
Q3=110, and Q4=140
To Find: The objective is to Find the interquartile range.
We will use the definition of interquartile range.
We have,
The quartiles of a data set are:
Q1=50 ,Q2=72,Q3=110, and Q4=140
By using the definition of interquartile range:
The interquartile range is the difference between the first quartileQ1 and the third quartileQ3:
IQR=Q3−Q1
=110−50
=60
Hence, the interquartile range is IQR=60
Page 230 Exercise 9 Answer
Given: We are given $450,$100,$180,$600,$300,$350,$300, and $400.
To Find: The objective is to Find the four quartiles.
We will use the Definitions.
We have the dataset.
$450,$100,$180,$600,$300,$350,$300, and $400.
Now, Firstly we sort the Dataset:
$100,$180,$300,$300,$350,$400,$450,$600
The first quartile is then the average between the second and third element in the sorted dataset
Q1=$180+$300/2
=$240
The second quartile is the median and is the average of the two middle elements in the sorted dataset.
Q2=$300+$350/2
=$325
The third quartile is the average between the sixth and seventh element in the sorted dataset.
Q3=$400+$450/2
=$425
The forth quartile is the last element in the sorted dataset.
Q4=$600
Hence, the four quartiles are $240,$325,$425,$600
How To Solve Cengage Financial Algebra Chapter 5.2 Automobile Ownership
Cengage Financial Algebra 1st Edition Chapter 5 Exercise 5.2 Automobile Ownership Page 230 Exercise 10 Answer
Given: We are given $450,$100,$180,$600,$300,$350,$300, and $400
To Find: The objective is to Find the interquartile range.
We will use the definition of Interquartile range.
We have the data values.
$450,$100,$180,$600,$300,$350,$300, and $400
The first quartile is then the average between the second and third element in the sorted dataset
Q1=$180+$300/2
=$240
The third quartile is the average between the sixth and seventh element in the sorted dataset.
Q3=$400+$450/2
=$425
Now, using the definition of Interquartile range.
The interquartile range is the difference between the third and the first quartile.
IQR=Q3−Q1
IQR=$425−$240
IQR=$185
Hence, the interquartile range for the given data set is$185
Page 230 Exercise 11 Answer
Given: We are given $450,$100,$180,$600,$300,$350,$300, and $400
To Find: The objective is to Find the boundary for the lower outliers. Are there any lower outliersWe will use the definitions.
We have the data values:
$450,$100,$180,$600,$300,$350,$300, and $400 from part (a) and (b) we have:
Q1=$240
Q3=$425
IQR=$185
Now, The boundary for lower outliers is Q1−1.5IQR
∴Q1−1.5IQR=$240−1.5×$185
Q1−1.5IQR=−$37.50
There appear to be no lower outliers, because there are no prices below −$37.50
So, there are no lower outliners.
Hence, the boundary for the lower outliers is −$37.50, and there are no lower outliers
Cengage Financial Algebra 1st Edition Chapter 5 Exercise 5.2 Automobile Ownership Page 230 Exercise 12 Answer
Given: We are given $450,$100,$180,$600,$300,$350,$300, and $400
To Find: The objective is to Find the boundary for the upper outliers. Are there any upper outliers.We will use the definitions.
We have the data values:
$450,$100,$180,$600,$300,$350,$300, and $400
From part (a) and (b) we have:
Q1=$240
Q3=$425
IQR=$185
Now, The boundary for upper outliers is Q3+1.5IQR
Q3+1.5IQR=$425+1.5×$185
=$702.50
There appear to be no upper outliers, because there are no prices that are above $702.50
So, there are no upper outliners
Hence, the boundary for the upper outliers is $702.50, and there are no upper outliers
Page 230 Exercise 13 Answer
Given: We are given the mean of five different numbers which is 50
To Find: The objective is to Create a list of five different numbers whose mean is50
We will use the definition and formula of mean.
Now, An example of such a list is 30,40,50,60,70.
Now, we use the definition of mean.
The mean is then the sum of all elements divided by the number of elements:
30+40+50+60+70/5
=250/5
=50
Hence, the list of five different numbers whose mean is 50 are: 30,40,50,60,70
Cengage Financial Algebra 1st Edition Chapter 5 Exercise 5.2 Automobile Ownership Page 230 Exercise 14 Answer
Given: We are given the median of six different numbers which is 10
To Find: The objective is to Create a list of six different numbers whose median is 10
We will use the definition of median.
Now, An example of such a list is 2,4,9,11,13,15
By using the definition of median
The median is then the average between the two middle elements of the sorted dataset (the given dataset is already sorted):
9+11/2
=20/2
=10
Hence, the list of six different numbers whose median is 10 is:
2,4,9,11,13,15
Page 230 Exercise 15 Answer
Given: We are given the mean and median of five numbers 12
To Find: The objective is to Create a list of five numbers whose mean and median are both12
We will use the definition of mean and median
Now, An example of such a list is 8,10,12,14,16
As we know that the mean is the sum of all elements divided by the number of elements 8+10+12+14+16/5=12
And the median is the middle element in the sorted dataset (the given dataset has already been sorted).
Hence, The list of five numbers whose mean and median are both 12 is:8,10,12,14,16
Practice Problems For Automobile Ownership Exercise 5.2 Cengage
Cengage Financial Algebra 1st Edition Chapter 5 Exercise 5.2 Automobile Ownership Page 230 Exercise 16 Answer
To Find: The objective is to Create a list of numbers whose mean, median, and mode are all 10
We will use the definitions
Let the list of numbers only contain 10:10,10,10,10,10 then the mean, median and mode are all 10.
Hence, The list of numbers whose mean, median, and mode are all 10 is: Let the list of numbers only contain10:10,10,10,10,10
Page 230 Exercise 17 Answer
To Find: The objective is to Create a list of numbers with two upper outliers and one lower outlier.We will use the definitions.
Now, an example of such dataset is: 0,10,10,10,10,10,10,10,10,10,20,20
because its quartiles are all 10, thus the IQR is 0 and the boundary for the upper/lower outliers is then also 10.
Hence, The list of numbers with two upper outliers and one lower outlier is: 0,10,10,10,10,10,10,10,10,10,20,20
Page 230 Exercise 18 Answer
To Define: The objective is to Explain why you cannot find the range of a data set if you are given the four quartiles.We will use the definitions.
This can be explained as: Because you cannot determine the lower boundary of the data based on only the quartiles and you need the lower boundary because the range is the difference between the upper and lower boundary of values.
Hence, Because you cannot determine the lower boundary of the data based on only the quartiles and you need the lower boundary, because the range is the difference between the upper and lower boundary of values.