
Cengage Financial Algebra 1st Edition Chapter 2 Exercise 2.6 Modeling a Business
Page 93 Problem 1 Answer
Given that there is an error when calculating the expense and revenue values
To find how we can improve the error By using basic knowledge
While we are using rounding off values, we can get some minute error in the revenue and expense values.
So, to improve on the error we have to use exact price values instead of the rounding values.
But it is somewhat difficult to calculate with the exact values manually.
Page 94 Problem 2 Answer
Given that E=−3500p+238000
R=−500p2+30000p
To find a,b,c in cellsB11,B12,B13
By using basic calculations
Given that
E=−3500p+238000
R=−500p2+30000p
At breakeven point, The expense equals to revenue
−3500p+238000=−500p2+30000p
−500p2+33500p−238000=0
Read and Learn More Cengage Financial Algebra 1st Edition Answers
This equation is similar to the equation in cellB10
The a,b,c values are the values from the equation −500p2+33500p−238000=0
Cengage Financial Algebra 1st Edition Chapter 2 Exercise 2.6 Modeling A Business Solutions
Cengage Financial Algebra 1st Edition Chapter 2 Exercise 2.6 Modeling a Business Page 95 Problem 3 Answer
Given that Risk comes from not knowing what you’re doing
To find How might the quote apply to what you have learned
By using the own knowledge
If you don’t know what you are doing, then won’t know if you will make a profit or make a loss.
Moreover, you always won’t realize the extent of the possible loss and this could then provide a very large risk.
In practice, you will need to take into account your total expenses to determine the price of your items such that you won’t make any loss.
However, if you fail to do so, then you have a high risk of making a loss, as you didn’t check which prices will result in a profit for your company.
Page 95 Problem 4 Answer
Given that A supplier of school kits has determined that the combined fixed and variable expenses to market and sell G kits is W
To find breakeven point
By finding the price per item
The breakeven point is the price of one item
So, Breakeven point is W/G
Page 95 Problem 5 Answer
Given that A supplier of school kits has determined that the combined fixed and variable expenses to market and sell G kits is W
To find breakeven point
By finding the price per item
The cost per item is the total cost (which is 80%of W ) divided by the number of items (2G).
The price per item is 80%×W
2GTo make breakeven the cost per item should equal the price (revenue) per item.
80%×W/2G
Cengage Financial Algebra 1st Edition Chapter 2 Exercise 2.6 Modeling a Business Page 95 Problem 6 Answer
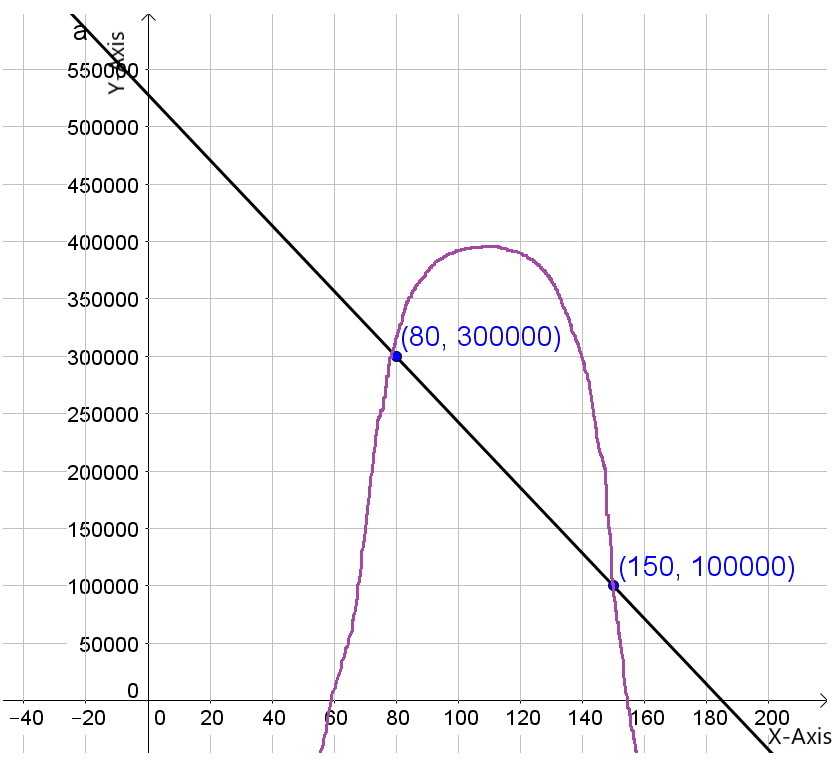
Given that breakeven points are 80,150
To graph using the given data
By using the graph paper
Given that breakeven points are 80,150
At 80 the expense and revenue values are both 300000.
At 150, the expense and revenue values are both 100000.
The graph looks like

The graph is
Page 95 Problem 7 Answer
Given that breakeven points are 170, 350
To graph using the given data
By using the graph paper
Given that breakeven points are 170, 350
At 170 the expense and revenue values are both 2600000.
At 350 the expense and revenue values are both 900000.
The graph looks like
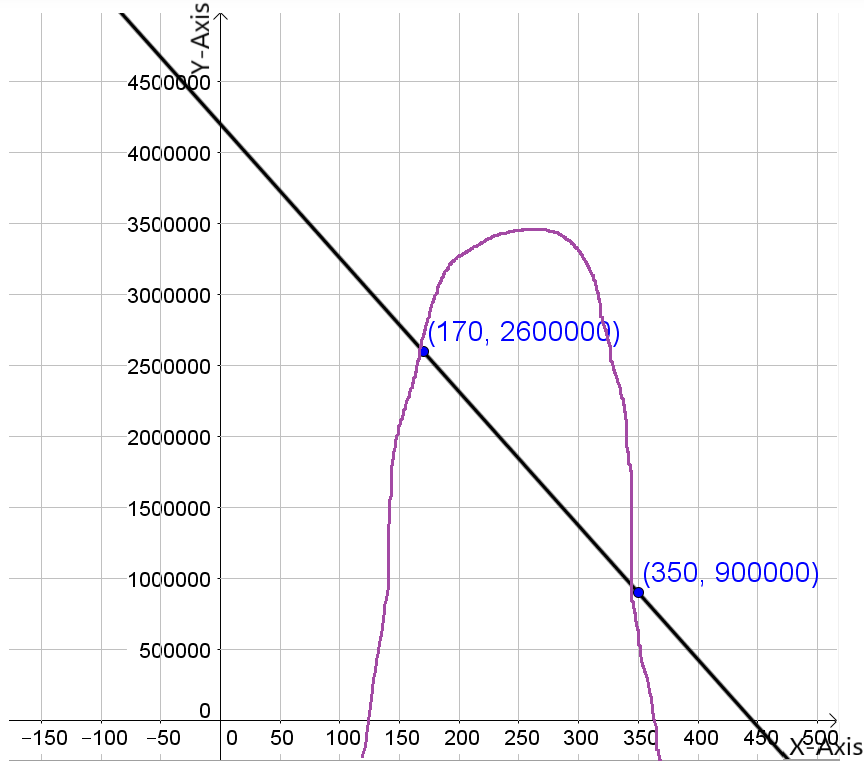
The graph is

Page 95 Problem 8 Answer
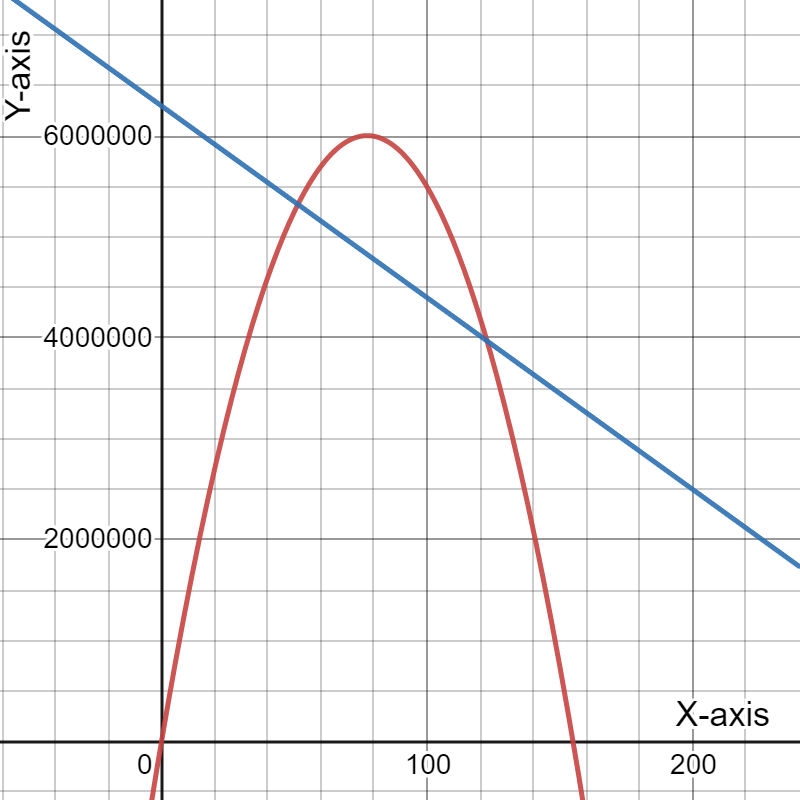
Given that expense function is E=−19,000p+6,300,000 and the revenue function is R=−1,000p2+155,000p
To Graph the expense and revenue functions. Label the maximum and minimum values for each axis. Circle the breakeven points.
By using the graphs
Given that
The expense function is E=−19,000p+6,300,000
The revenue function is R=−1,000p2+155,000p
The graph is
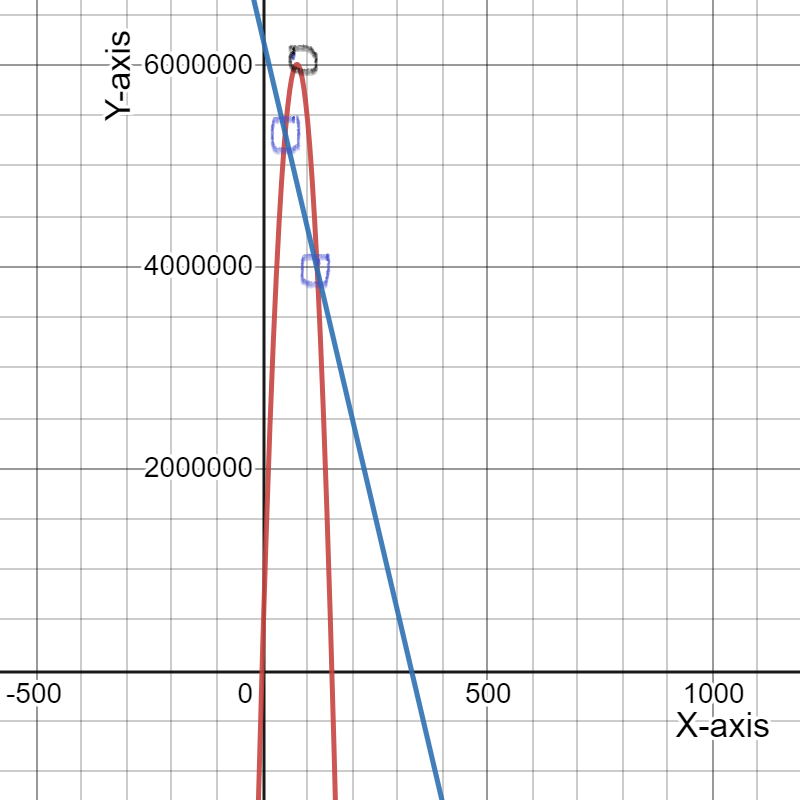
The breakeven points are blue circles and black circle is maximum value
The grap is

The breakeven points are blue circles and black circle is maximum value
Cengage Financial Algebra Chapter 2 Exercise 2.6 Modeling A Business Answers
Cengage Financial Algebra 1st Edition Chapter 2 Exercise 2.6 Modeling a Business Page 95 Problem 9 Answer
Given that: The expense function is E=−19,000p+6,300,000 And The revenue function is R=−1,000p2+155,000p
To find the prices at the breakeven points.
By using basic calculations
Given that
The expense function is E=−19,000p+6,300,000
The revenue function is R=−1,000p2+155,000p
At breakpoints, The revenue is equal to expense
−19,000p+6,300,000=−1,000p2+155,000p
1,000p2−174,000p+6,300,000=0
p=−174,000±√174,0002−4⋅1,000⋅6,300,000/2⋅1,000
=51.38 or 122.62
The graph is

The prices at breakeven points are 51.38 or 122.62
The graph is
Page 95 Problem 10 Answer
Given that:
The expense function is
E=−19,000p+6,300,000
The revenue function is
R=−1,000p2+155,000p
To find the revenue and expense amounts for each of the breakeven points.
By using basic calculations
From 7(b)
Breakeven points are 51.38, 122.62
At p=51.38,
The expense is
E=−19,000⋅51.38+6,300,000
=5,323,780
So, the revenue=5,323,780
At p=122.62
The expense is
E=−19,000⋅122.62+6,300,000
=3,970,220
So, the revenue =3,970,220
At p=51.38, The expense and revenue is 5,323,780
At p=122.62, The expense and revenue is 3,970,220
Page 96 Exercise 1 Answer
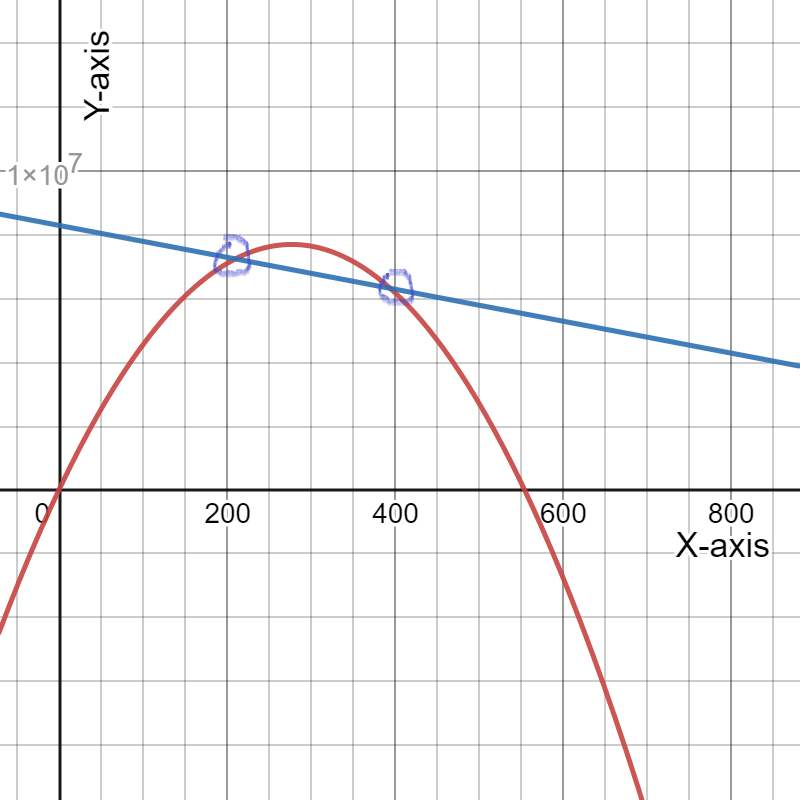
Given that expense function is E=−5,000p+8,300,000 the revenue function is R=−100p{2}+55,500p
To Graph the expense and revenue functions. Circle the breakeven points.
By using the graphs
Given that expense function is
E=−5,000p+8,300,000 the revenue function is
R=−100p{2}+55,500p
Graph of the expense and revenue functions is

The graph is
Page 96 Exercise 2 Answer
Given that
expense function is
E=−5,000p+8,300,000 the revenue function is R=−100p{2} +55,500p
To find the prices at the breakeven points.
By using basic calculations
Given that expense function is
E=−5,000p+8,300,000 the revenue function is R=−100p{2}+55,500p
At breakeven point, The revenue is equal to expense
−5,000p+8,300,000=−100p2+55,500p
100p2−60,500p+8,300,000=0
p=60,500±√60,5002−4⋅100⋅8,300,000/2⋅100
=210.27 or 394.73
The breakeven points are 210.3, 394.7
Solutions For Cengage Financial Algebra Chapter 2 Exercise 2.6 Modeling A Business
Cengage Financial Algebra 1st Edition Chapter 2 Exercise 2.6 Modeling a Business Page 96 Exercise 3 Answer
Given that expense function is
E=−5,000p+8,300,000 the revenue function is R=−100p{2}+55,500p
To find the revenue and expense amounts for each of the breakeven points
By using the graphs
Given that expense function is
E=−5,000p+8,300,000 the revenue function is R=−100p{2}+55,500p
From 8(b), The breakeven points are 210.27, 394.73
We know that At breakeven point, The revenue is equal to expense
At p=210.27,
The expense is E=−5,000⋅210.27+8,300,000
=7,248,646.67
The revenue is 7,248,646.67
At p=394.73
The expense is E=−5,000⋅394.73+8,300,000 =6,326,353.33
The revenue is 6,326,353.33
At p=210.27, The expense and revenue is 7,248,646.27
At p=394.73, The expense and revenue is 6,326,353.33
Page 96 Exercise 4 Answer
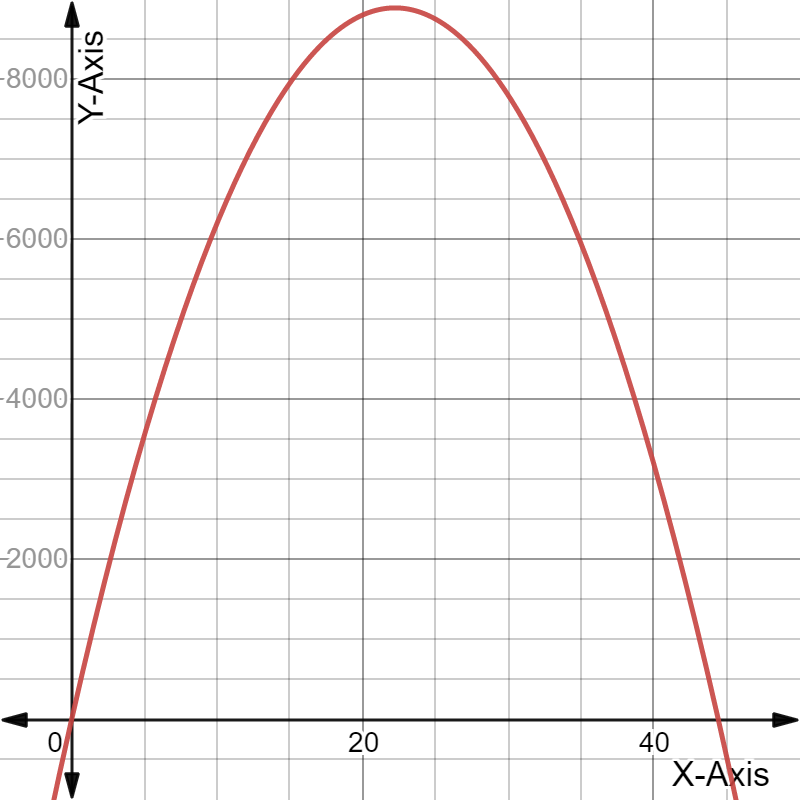
Given: The expense function isE=−200p+10,000 and the revenue function isR=−18p{2}+800p.
To find The price at which maximum revenue is reached and the maximum revenue.
For a parabola, the greatest revenue price is found along the axis of symmetry.
For a parabolay=ax{2}+b+c, the greatest revenue price is found along the axis of symmetryx=−b/2a.
We havea=−32,
b=1200 and
c=0 in this situation because ofR=−18p{2}+800p.
p=−b/2a
=−800
2(−18)
=22.22.
As a result, the price at which the greatest revenue is achieved at$22.22.
Calculate the revenue that corresponds to the price of$22.22.
R=−18p2+800p
=−18(22.22)2+800(22.22)
≈$8888.89.
As a result, the maximum revenue is$8888.89.
The graph can be draw

∴ The maximum revenue of $ 8888.89 occurs at a price of $22.22.
Page 96 Exercise 5 Answer
Given: The expense and revenue functions exist.To do: Graph the given.For doing so, we will plot a graph.
The cost function is represented by a straight blue line, whereas the revenue function is represented by a red curve.
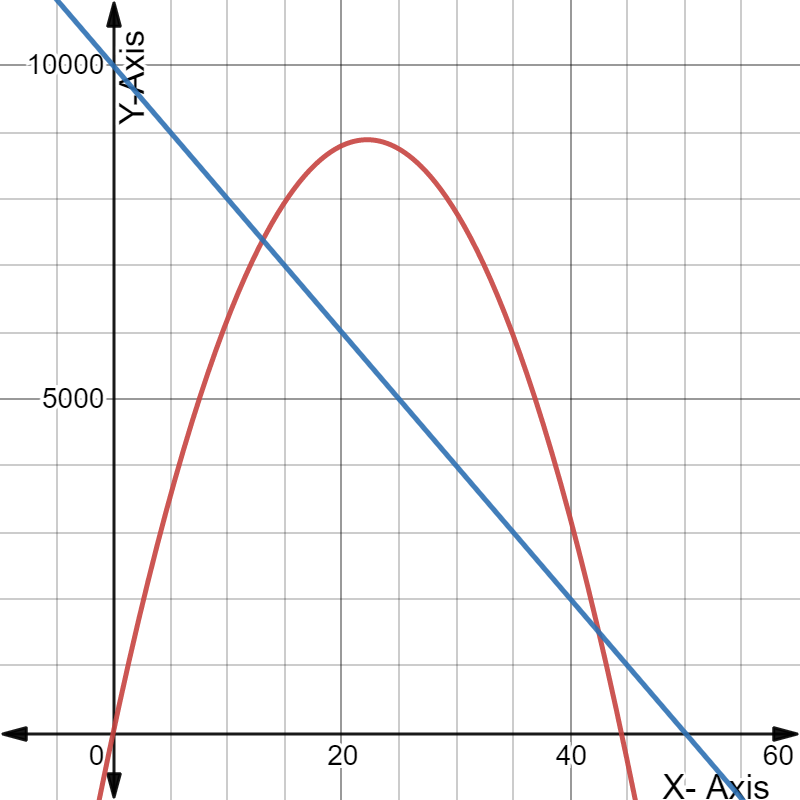
The cost function is represented by a straight blue line, whereas the revenue function is represented by a red curve.

Cengage Financial Algebra 1st Edition Chapter 2 Exercise 2.6 Modeling a Business Page 96 Exercise 6 Answer
Given: The expense function is E=−200p+10000 and the revenue function isR=−18p{2}+800p.
To find The prices at the breakeven points.For doing so, we will refer to the fact that at the breakeven point, the revenue and expenditure functions are equal.
At the breakeven point, the revenue and expenditure functions are equal.
−200p+10,000=−18p{2}+800p
⇒18p{2}
−1,000p+10,000=0.
Using the quadratic formula, find the solution.
p=1,000±√1,0002−4⋅18⋅10,000 /2⋅18
=13.08 or 42.48
The prices at the breakeven points are$13.08,$42.48.
Page 96 Exercise 7 Answer
Given: Breakeven prices are$13.08,$42.48.
To find The revenue and expense amount for each of the breakeven points.For doing so, we will refer to the fact that at the breakeven point, the revenue equals the expense.
We know that the breakeven prices are$13.08,$42.48.
Expenses corresponding these breakeven prices areE=−200⋅13.08+10,000=7,384.17
E=−200⋅42.48+10,000
=1,504.72.
At the breakeven point, the revenue equals the expense. SoR=7,384.17,
R=1,504.72.
∴Our required amount of revenue and expenses are$7,384.17,$1,504.72.
Cengage Financial Algebra Exercise 2.6 Modeling A Business Key
Cengage Financial Algebra 1st Edition Chapter 2 Exercise 2.6 Modeling a Business Page 96 Exercise 8 Answer
Given: The expenses functionE=−300p+13000
and the revenue function isR=−32p{2}+1,200p.
To find: The price at which maximum revenue is reached and the maximum revenue.For a parabola, the greatest revenue price is found along the axis of symmetry.
For a parabolay=ax{2}+b+c, the greatest revenue price is found along the axis of symmetryx=−b/2a.
We havea=−32,
b=1200 and
c=0 in this situation because ofR=−32p{2}+1,200p.
p=−b/2a
=−1200
2(−32)
=18.75.
As a result, the price at which the greatest revenue is achieved at$18.75.
A graph can be plotted as
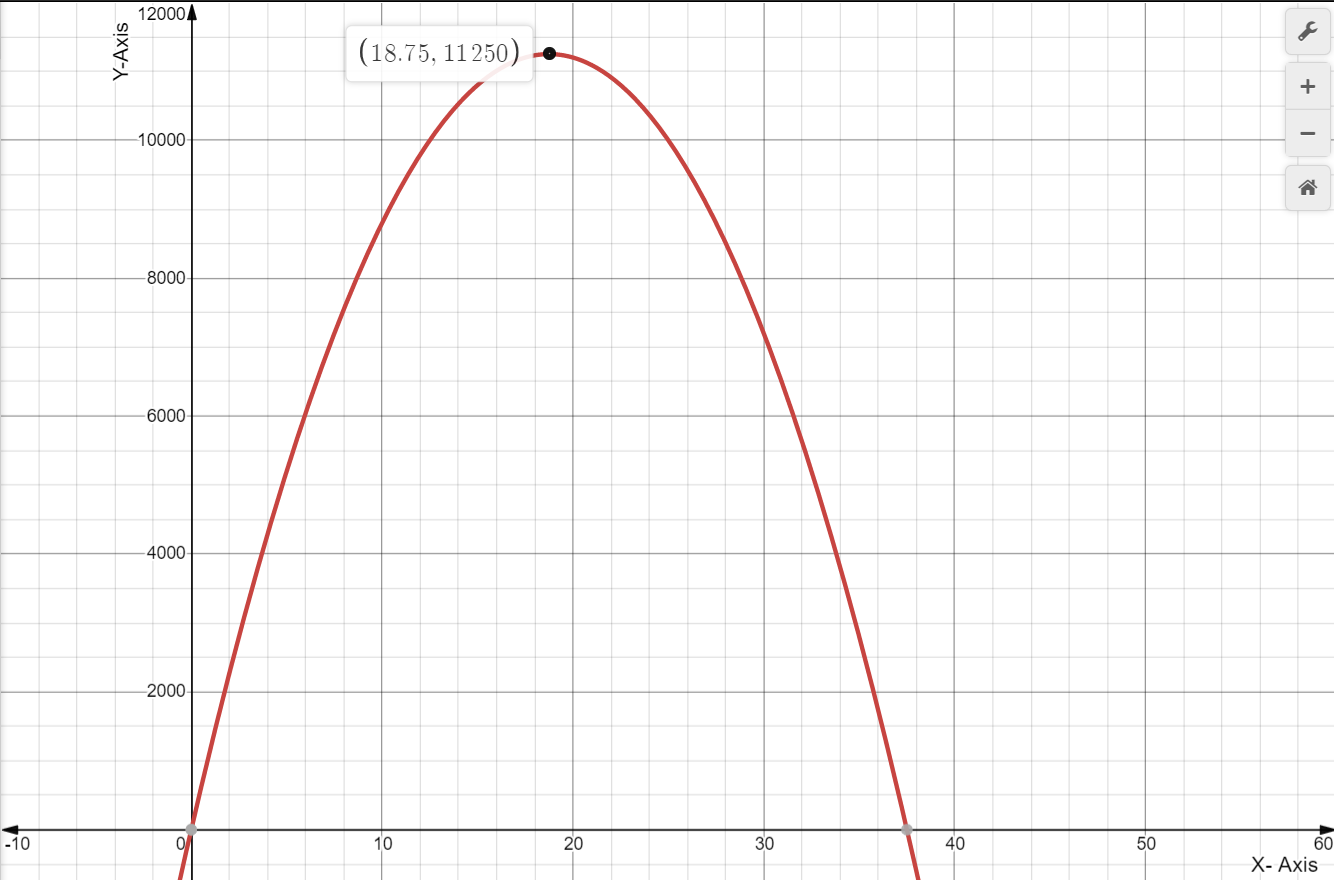
∴The maximum revenue can be achieved at a price of$18.75.
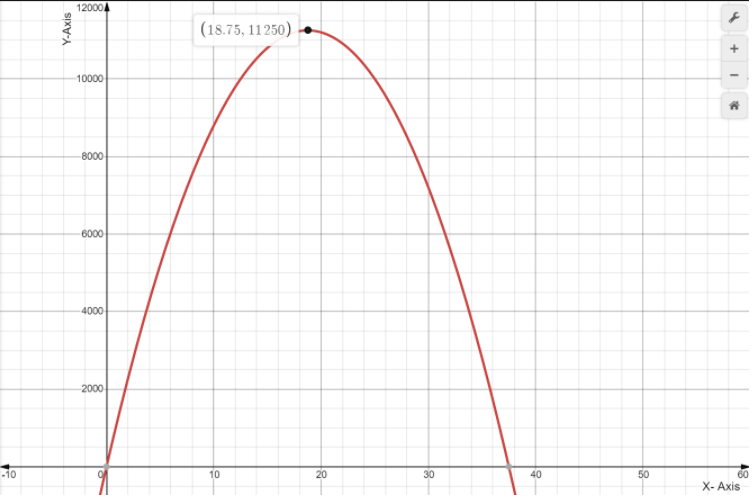
Page 96 Exercise 9 Answer
Given: The maximum revenue can be achieved at a price of$18.75.
To find The maximum revenue.For doing so we will determine the revenue at a given price using the function provided.
Calculate the revenue that corresponds to the price of$18.75.
R=−18p2+800p
=−18(18.75)2+800(18.75)
≈$11,250.
As a result, the maximum revenue is$11,250.
The maximum revenue is$11,250.
Cengage Financial Algebra 1st Edition Chapter 2 Exercise 2.6 Modeling a Business Page 96 Exercise 10 Answer
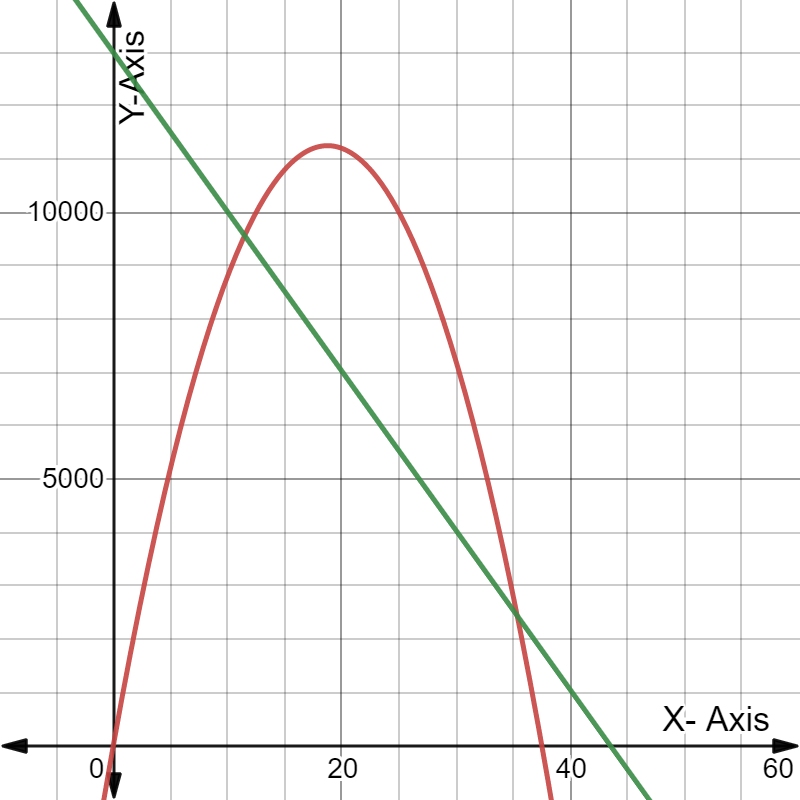
Given: The expense and revenue functions exist.To do: Graph the given.For doing so, we will plot a graph.
The cost function is represented by a straight green line, whereas the revenue function is represented by a red curve.

The cost function is represented by a straight green line, whereas the revenue function is represented by a red curve.
Page 96 Exercise 11 Answer
Given: The expense functionE=−300p+13000p, and revenue function isR=−32p{2}+1,200p.
To find The prices at the breakeven points.
For doing so, we will refer to the fact that at the breakeven point, the revenue and expenditure functions are equal.
At the breakeven point, the revenue and expenditure functions are equal.
−300p+13,000=−32p{2}+1,200p
⇒32p{2}
−1,500p+13,000=0.
Using the quadratic formula, find the solution.
p=1,500±√1,5002−4⋅32⋅13,000 /2⋅32
=11.48 or 35.40
∴The prices at the breakeven points are$11.48,$35.40.
Page 96 Exercise 12 Answer
Given: Breakeven prices are$11.48,$35.40.To find: The revenue and expense amount for each of the breakeven points.
For doing so, we will refer to the fact that at the breakeven point, the revenue equals the expense.
We know that the breakeven prices are$11.48,$35.40.
Expenses corresponding to these breakeven prices areE=−300⋅11.48+13,000
=9,557.06
E=−300⋅35.40+13,000
=2,308.44.
At the breakeven point, the revenue equals the expense. SoR=9,557.06,
R=2,308.44.
Our required amount of revenue and expenses are$9,557.06,$2,308.44.
Cengage Financial Algebra 1st Edition Chapter 2 Exercise 2.6 Modeling a Business Page 96 Exercise 13 Answer
Given:
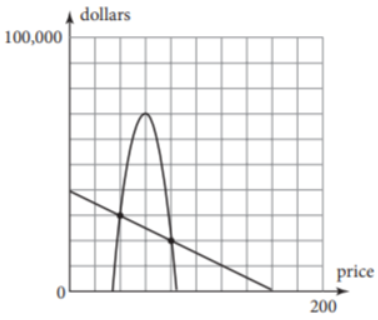
To find The price at which the maximum profit is reached.
The highest revenue yields the biggest profit; the revenue is determined by the parabola.
The highest point of the parabola is found on the third vertical line, which occurs at a cost of$60.
∴ The price at which the maximum profit is reached is$60.
Detailed Solutions For Cengage Financial Algebra Chapter 2 Exercise 2.6
Chapter 2 Solving Linear Inequalities
- Cengage Financial Algebra 1st Edition Chapter 2 Assessment Modeling a Business
- Cengage Financial Algebra 1st Edition Chapter 2 Exercise 2.1 Modeling a Business
- Cengage Financial Algebra 1st Edition Chapter 2 Exercise 2.2 Modeling a Business
- Cengage Financial Algebra 1st Edition Chapter 2 Exercise 2.3 Modeling a Business
- Cengage Financial Algebra 1st Edition Chapter 2 Exercise 2.4 Modeling a Business
- Cengage Financial Algebra 1st Edition Chapter 2 Exercise 2.5 Modeling a Business
- Cengage Financial Algebra 1st Edition Chapter 2 Exercise 2.7 Modeling a Business
- Cengage Financial Algebra 1st Edition Chapter 2 Exercise 2.8 Modeling a Business