Envision Math Grade 8 Volume 1 Chapter 5 Analyze And Solve System Of Linear Equations
Page 257 Exercise 1 Answer
Given: Draw three pairs of lines, each showing a different way that two lines can intersect or not intersect.
How are these pairs of lines related?
There are n ways 2 lines can relate to each other.
The first way is that they are parallel, meaning they do not have any intersections.
The second way is if they are not parallel, but are not the same line. in this case, they have exactly 1 intersection.
The third and last way is, if the lines are the same, in this case, all of their points are the same.
That means they intersect at infinitely many points.
2 lines cannot have 2 points in common because 2 points clearly define a line.
That means if there is a line passing through both points, there cannot be another that does the same.
2 lines cannot have 2 points in common because 2 points clearly define a line.
If they have more than 1 point in common, it means they are the same line and have infinitely many common points.
Envision Math Grade 8 Volume 1 Chapter 5.2 Solutions
Page 263 Focus On Math Practice Answer
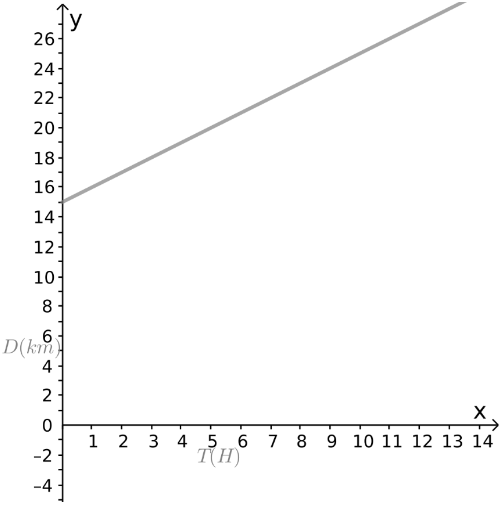
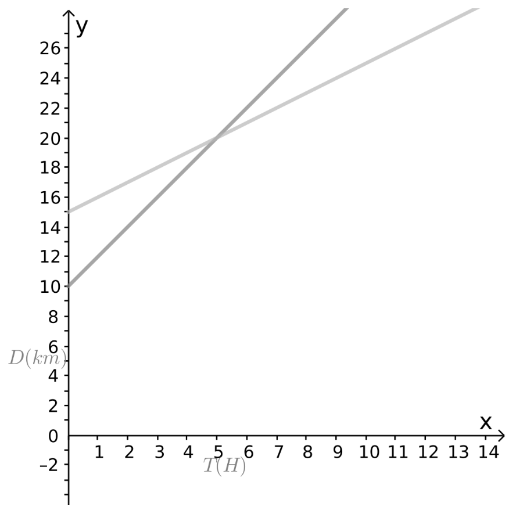
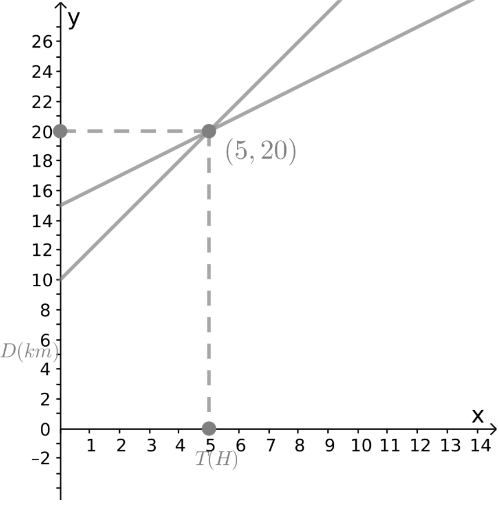
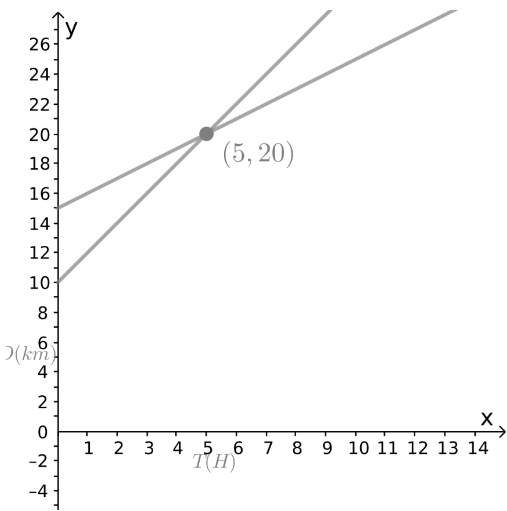
To find: What does the point of intersection of the lines represent in the situation?
Point of intersection means the point at which two lines intersect.
The coordinates of the point of intersection represent the solution to both linear equations simultaneously.
The coordinates of the point of intersection represent the values of x and y that satisfy both equations at the same time.

Page 264 Essential Question Answer
To Find: How does the graph of a system of linear equations represent its solution?
Each pair of lines represents a system of linear equations. A system of linear equations is formed by two or more linear equations that use the same variables.
you can use the graphs to determine the number of solutions for each system.

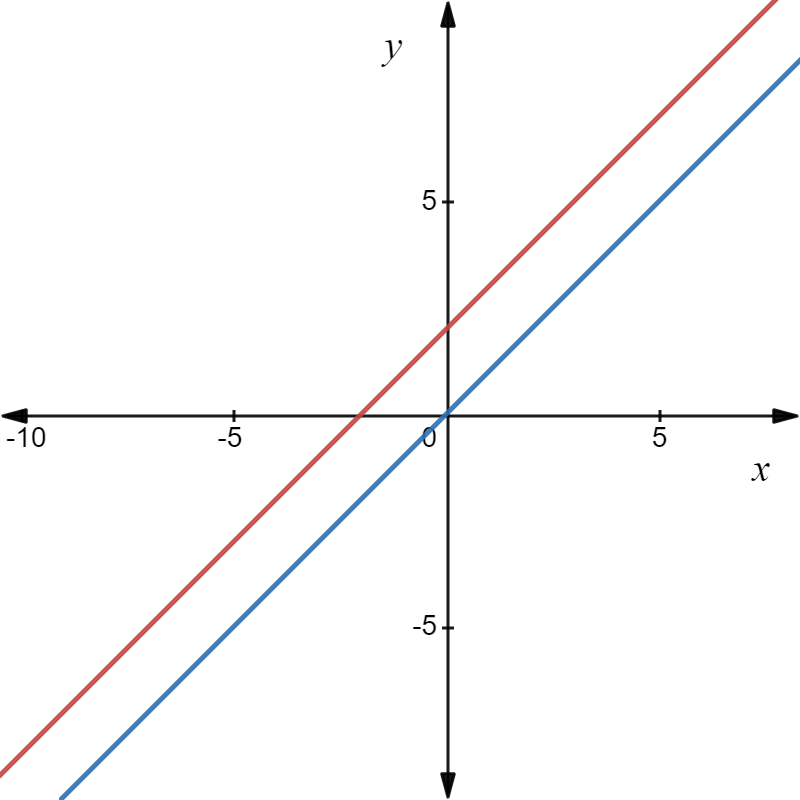
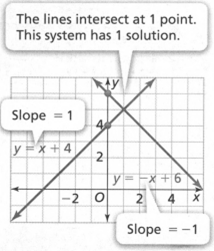
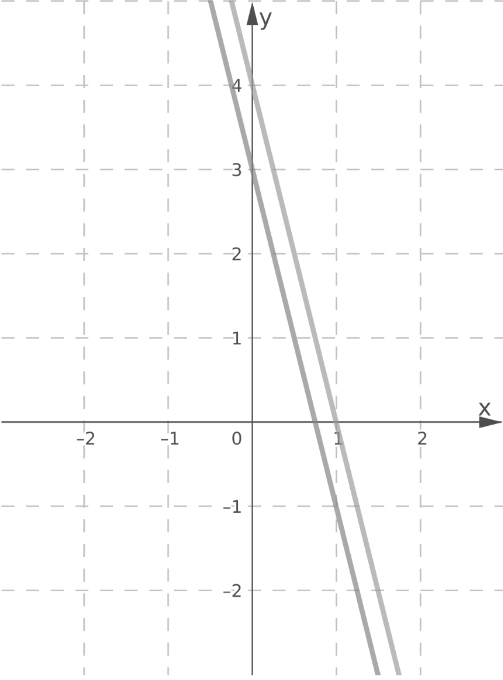
The equations of the linear system
y = x + 4
y = −x + 6
have different slopes.
The system has 1 solution (1,5).
A solution of a system of linear equations is an ordered pair that makes all equations in the system true.

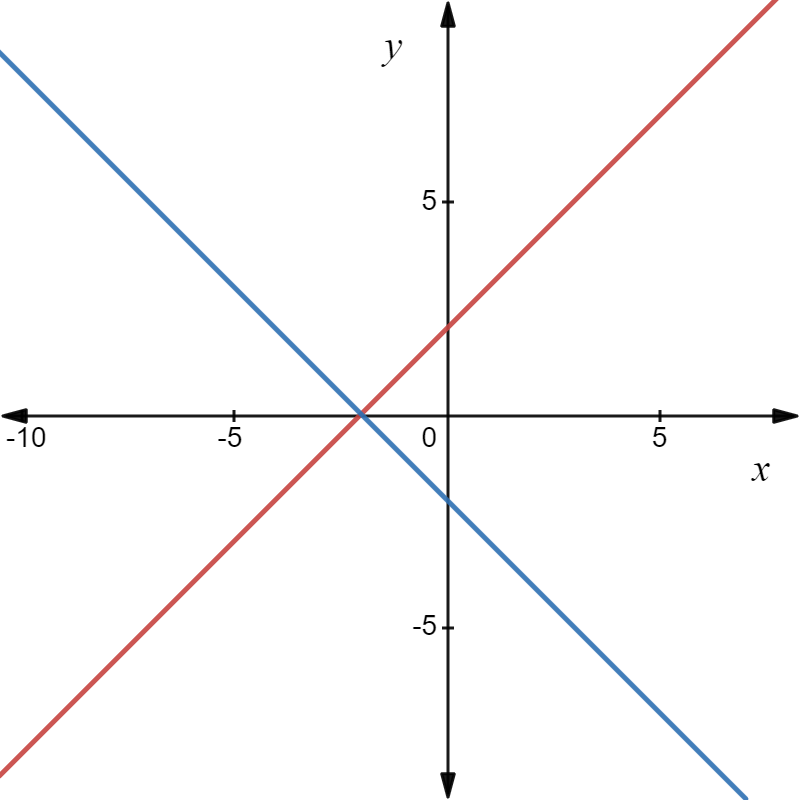
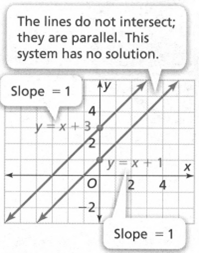
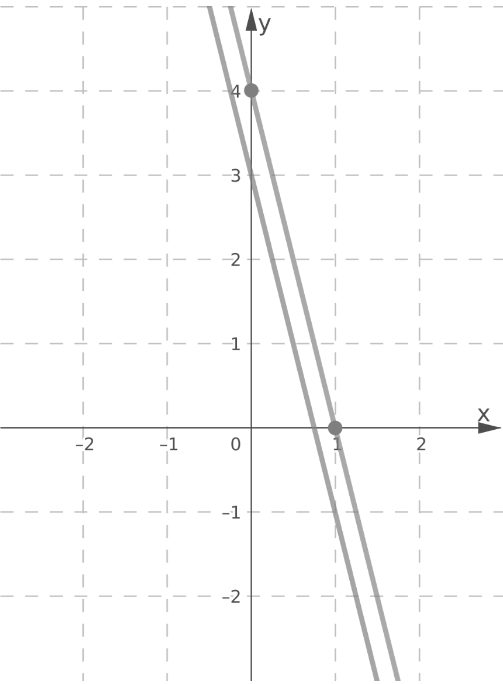
The equations of the linear system
y = x + 3
y = x + 1
have the same slopes and different y−intercepts.
The system has no solution.

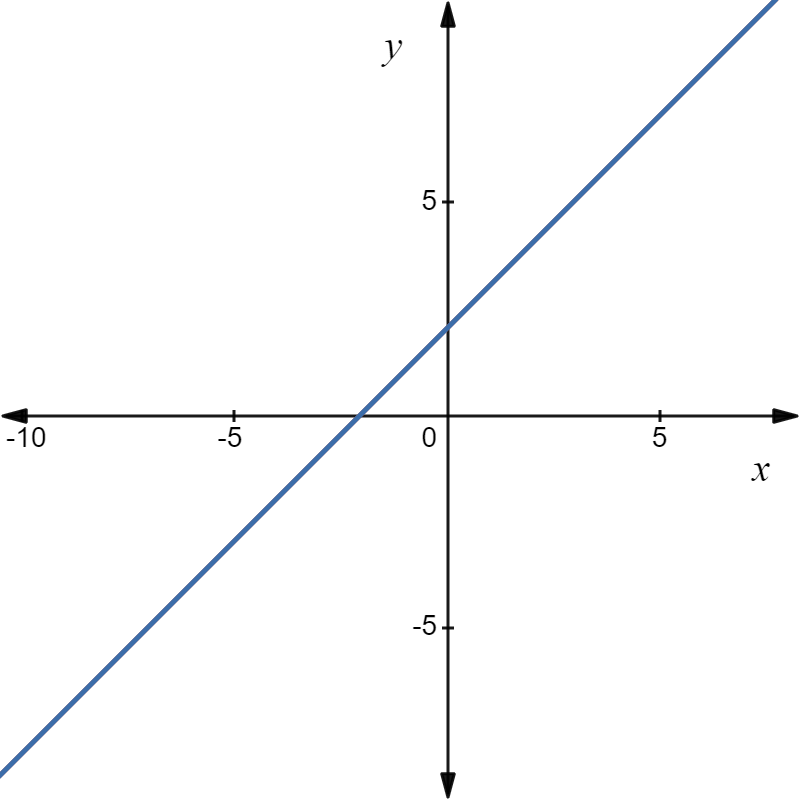
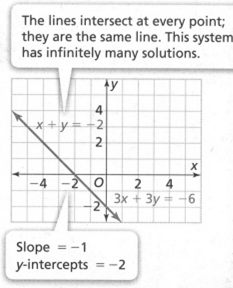
The equations of the linear system
x + y = −2
3x + 3y = −6
have the same slopes and the samey−intercepts. They represent the same line.
The system has infinitely many
Systems of equations can be solved by looking at their graphs.
A system with one solution has one point of intersection.
A system with no solution has no points of intersection.
A system with infinitely many solutions has infinite points of intersection.
Analyze And Solve Systems Of Linear Equations Envision Math Exercise 5.2 Answers
Page 264 Try It Answer
Given:
y = 3x + 5
y = 2x + 4
To find: The solution is the point of intersection.
y = 3x + 5
The first equation is written in slope-intercept form.
Calculate the value of y for x = 0:
y = 3x + 5,x = 0
Substitute x = 0
y = 3 × 0 + 5
Calculate the product
y = 0 + 5
Remove 0
y = 5
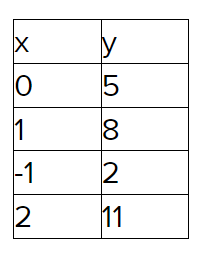
Using the same method, calculate the values of y for a few other values of x
Plot the points on the graph.
Draw a line through the plotted points.
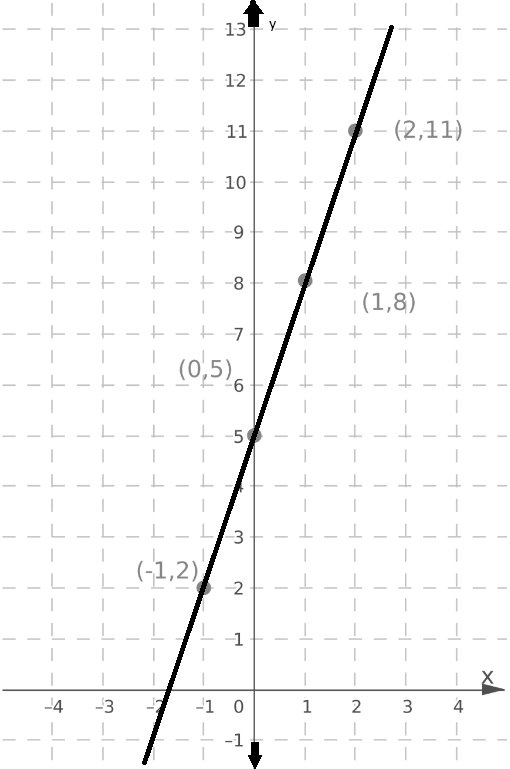
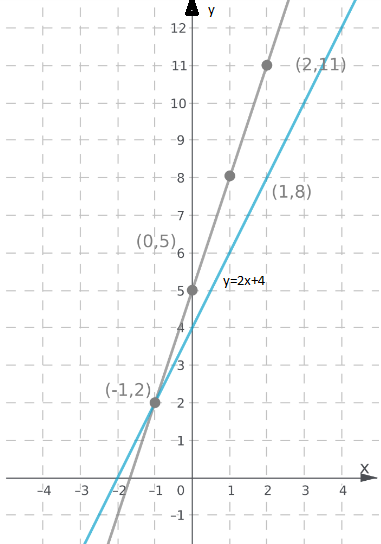
Using the same method, graph the line y = 2x + 4.
The lines intersect at the point (−1,2).
The point of intersection (−1,2) is the solution of the system.
Page 264 Convince Me Answer
Given:
y = 3x + 5
y = 2x + 4
Find: the point of intersection of the graphs represent the solution of a system of linear equations.
Find the points and then plot the points and second equation to find the point of intersection.
Given: y = 3x + 5
The first equation is written in the slope-intercept form.
Calculate the value of y for x = 0,
y = 3x + 5
y = 3(0) + 5
y = 0 + 5
y = 5
Using the same method, calculate the values of y for a few other values of x,
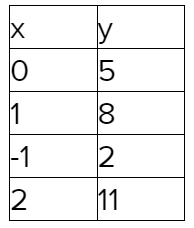
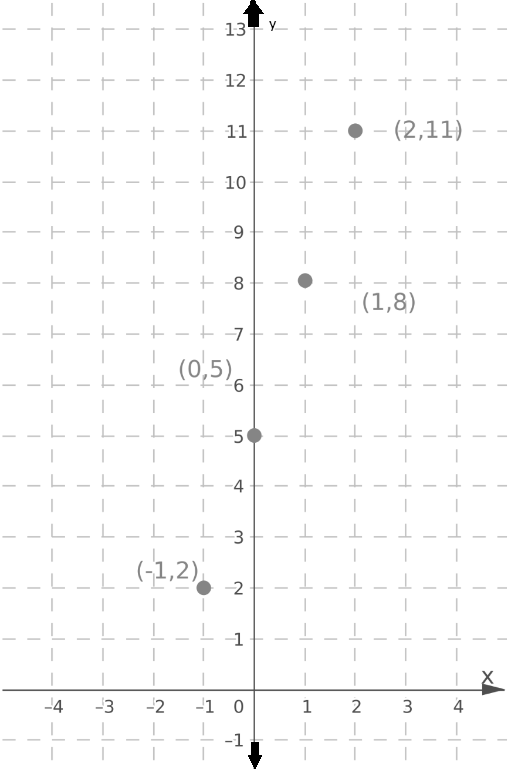
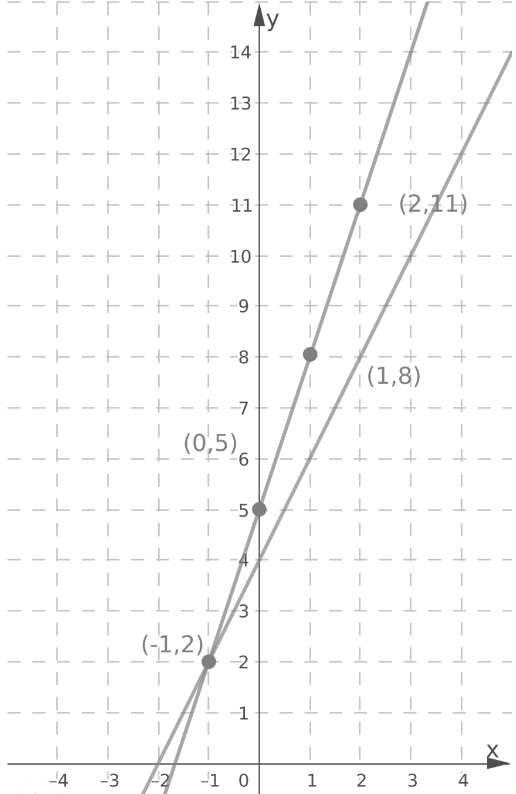
Plot the points on the graph (0,5),(1,8),(−1,2),(2,11) and the equation y = 2x + 4 draw a line as shown below:
The above graph show that the point of intersection is (−1,2).
The point of intersection of the graphs belongs to the first and the second line at the same time and satisfies the equations of both graphs.
Therefore, the point of intersection (−1,2) is a point that satisfies the system of the equations of the two graphs.
Page 266 Exercise 1 Answer
To find: How does the graph of a system of linear equations represent its solution?
Each pair of lines represents a system of linear equations. A system of linear equations is formed by two or more linear equations that use the same variables.
you can use the graphs to determine the number of solutions for each system.
The equations of the linear system
y = x + 4
y = −x+ 6
have different slopes.
The system has 1 solution(1,5).
A solution of a system of linear equations is an ordered pair that makes all equations in the system true.

The equations of the linear system
y = x + 3
y = x + 1
have the same slopes and different y−intercepts.
The system has no solution.
The equations of the linear system
x + y = −2
3x + 3y = −6
have the same slopes and the same y−intercepts. They represent the same line.
The system has infinitely many solutions.
Systems of equations can be solved by looking at their graphs.
A system with one solution has one point of intersection.
A system with no solution has no points of intersection.
A system with infinitely many solutions has infinite points of intersection.
Envision Math Grade 8 Chapter 5.2 Explained
Envision Math Grade 8 Volume 1 Student Edition Solutions Chapter 5 Analyze And Solve System Of Linear Equations Exercise 5.2 Page 266 Exercise 2 Answer
Given: If a system has no solution.
To Find: what do you know about the lines being graphed?
A system has a solution if the lines have a point of intersection.
If a system has no solution, therefore the lines are parallel to each other.
If a system has no solution, the lines being graphed are parallel to each other.
Page 266 Exercise 4 Answer
Given:
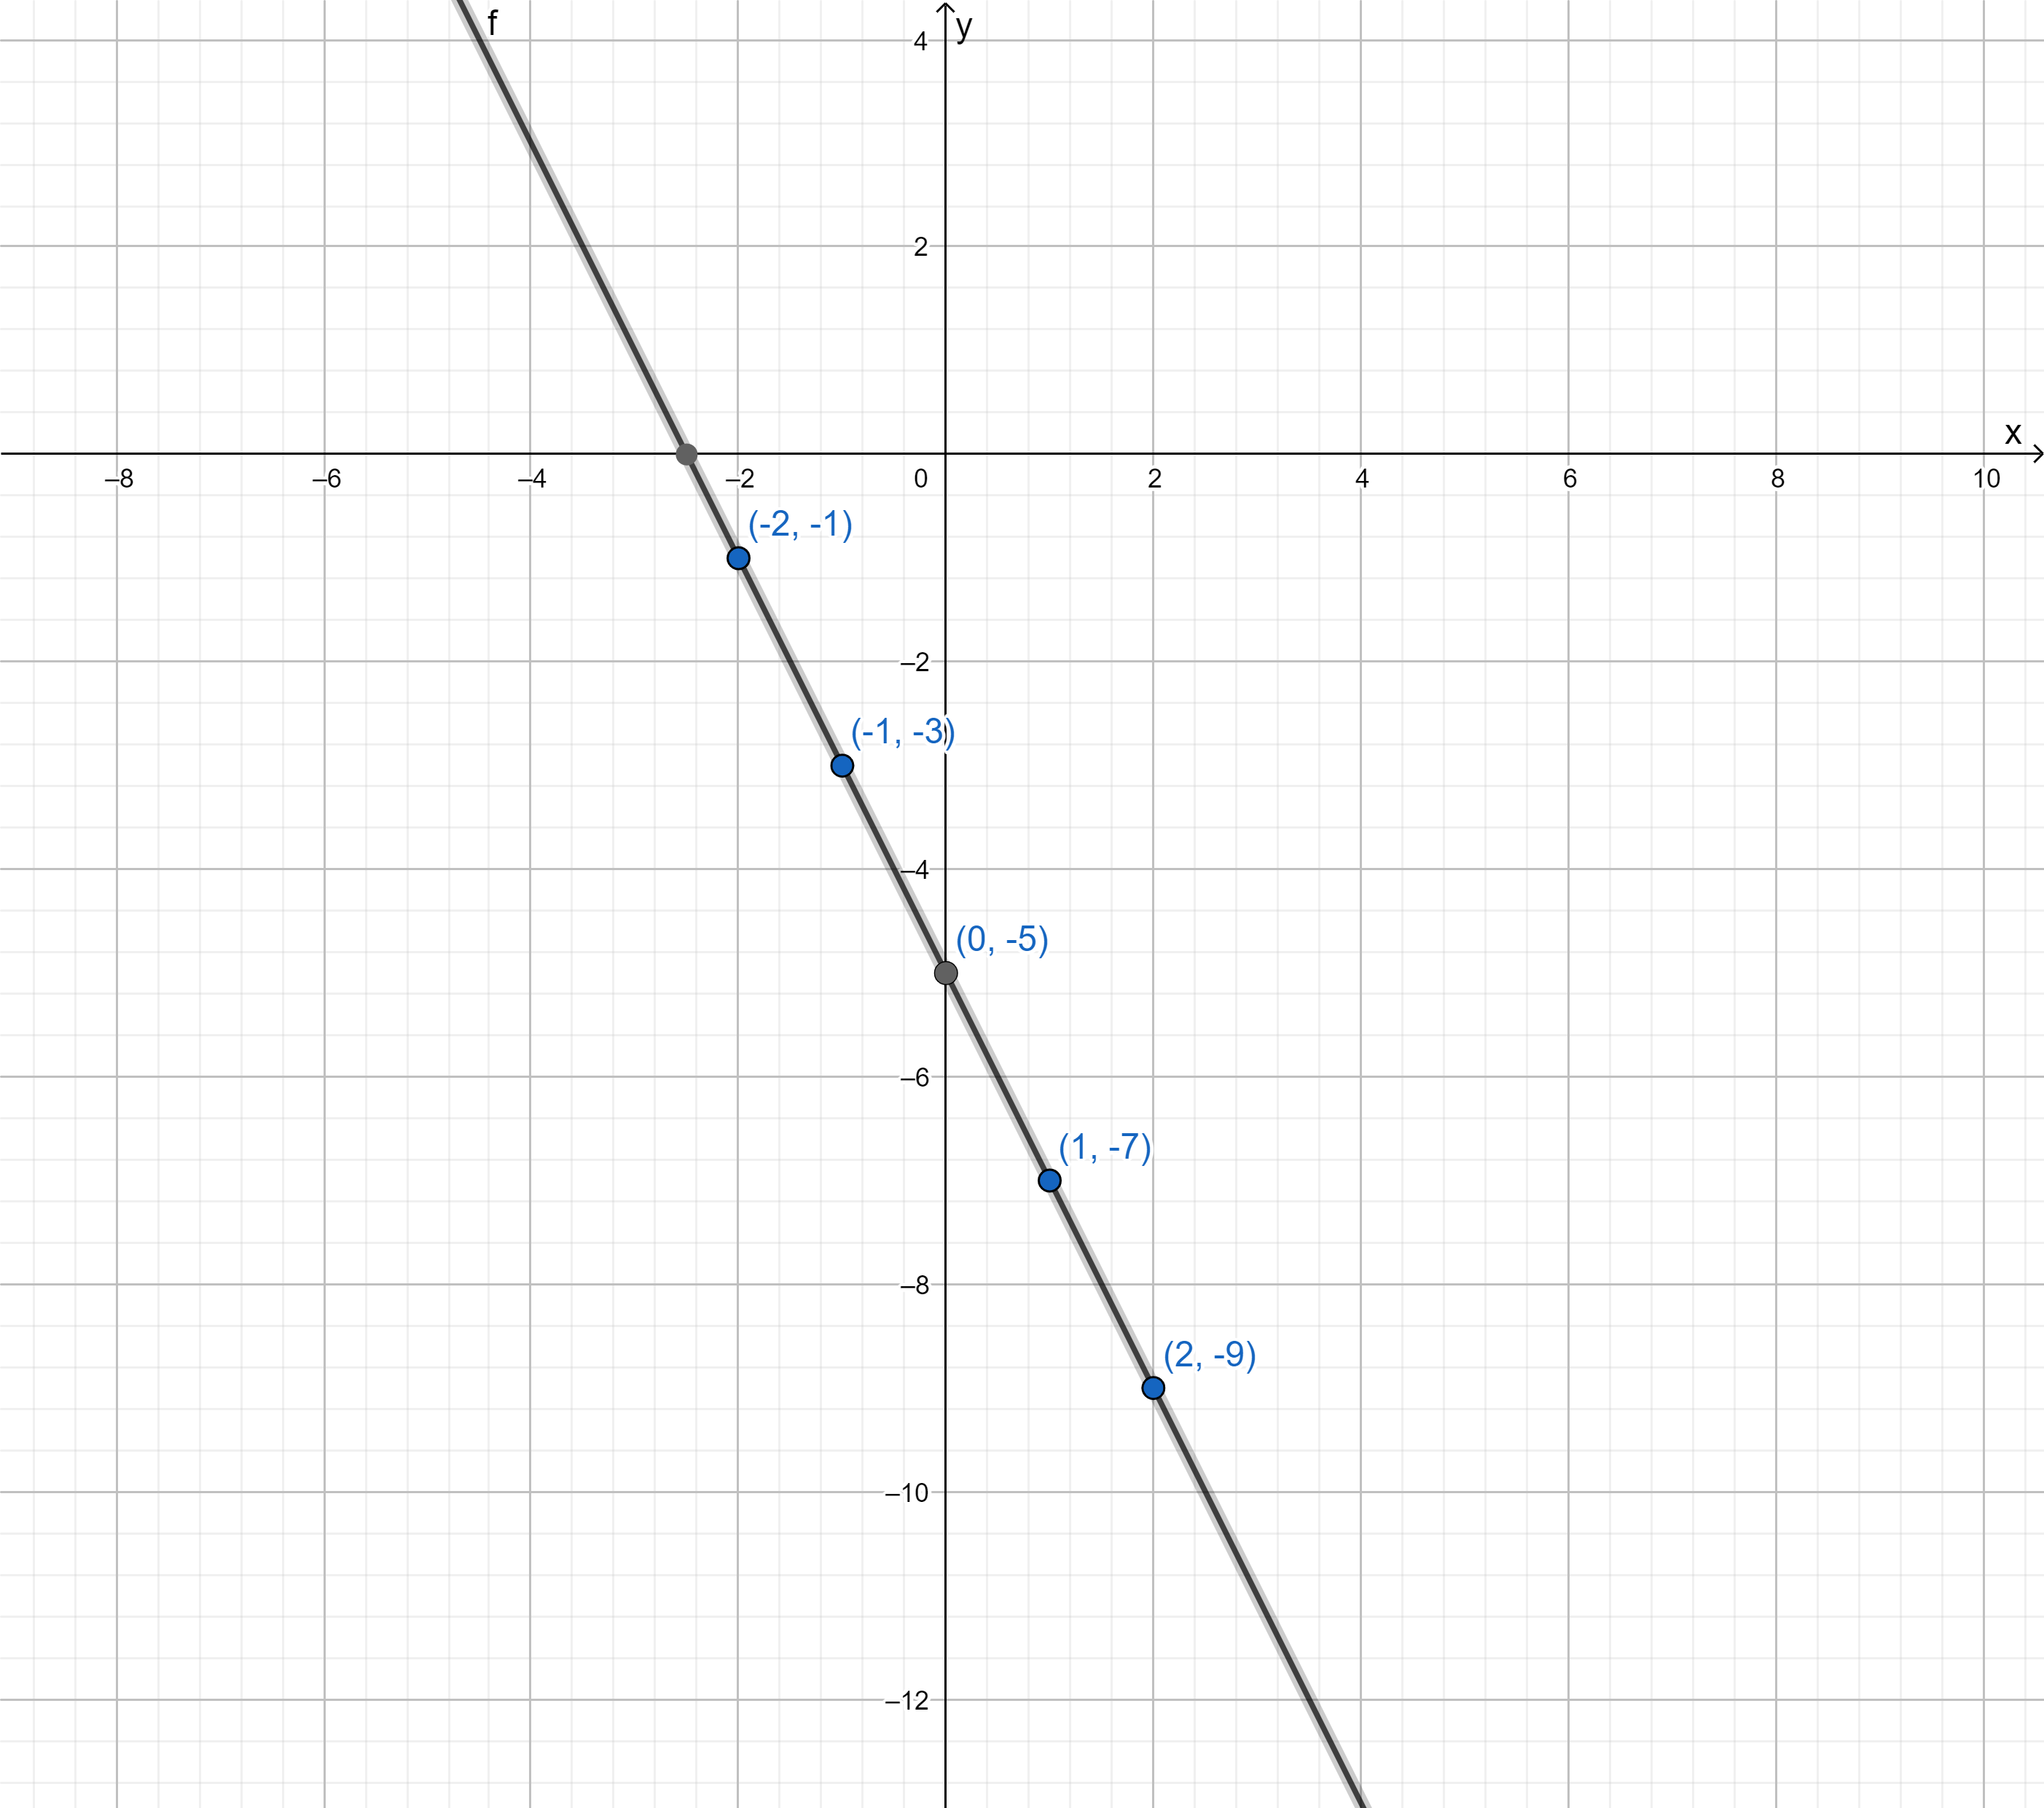
y = −3x − 5
y = 9x + 7
graph each system of equations and find the solution.
y = -3x – 5
The first equation is written in slope-intercept form.
Calculate the value of y for x = 0:
y = −3x −5,x = 0
Substitute x = 0
y = −3 × 0−5
Calculate the product
y = 0 − 5
Remove 0
y = −5
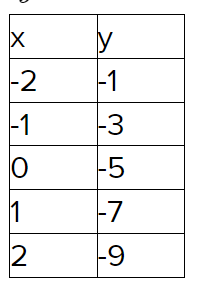
Using the same method, calculate the values of y for a few other values of x.

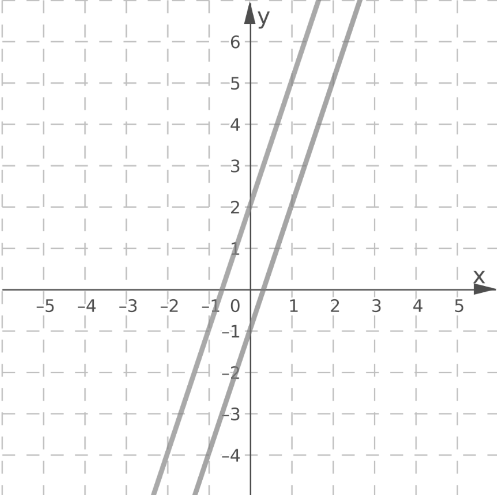
Plot the points (-2, 1), (-1, -2), (0, -5) and (1, -8).
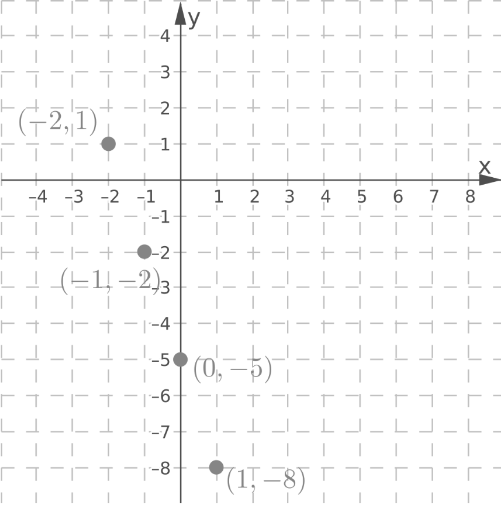
Draw a line through the plotted points.
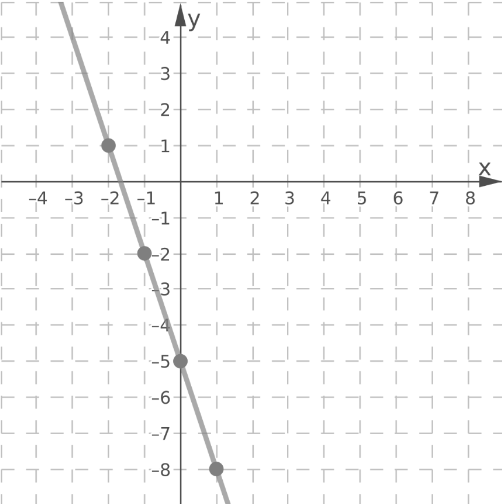
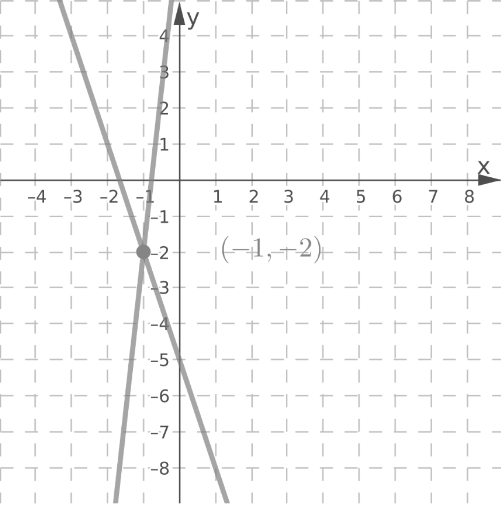
Using the same method, graph the line y = 9x + 7.
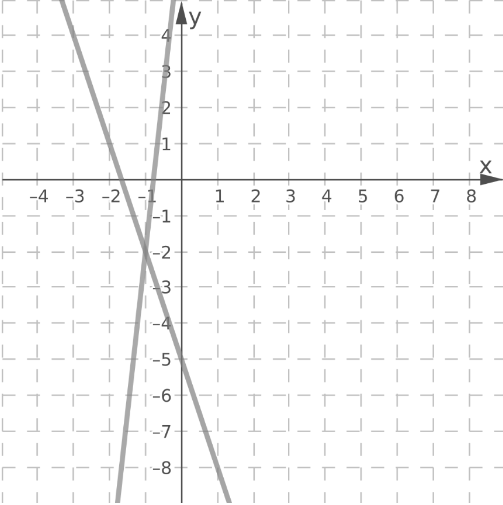
The lines intersect at the point (-1, -2).
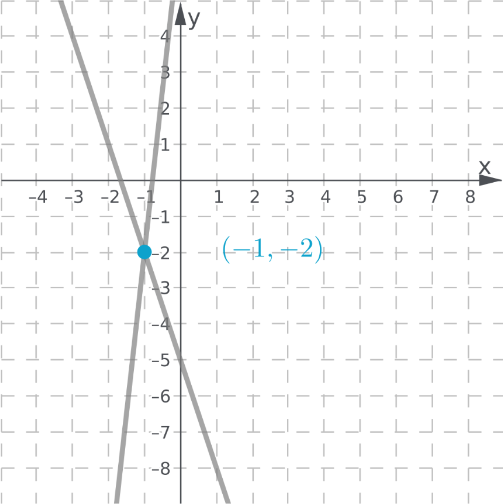
The point of intersection (−1,−2) is the solution of the system.
Page 266 Exercise 5 Answer
Given:
y = −2x − 5
6x + 3y = −15
graph each system of equations and find the solution.
y = 2x – 5
The first equation is in slope-intercept form.
Write the second equation in slope-intercept form:
6x + 3y = −15
Move the variable to the right
3y = −15 − 6x
Divide both sides
y = −5 − 2x
Reorder the terms
y = −2x − 5
Equations of both lines are equal, so lines are the same.
Calculate the value of y for x = −2:
y = −2x − 5,x = −2
Substitute x = −2
y = −2 × (−2)−5
Multiply
y = 4 − 5
Calculate
y = −1
Using the same method, calculate the values of y for a few different values of x
Plot the points on a coordinate plane.

Draw a line through the plotted points.
Each point on the line represents a solution.
Since both lines overlap, the system has infinitely many solutions.
The system has infinitely many solutions.

Page 266 Exercise 6 Answer
Given:
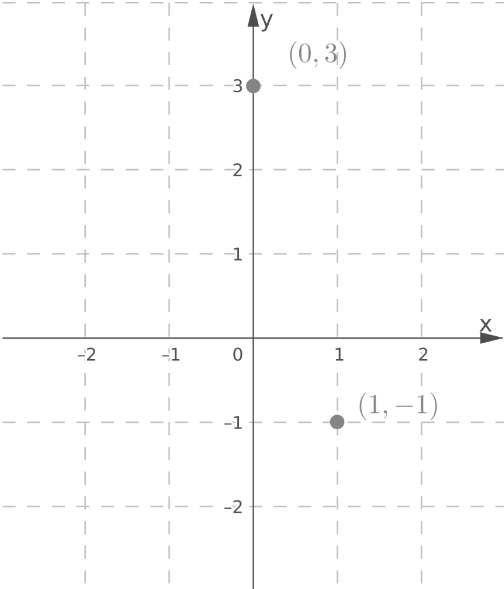
y = −4x + 3
8x + 2y = 8
graph each system of equations and find the solution.
In order to graph y = −4x + 3, calculate two points on the line.
Calculate the value of y for x = 0:
y = −4x + 3,x = 0
Substitute x = 0
y = −4 × 0 + 3
Calculate the product
y = 0 + 3
Remove 0
y = 3
Calculate the value of y for x = 1:
y = −4x + 3,x = 1
Substitute x = 1
y = −4 × 1 + 3
Calculate the product
y = −4 + 3
Calculate
y = −1
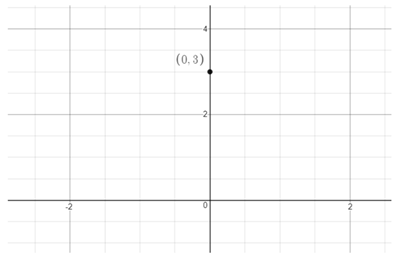
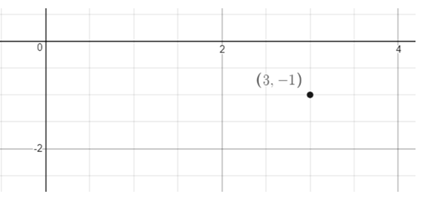
Thus, the points(0,3) and (1,−1) are on the graph of
y = −4x + 3.
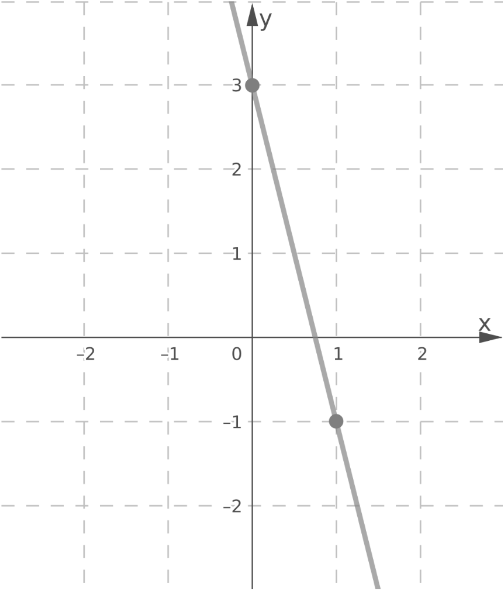
Plot the points(0,3) and (1,−1).
Graph y = −4x + 3 by drawing a line through the points.
Write the second equation in the slope-intercept form:
8x + 2y = 8
Move the variable to the right
Divide both sides
y = 4 − 4x
Reorder the terms
y = −4x + 4
Calculate the value of y for x = 0:
y = −4x + 4,x = 0
Substitute x = 0
y = −4 × 0 + 4
Calculate the product
y = 0 + 4
Remove 0
y = 4
Step 8
Calculate the value of y for x = 1:
y = −4x + 4,x = 1
Substitute x = 1
y = −4 × 1 + 4
Calculate the product
y = −4 + 4
Eliminate the opposites
y = 0
Thus, the points (0,4) and (1,0)are on the graph of 8x + 2y = 8.
Plot the points(0,4) and (1, 0).
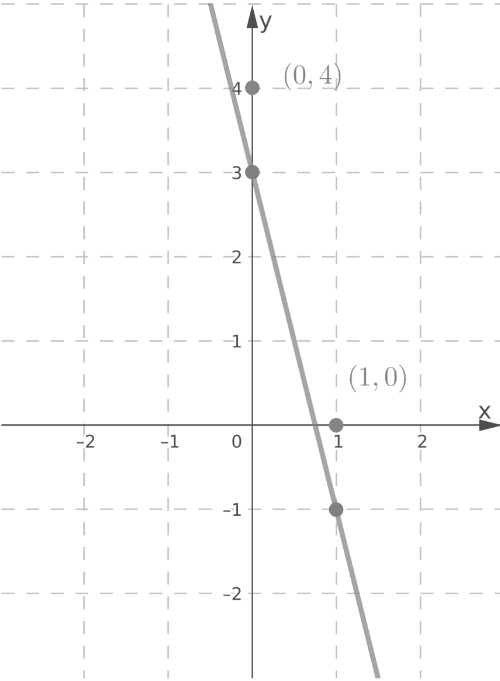
Graph 8x + 2y = 8 by drawing a line through the points.
Lines y = −4x + 3 and 8x + 2y = 8 are parallel.
Since the lines are parallel, there is no point of intersection.
Therefore, the system has no solution.
The lines y = −4x + 3 and 8x + 2y = 8 are parallel, so the system has no solution.

Solutions For Envision Math Grade 8 Exercise 5.2
Envision Math Grade 8 Volume 1 Student Edition Solutions Chapter 5 Analyze And Solve System Of Linear Equations Exercise 5.2 Page 267 Exercise 7 Answer
Given: x + 4y = 8
3x + 4y = 0
Graph each system of equations to determine the solution.
Rewrite the first equation in slope-intercept form:
x + 4y = 8
Move the variable to the right
4y = 8 − x
Divide both sides
y = \(2-\frac{1}{4} x\)
Reorder the terms
y = \(-\frac{1}{4} x+2\)
Calculate the value of y for x = 0:
y = \(-\frac{1}{4} x+2, x=0\)
Substitute x = 0
y = \(-\frac{1}{4} \times 0+2\)
Calculate the product
y = 0 + 2
Remove 0
y = 2
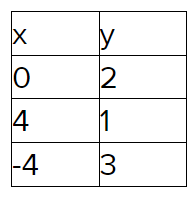
Using the same method, calculate the values of y for a few other values of x.
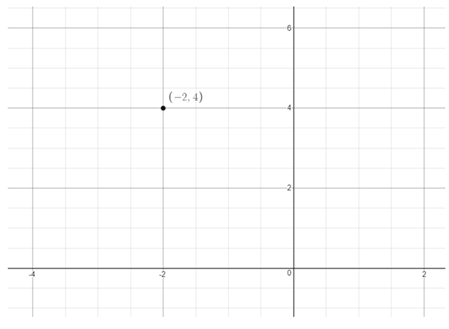
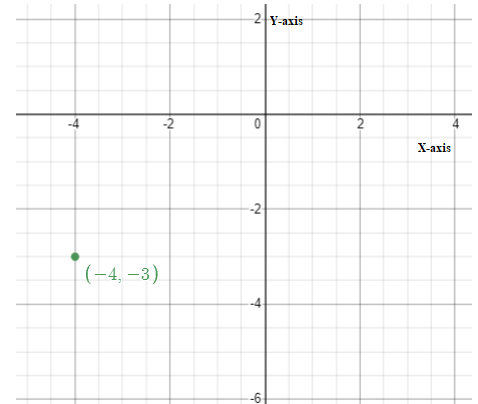
Plot the points (0,2),(4,1),(−4,3)
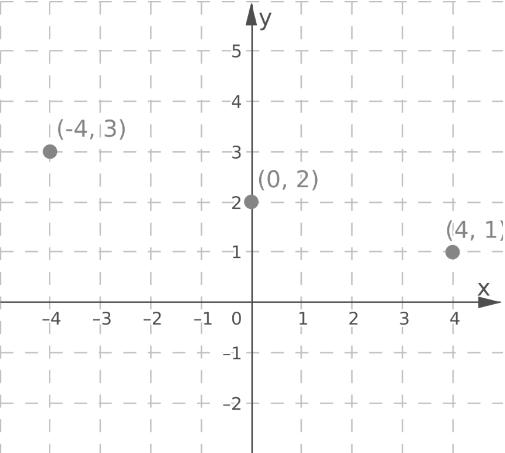
Draw a line through the plotted points.
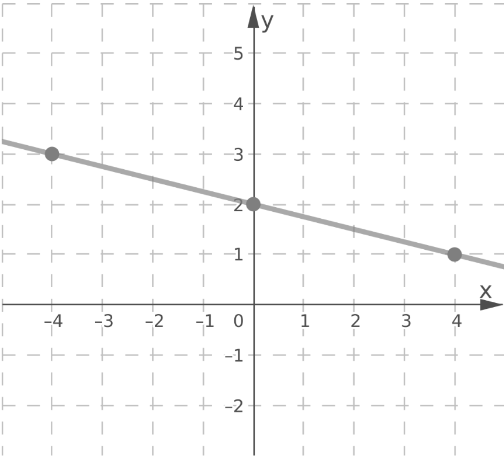
Using the same method, graph the line 3x + 4y = 0.
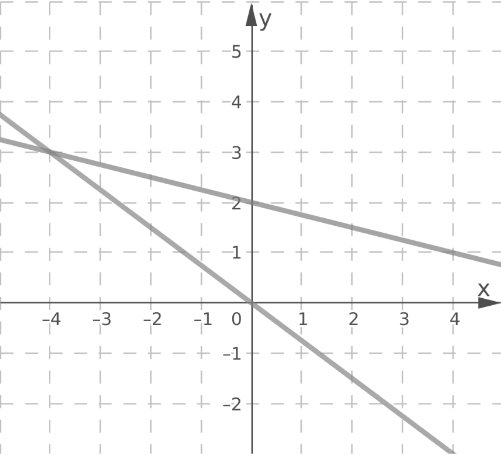
The lines intersect at the point (−4,3).
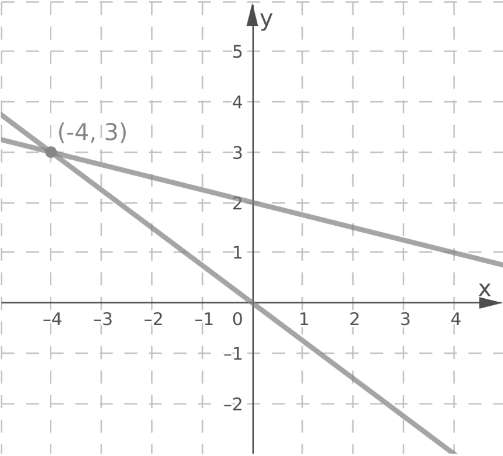
The point of intersection (−4,3) is the solution of the system.

Page 267 Exercise 8 Answer
Given:
2x − 3y = 6
4x − 6y = 12
graph each system of equations to determine the solution.
Write the first equation in slope-intercept form:
2x − 3y = 6
Move the variable to the right
−3y = 6 − 2x
Change the signs
3y = −6 + 2x
Divide both sides
y = \(-2+\frac{2}{3} x\)
Reorder the terms
y = \(\frac{2}{3} x-2\)
Write the second equation in slope-intercept form:
4x – 6y = 12
Move the variable to the right
-6y = 12 – 4x
Change the signs
6y = -12 + 4x
Divide both sides
y = \(-2+\frac{2}{3} x\)
Reorder the terms
y = \(\frac{2}{3} x-2\)
Equations of both lines are equal, so lines are the same.
Calculate the value of y for x = -9
y = \(\frac{2}{3} x-2, x=-9\)
Substitute x = -9
y = \(\frac{2}{3} \times(-9)-2\)
Multiply
Reduce
y = -2 x 3 -2
Calculate
y = -8

Using the same method, calculate the values of y for a few different values of x
Plot the points(−9,−8),(−6,−6),(−3,−4),(6,2) and (9,4).
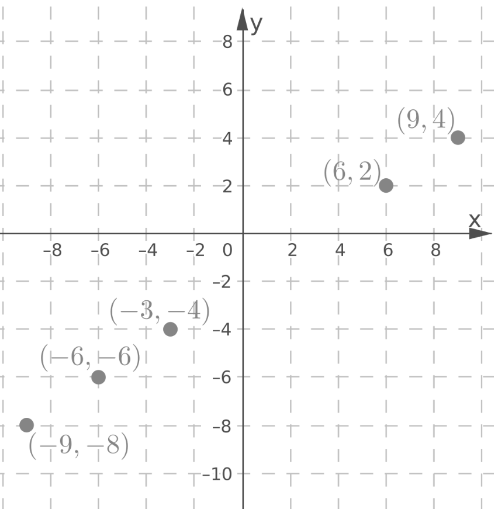
Draw a line through the plotted points.
Each point on the line represents a solution.
Since both lines overlap, the system has infinitely many solutions.
The system has infinitely many solutions.
Envision Math Grade 8 Volume 1 Chapter 5.2 Practice Problems
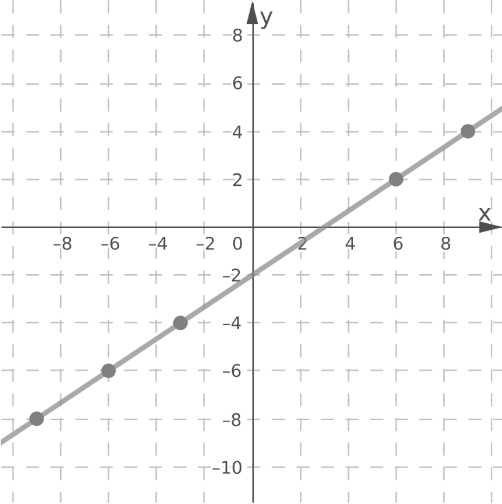
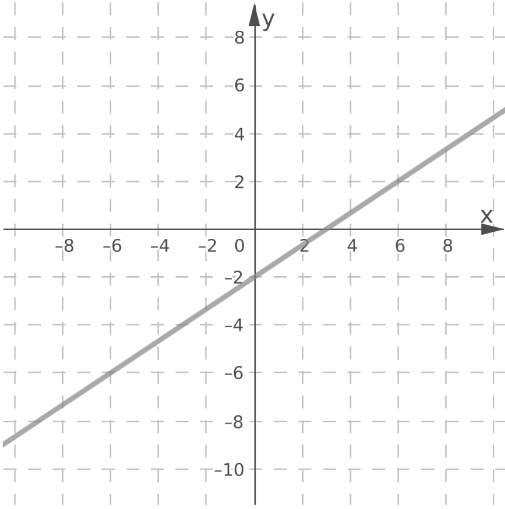
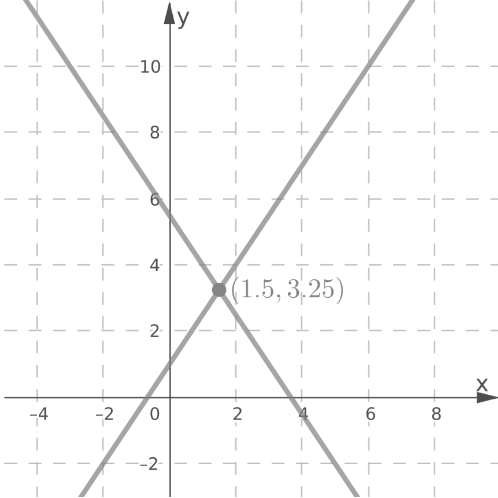
Page 267 Exercise 11 Answer
Given:
y = 1.5x + 1
y = −1.5x + 5.5
To Find: Graph the system of equations, then estimate the solution.
We have,
y = 1.5x + 1
The first equation is written in slope-intercept form.
Calculate the value of y for x = 0:
y = 1.5x + 1,x = 0
Substitute x = 0
y = 1.5 × 0 + 1
Calculate the product
y = 0 + 1
Remove 0
y = 1

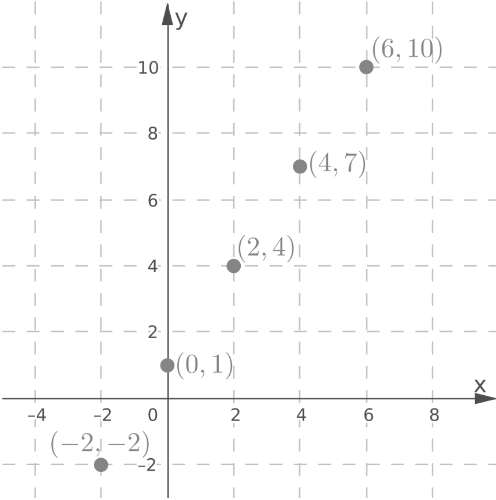
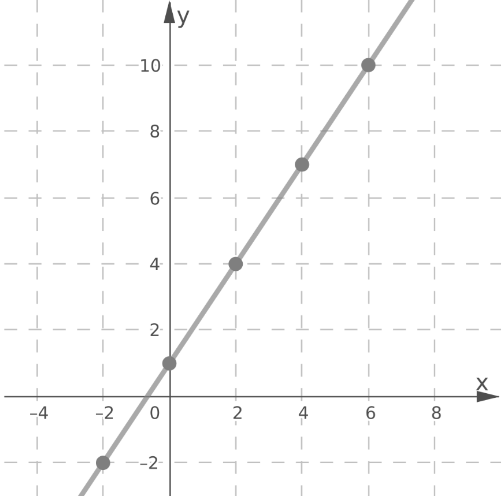
Using the same method, calculate the values of y for a few other values of x.
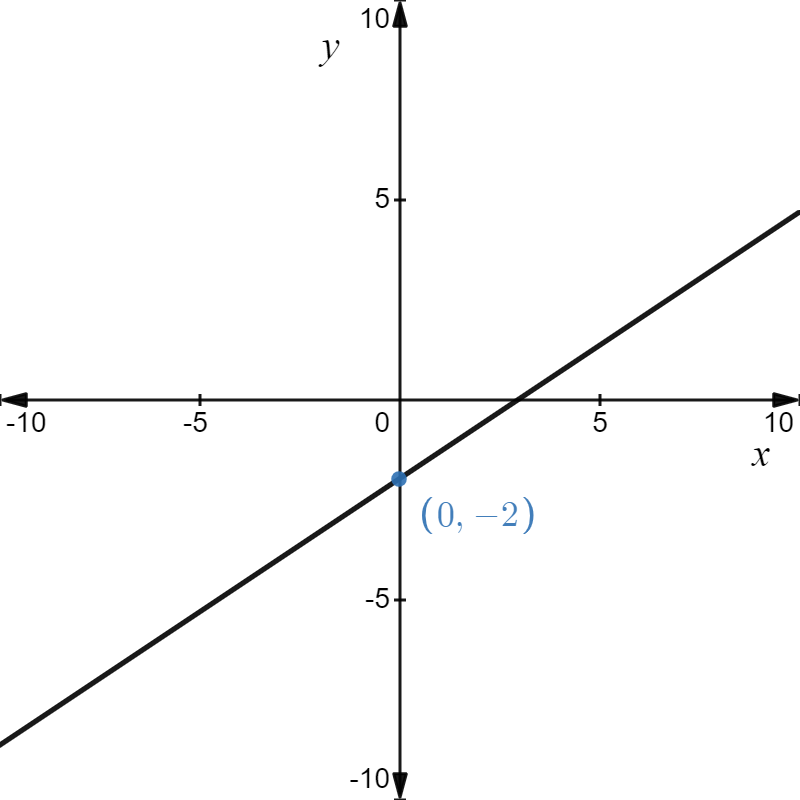
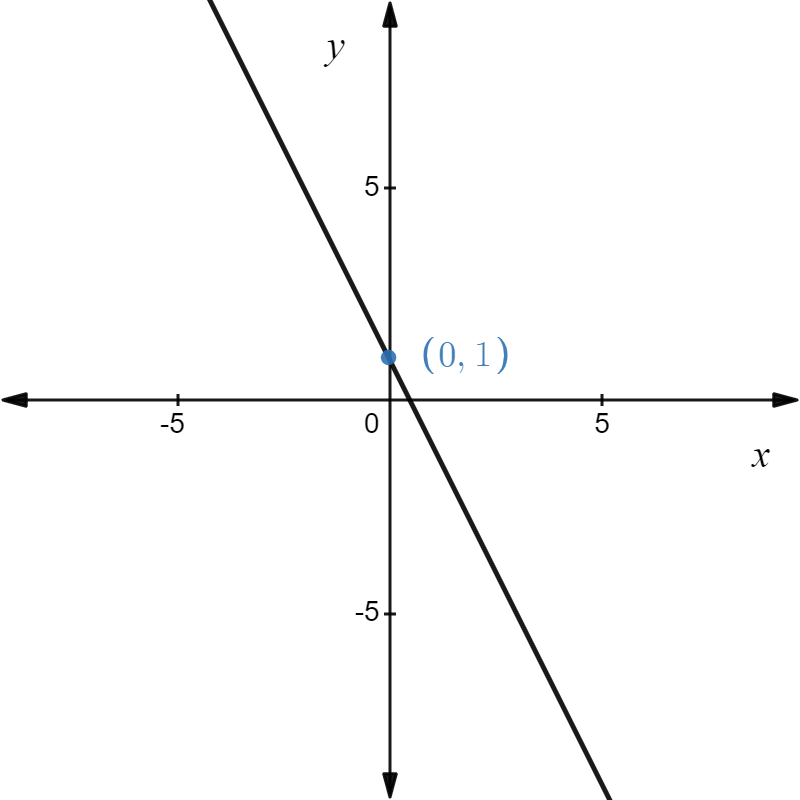
Plot the points (-2, -2), (0, 1), (2, 4), (4, 7) and (6, 10)
Draw a line through the plotted points.
Using the same method, graph the line y = -1.5x + 5.5.

The lines intersect at the point (1.5,3.25).

The point of intersection (1.5,3.25) is the solution of the system.
Envision Math 8th Grade Systems Of Equations Topic 5.2 Key Concepts
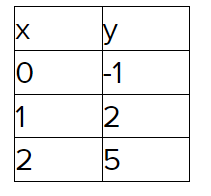
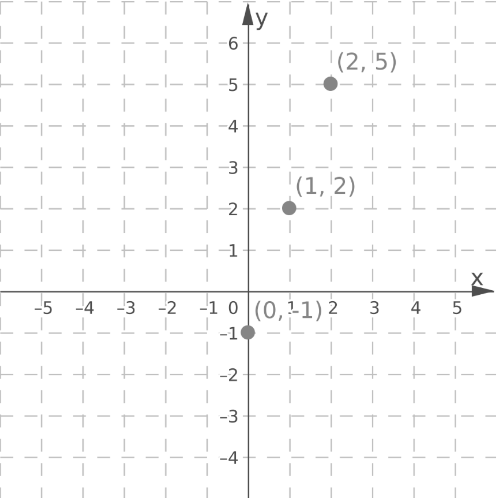
Envision Math Grade 8 Volume 1 Student Edition Solutions Chapter 5 Analyze And Solve System Of Linear Equations Exercise 5.2 Page 268 Exercise 12 Answer
Given:
−3y = −9x + 3
−6y = −18x − 12
To Find: graph and determine the solution of the system of equations.
Write the first equation in the slope-intercept form:
−3y = −9x + 3
Calculate
y = 3x − 1
Calculate the value of y for x = 0:
y = 3x−1,x = 0
Substitute x = 0
y = 3 × 0 − 1
Calculate the product
y = 0 − 1
Remove 0
y = −1
Using the same method, calculate the values of y for a few other values of x.
Plot the points (0,−1),(1,2),(2,5)
Draw a line through the plotted points.
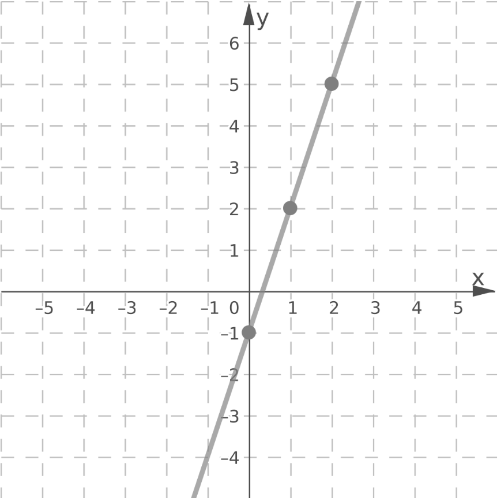
Write the second equation in slope-intercept form:
−6y = −18x − 12
Change the signs
6y = 18x + 12
Divide both sides
y = 3x + 2
Using the same method, graph the line y = 3x + 2.

Lines y = 3x − 1 and y = 3x + 2 are parallel.
Since the lines are parallel, there is no point of intersection.
Therefore, the system has no solution.
The lines y = 3x − 1 and y = 3x + 2 are parallel, so the system has no solution.
Envision Math Grade 8 Topic 5.2 Graphing Linear Systems Solutions
Page 268 Exercise 13 Answer
Given:
x + 5y = 0
25y = −5x
To Find: graph and determine the solution of the system of equations.
Write the first equation in slope-intercept form:
x + 5y = 0
Calculate
y = \(-\frac{1}{5} x\)
Write the second equation in slope-intercept form:
25y = −5x
Divide both sides
25y ÷ 25 = −5x ÷ 25
Divide
Rewrite
y = \(-\frac{5}{25} x\)
Reduce the fraction
y = \(-\frac{1}{5} x\)
Equations of both lines are equal, so lines are the same.
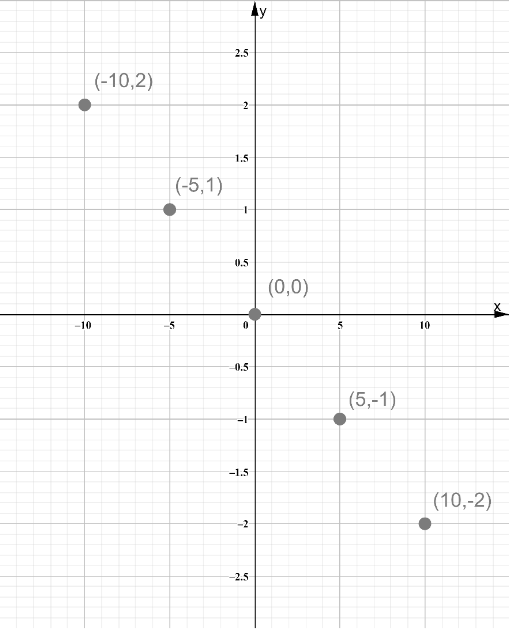
Calculate the value of y for x = -10:
y = \(-\frac{1}{5} x, x=-10\)
Substitute x = -10
y = \(-\frac{1}{5} \times(-10)\)
Multiply
Reduce
y = 2

Using the same method, calculate the values of y for a few different values of x
Plot the points (-10, 2), (-5, 1), (0, 0), (5, -1) and (10, -2).
Draw a line through the plotted points.
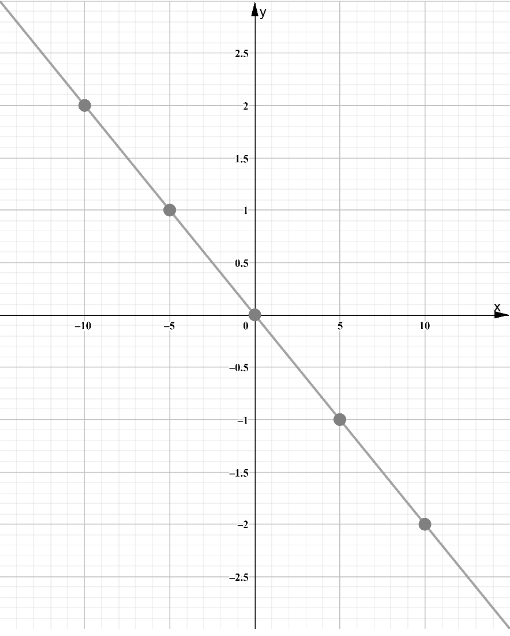
Each point on the line represents a solution.
Since both lines overlap, the system has infinitely many solutions.
The system has infinitely many solutions.

Envision Math Grade 8 Chapter 5.2 Lesson Overview
Envision Math Grade 8 Volume 1 Student Edition Solutions Chapter 5 Analyze And Solve System Of Linear Equations Exercise 5.2 Page 268 Exercise 14 Answer
Given: Higher Order Thinking The total cost, c, of making n copies can be represented by a system of equations.
To find: How many copies you need to make for the total cost to be the same at both stores.
The first shop offers an unlimited number of items n for $5.The equation representing the price c in the first shop is given by:
c = 5
The second shop charges 20ϕ = $0.2 per item and additional $2 for the service.
The equation representing the price c in the second shop is given by:
c = 0.2n + 2
Since the price of the service in the first shop is $5 regardless of the number of items, find the number of items the second shop offers for $5
\(\left\{\begin{array}{l}
c=5 \\
c=0.2 n+2
\end{array}\right.\)
Find the number of items the second shop offers for $5 by solving the system.
\(\left\{\begin{array}{l}
c=5 \\
c=0.2 n+2
\end{array}\right.\)
Set the sides equal 5 = 0.2n + 2
Solve the equation n = 15
A possible solution is (c,n) = (5,15)
Check the solution
\(\left\{\begin{array}{l}
5=5 \\
5=0.2 \times 15+2
\end{array}\right.\)
Simplify
\(\left\{\begin{array}{l}5=5 \\
5=5
\end{array}\right.\)
The ordered pair is a solution.
(c,n) = (5,15)
It follows that the second shop offers 15 items for $5.
For the total price to be the same in both shops, the number of items purchased in the second shop must be 15.
Given: Higher Order Thinking The total cost, c, of making n copies can be represented by a system of equations.
To explain, If you have to make a small number of copies, which store should you go to.
The cost in store W is $5 for any number of copies.
The cost in store z is given by the equation:
C = 2 + 0.2n
Where C is the cost and n is the number of copies.
C = 2 + 0.2n
The store z is preferred as far as the number of copies costs less than $5. express this using the inequality:
2 + 0.2n < 5
Solve the inequality for n:
2 + 0.2n < 5
Move the constant to the right
0.2n < 5 − 2
Calculate
0.2n < 3
Divide both sides of the inequality by 0.2
n < 15
Store z is preferred for a small number of copies less than 15.
Store z is preferred for a small number of copies less than 15.