
Big Ideas Math Algebra 1 Student Journal 1st Edition Chapter 3 Graphing Linear Functions Exercise 3.7
Page 90 Essential Question Answer
We know the graph of the absolute value function |x| is a V-shaped graph pointed at the origin.
The graph is shifted to the right by h units if h is positive in the function |x−h| and the original graph is shifted to the left by h units if it is negative. That is the graph of |x−h| will be pointed at h.
Multiplying a number a>0 opens up the graph whereas if a<0 then the graph opens down. Adding k>0 to this function translates the graph k units up whereas if k<0 the graph is translated k units down.
The values a,h,k in the absolute value function g(x)=a|x−h|+k decide the transformations of the graph ∣ |x|. The graph of g(x) will be V-shaped pointed at h, the graph opens up if a>0 and opens down if a<0. The translates k units up if k>0 and translated down by k units if it is negative.
Read and Learn More Big Ideas Math Algebra 1 Student Journal 1st Edition Solutions
Big Ideas Math Algebra 1 Student Journal 1st Edition Chapter 3 Graphing Linear Functions Exercise 3.7 Page 94 Exercise 4 Answer
Given: r(x)=|x+2| and graph f(x)=|x| and a table with different values of x
To find the domain and range of the given equation
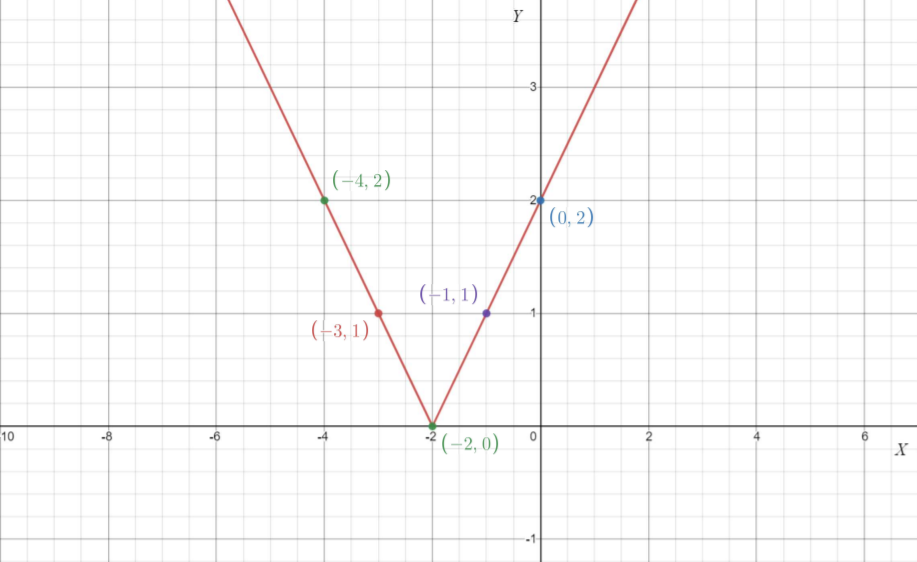
Solution: plotting r(x)=|x+2| with the points from the values in the table
We have to calculate the values of r(x) with x in the table:
When x=−4
r(x)=∣x+2∣=∣−4+2∣
⇒ r(x)=∣−2∣=2
When, x=−3
r(x)=∣−3+2∣=∣−1∣
⇒ r(x)=1
When x=−2
r(x)=∣−2+2∣=∣0∣
⇒ r(x)=0
When x=−1
r(x)=∣−1+2∣=∣1∣
⇒r(x)=1
When x=0
r(x)=|0+2|=|2|
⇒r(x)=2
This will be tabulated as:

And then plot these points in the graph
Now we have the given points and the graph as r(x)=|x+2| is.
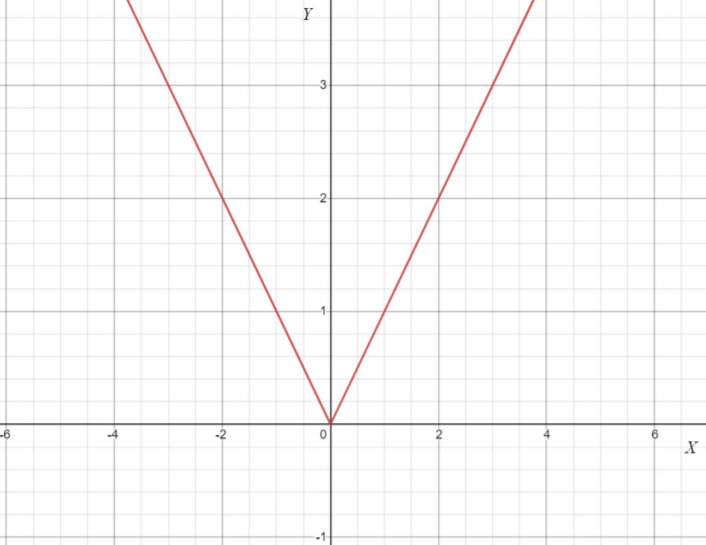
And We have the given graph of f(x)=|x|
Now, plotting the graph of f(x)=|x| and r(x)=|x+2|
Together for comparison from the graph, it is clearly visible that the graph of r(x)=|x+2| is a horizontal stretch by 2 of the graph
f(x)=|x|

And the domain is all real numbers and the range is y≥0
The Domain of the function r(x) are all Real Numbers
The Range of the function r(x) is y≥0
And the compared graph is
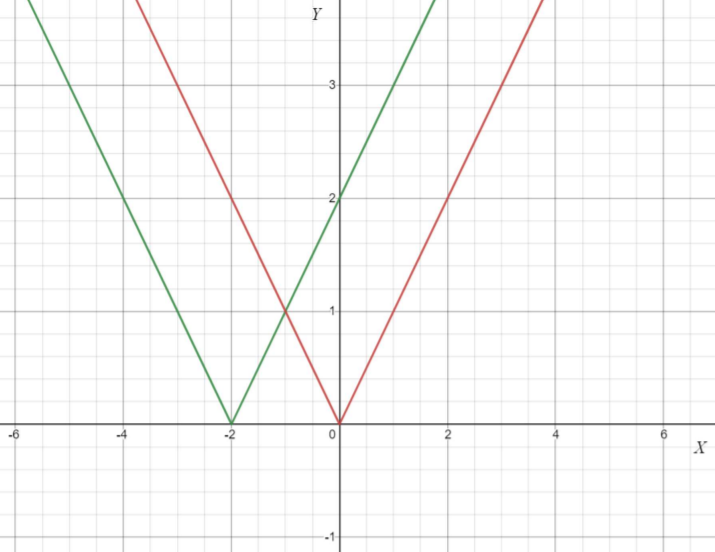
The graph touches different values on horizontal axes with a stretch of 2
Big Ideas Math Student Journal Exercise 3.7 Examples