
Big Ideas Math Algebra 1 Student Journal 1st Edition Chapter 3 Graphing Linear Functions Exercise 3.2
Page 64 Essential Question Answer
Given:- A function.
We have to check its linearity.
Simplify the equation as closely as possible to the form of y=mx+b.
Check to see if your equation has exponents. If it has exponents, it is nonlinear.
If your equation has no exponents, it is linear.
To check the linearity:- Simplify the equation as closely as possible to the form of y=mx+b Check to see if your equation has exponents. If it has exponents, it is nonlinear. If your equation has no exponents, it is linear.
Big Ideas Math Algebra 1 Chapter 3 Exercise 3.2 Solution
Big Ideas Math Algebra 1 Student Journal 1st Edition Chapter 3 Graphing Linear Functions Exercise 3.2 Page 64 Exercise 1 Answer
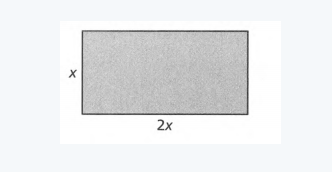
Given:- l=x
b=2x
We have to complete the table.
We will first find the perimeter for each value.
And we also have to tell about the linearity of the function.
The perimeter is given by:
2(l+b)
=2(x+2x)
=2(3x)
=6x
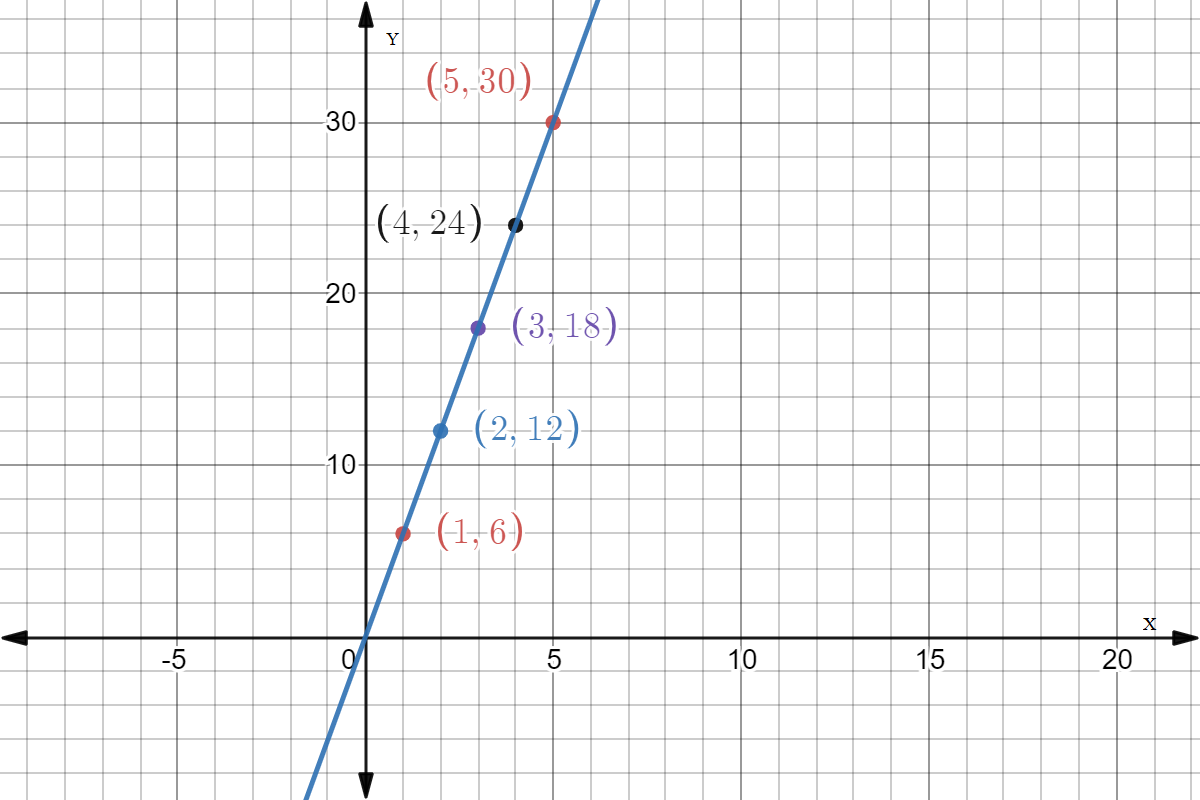
The table becomes
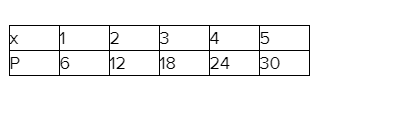
The graph for the given data is

As the function becomes
f(x)=6x
Therefore, the function is linear.
The graph for the perimeter of length x and breadth 2x is and the function is linear.
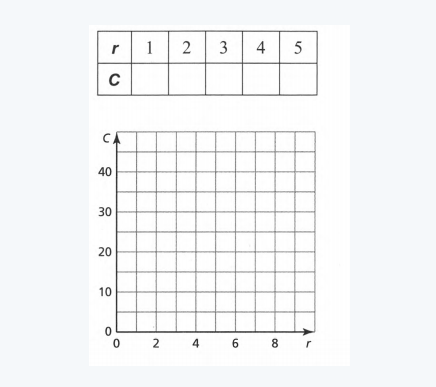
We are given a table:
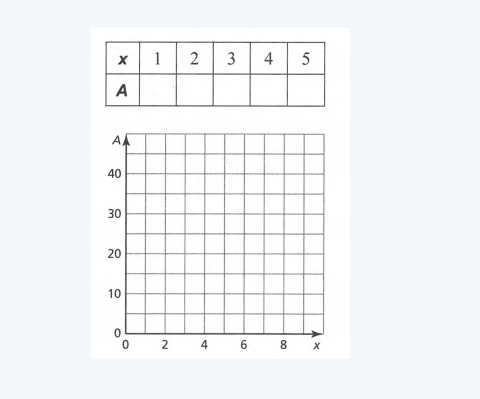
We are asked to fill the sequence of the given table, graph the values and check if they are linear or non-linear.
In order to do that we have to take the values of x and find the area of the rectangle.
The length and breadth values can be obtained using the given in below.
The area is then filled in the table.
A graph is to be plotted using data from the table.
Using the graph, determine whether it is linear or non-linear.
1. Value of x=1
Value of length:
2×x=2×1
=2
Value of breadth: x=1
Area: l×b=2×1
=2
2. Value of x=2
Value of length:
2×x=2×2
=4
Value of breadth: x=2
Area: l×b=4×2
=8
3. Value of x=3
Value of length:
2×x=2×3
=6
Value of breadth: x=3
Area: l×b=6×3
=18
4. Value of x=4
Value of length:
2×x=2×4
=8
Value of breadth: x=4
Area: l×b=8×4
=32
5. Value of x=5
Value of length:
2×x=2×5
=10
Value of breadth: x=5
Area:
l×b=10×5
=50
Plotting values in the table:

Graph for the given table:

Determine whether linear or non-linear
The graph does not give a straight line, therefore it is non-linear.
The values of the given table are:

The graph obtained is:

The function is linear as the graphs give a straight line.
We are given a table:
We are asked to fill the sequence of the given table, graph the values and check if they are linear or non-linear.
In order to do that we have to take the values of x and find the circumference of the circle.
The values represent the radius.
The circumference is then filled in the table.
A graph is to be plotted using data from the table.
Using the graph, determine whether it is linear or non-linear.
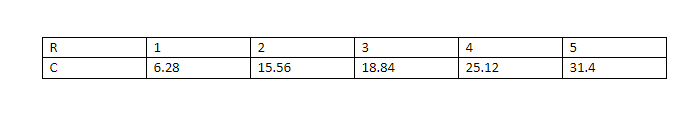
1. Value of radius:
radius r=1
Circumference: 2×π×r
=2×3.14×1
=6.28
2. Value of radius:
radius r=2
Circumference: 2×π×r
=2×3.14×2
=12.56
3. Value of radius:
radius r=3
Circumference: 2×π×3
=2×3.14×3
=18.84
4. Value of radius:
radius r=4
Circumference: 2×π×r
=2×3.14×4
=25.12
5. Value of radius:
radius r=5
Circumference: 2×π×5
=2×3.14×5
=31.4
Plotting values in the table:
Graph for the given table:

Determine whether linear or non-linear
The graph gives a straight line, therefore it is linear.
The values of the given table are:

The graph obtained is:
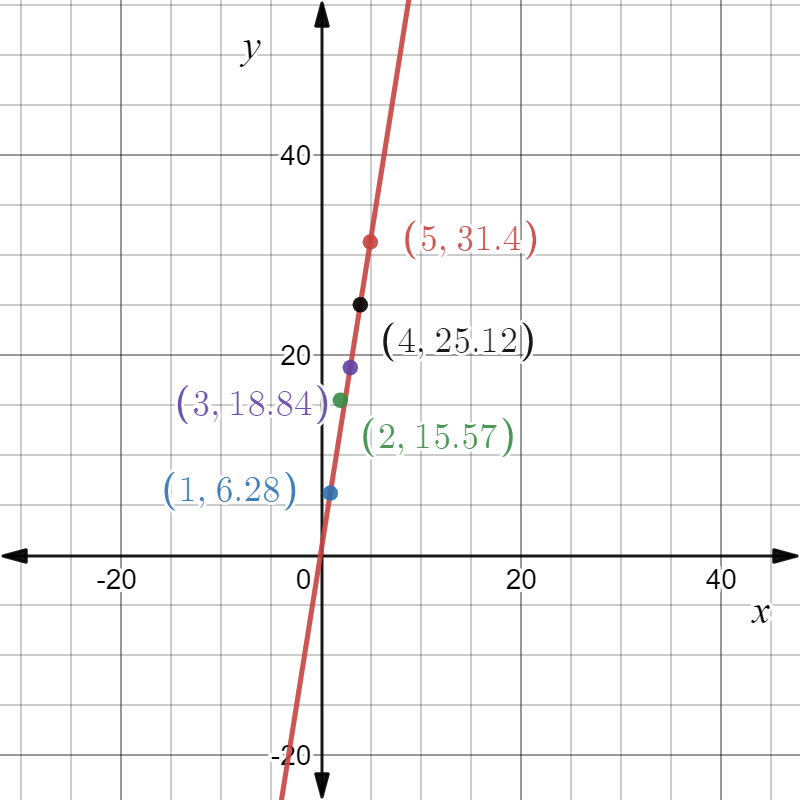
The function is linear as the graphs give a straight line.
We are given a table:
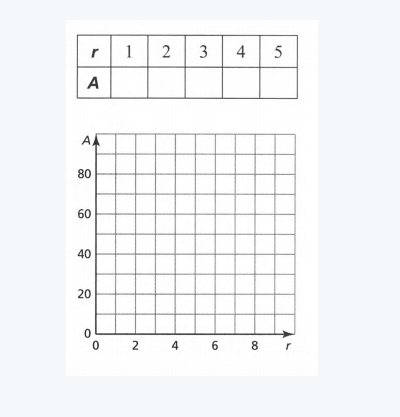
We are asked to fill the sequence of the given table, graph the values and check if they are linear or non-linear.
In order to do that we have to take the values of r and find the area of the circle.
The values represent the radius.
The area is then filled in the table.
A graph is to be plotted using data from the table.
Using the graph, determine whether it is linear or non-linear.
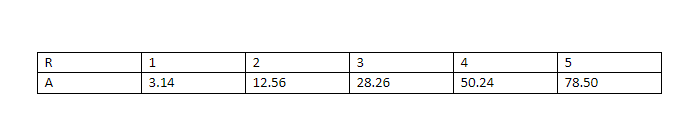
1. Value of radius:
radius r=1
Area: π×r2
=3.14×12
=3.14
2. Value of radius:
radius r=2
Area: π×r2
=3.14×22
=12.56
3. Value of radius:
radius r=3
Area: π×r2
=3.14×32
=28.26
4. Value of radius:
radius r=4
Area: π×r2
=3.14×42
=50.24
5. Value of radius:
radius r=5
Area: π×r2
=3.14×52
=78.5
Plotting values in the table:
Graph for the given table:

Determine whether linear or non-linear
The graph does not give a straight line, therefore it is non-linear.
The values of the given table are
Table :

The graph obtained is:
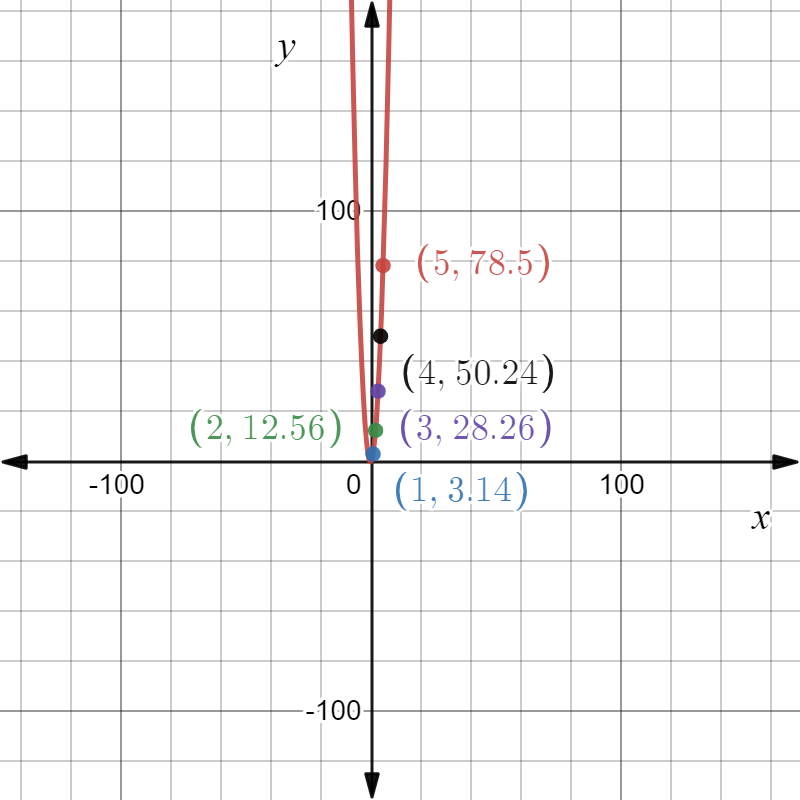
The function is non-linear as the graphs do not give a straight line.
Graphing Linear Functions Exercise 3.2 Big Ideas Math
Big Ideas Math Algebra 1 Student Journal 1st Edition Chapter 3 Graphing Linear Functions Exercise 3.2 Page 65 Exercise 2 Answer
We are asked to refer to Exercise 1.
We are asked to give a reason for the patterns in Exercise 1 to be functions.
The patterns/sequences from Exercise 1 are
The perimeter of a rectangle:
2l+2b
f(x)=2×(2x+x)
f(x)=2×(3x)
f(x)=6x
where l is length and b is a breadth
Area of a rectangle:
l×b
f(x)=2×x×x
f(x)=2×x2
Circumference of a circle:
2×π×r
f(r)=2×3.14×r
f(r)=6.28×r
Area of circle:
π×r2
f(r)=3.14×r2
They all represent a function as they all accept input in the form of or and give a proper output.
Page 65 Exercise 3 Answer
We are asked ways to determine whether a given function is linear or non-linear.
First, take out points from the function by calculating random values.
Plot the points so obtained in a graph.
If the graph gives a straight line then the function is linear.
If it does not give a straight line then the given function is non-linear.
Example:
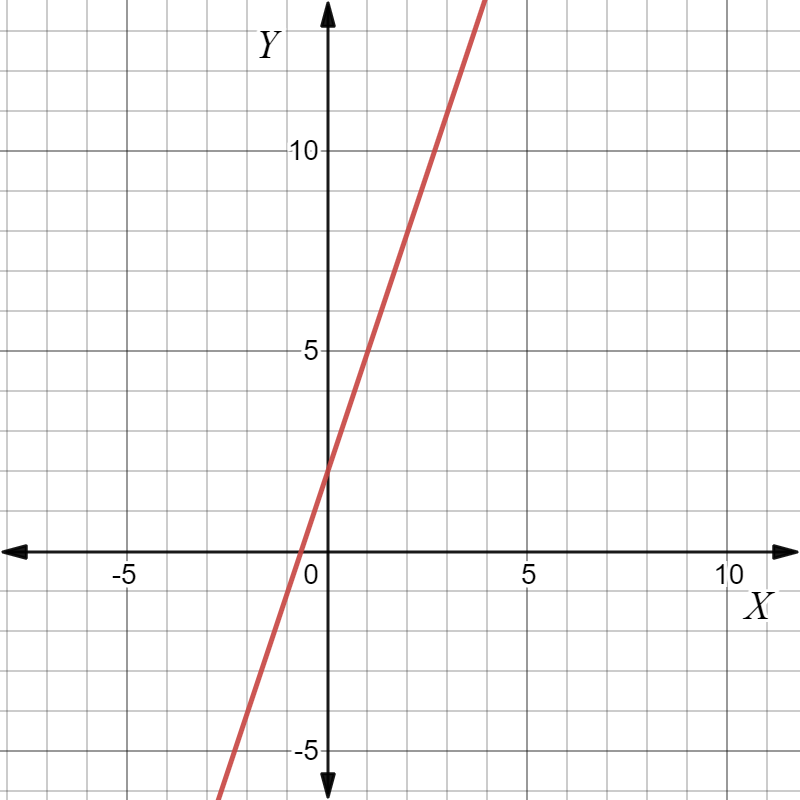
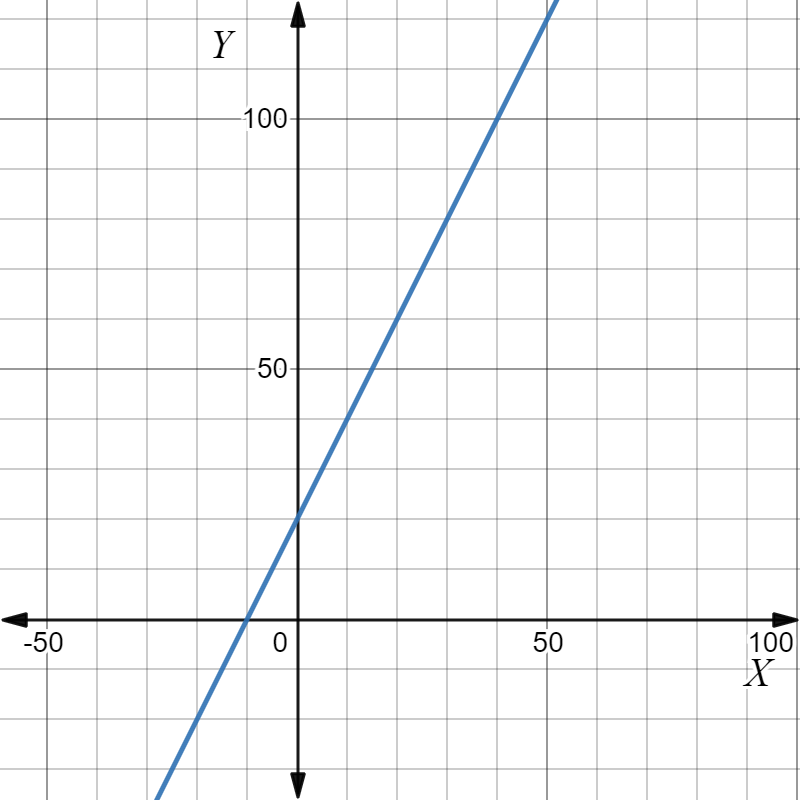
Linear function:
f(x)=2+3x
Graph:
Non-linear function:
f(x)=3+x2
Graph:
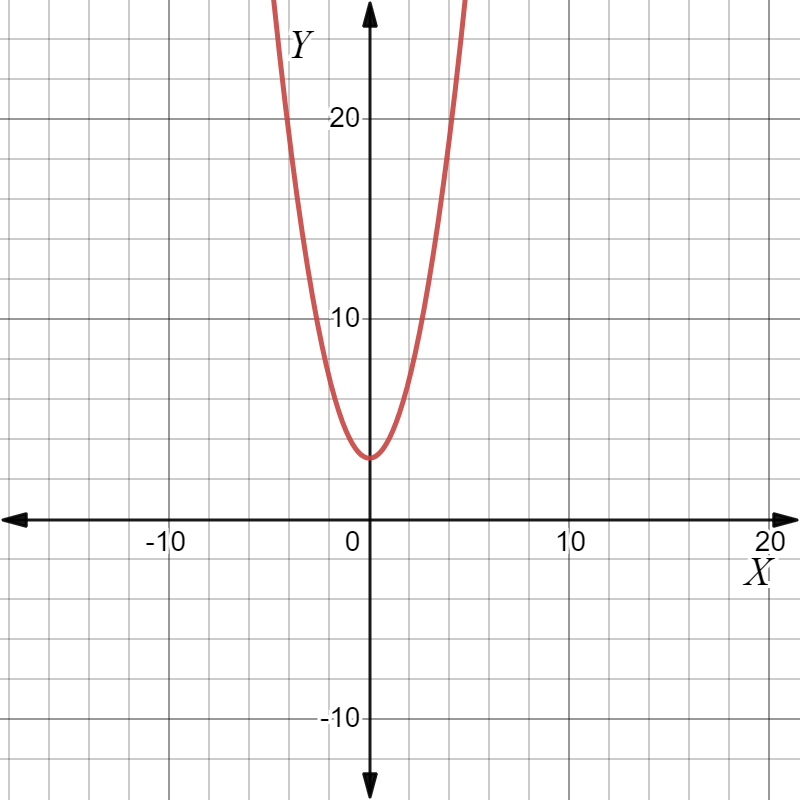
A given function is said to be linear if the graph of the function gives a straight line. A function is called non-linear if its graph does not give a straight line.
Big Ideas Math Algebra 1 Student Journal 1st Edition Chapter 3 Graphing Linear Functions Exercise 3.2 Page 65 Exercise 4 Answer
We are asked to describe two real-life patterns: one linear and one non-linear.
In order to do that we have to get any real-life incident and plot a graph to show whether it is linear or non-linear.
Linear pattern:
Suppose a kid on his birthday received a piggy bank from his grandmother.
The grandmother added 20 $ to the piggy bank before giving it as a gift.
Now the kid is collecting coins in a piggy bank.
He adds 12 $ every day.
Then the total amount inside the piggy bank gives a linear function.
Then the function can be written as
f(x)=20+2×x
where x represents the number of days.
Graph:
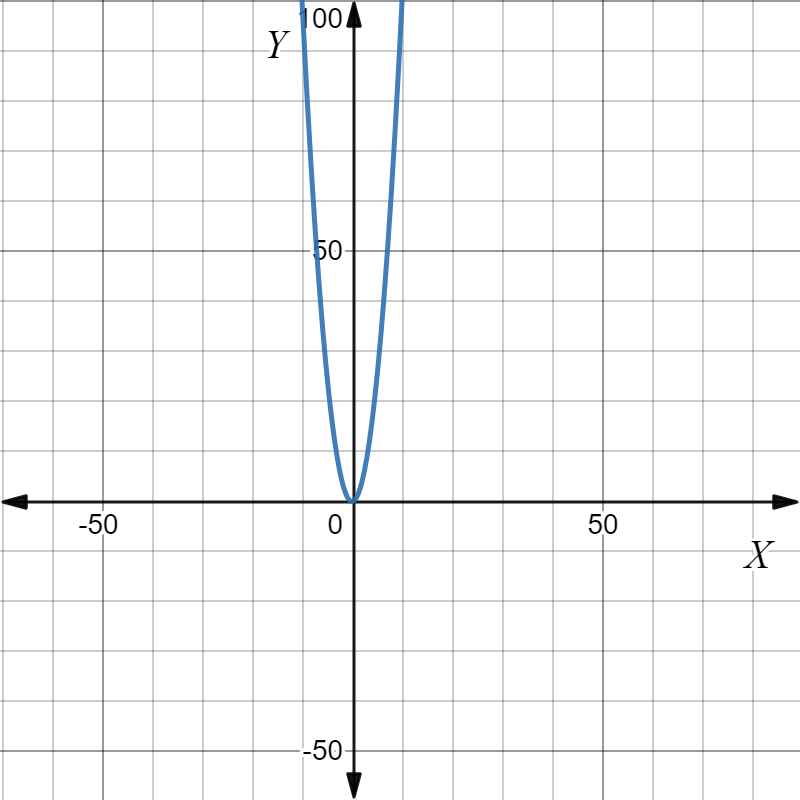
Non-linear function:
The values of weather conditions of a given place when calculated on a daily basis.
The weather of any place fluctuates every day and doesn’t remain constant.
Suppose in the Thar desert of India, the heat level in summer increases exponentially during the day and drops during the night.
Then the function can be written as
f(x)=x2
Graph:
Two real-life examples of linear and non-linear are:
Linear: A kid added 2 $ every day in his piggy bank that already contains 20 $.
Function: f(x)=20+2x.
Non-linear: The weather condition of the Thar desert in summer (rising exponentially )in terms of heat received during the day and night.
Function: f(x)=x2.
Page 68 Exercise 1 Answer
We are given a graph
We are asked to check whether the given graph is linear or non-linear.
A linear pattern when traced in a graph provides a straight line.
A non-linear pattern when traced in a graph provides curves or any other pattern that is not straight.
The graph here does not display a proper straight line.
It is non-linear.
The given graph is non-linear as it does not represent a straight line.
Algebra 1 Student Journal Chapter 3 Exercise 3.2 Answers
Big Ideas Math Algebra 1 Student Journal 1st Edition Chapter 3 Graphing Linear Functions Exercise 3.2 Page 68 Exercise 3 Answer
We are given a table
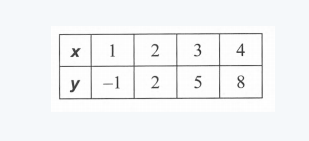
We are asked to check whether the table represents a linear function or a non-linear function.
A linear function when traced in a graph gives a straight line.
A non-linear function when traced in a graph gives a curve or any other figure that is not straight.
In order to do that we have to plot a graph with the given values.
And then check for linear or non-linear.
Graph:
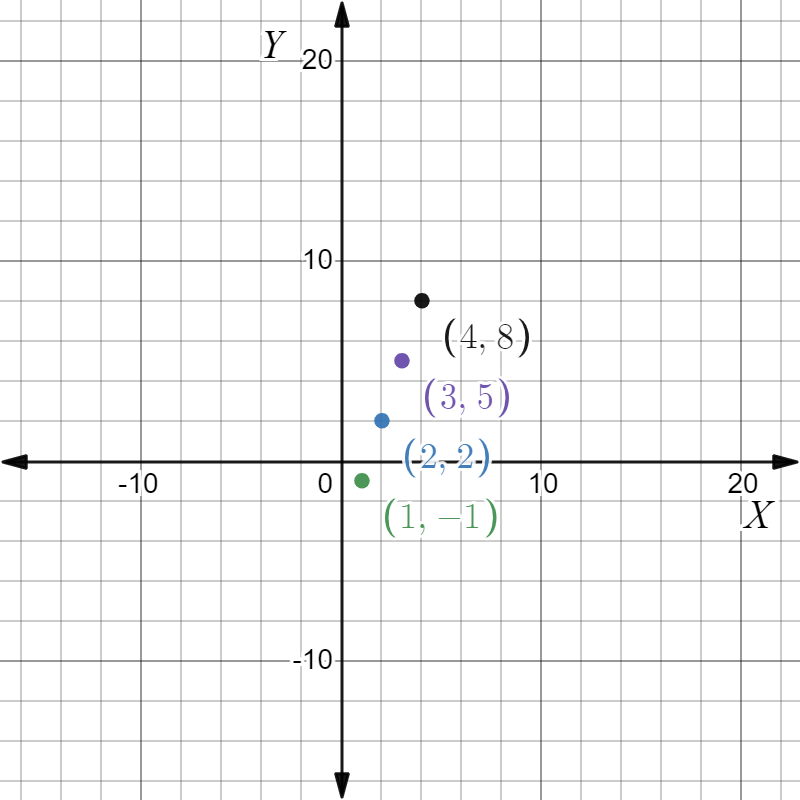
The points are linearly placed.
Hence, it is linear in nature.
The points from the table can be traced to get a straight line, displaying its linear characteristic.

Page 68 Exercise 4 Answer
We are given a table
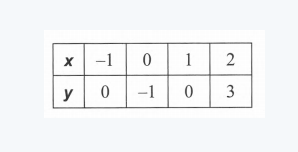
We are asked to check whether the table represents a linear function or a non-linear function.
A linear function when traced in a graph gives a straight line.
A non-linear function when traced in a graph gives a curve or any other figure that is not straight.
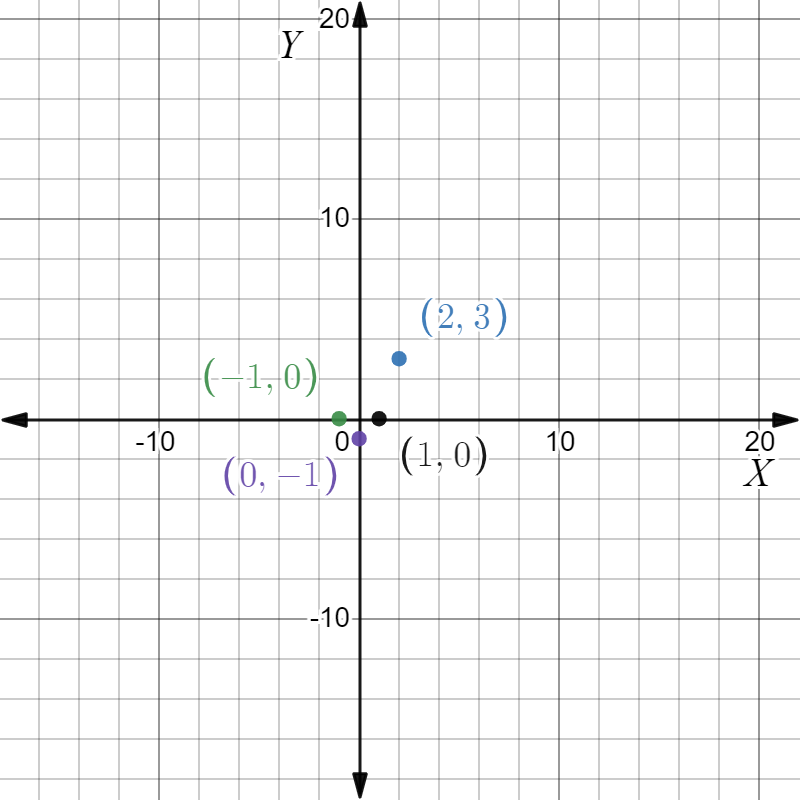
In order to do that we have to plot a graph with the given values.
And then check for linear or non-linear.
Graph:

The points are not in a straight line.
Hence the function is non-linear.
The points from the table do not produce a straight line, representing a non-linear characteristic.
Big Ideas Math Linear Functions Exercise 3.2 Help
Big Ideas Math Algebra 1 Student Journal 1st Edition Chapter 3 Graphing Linear Functions Exercise 3.2 Page 68 Exercise 5 Answer
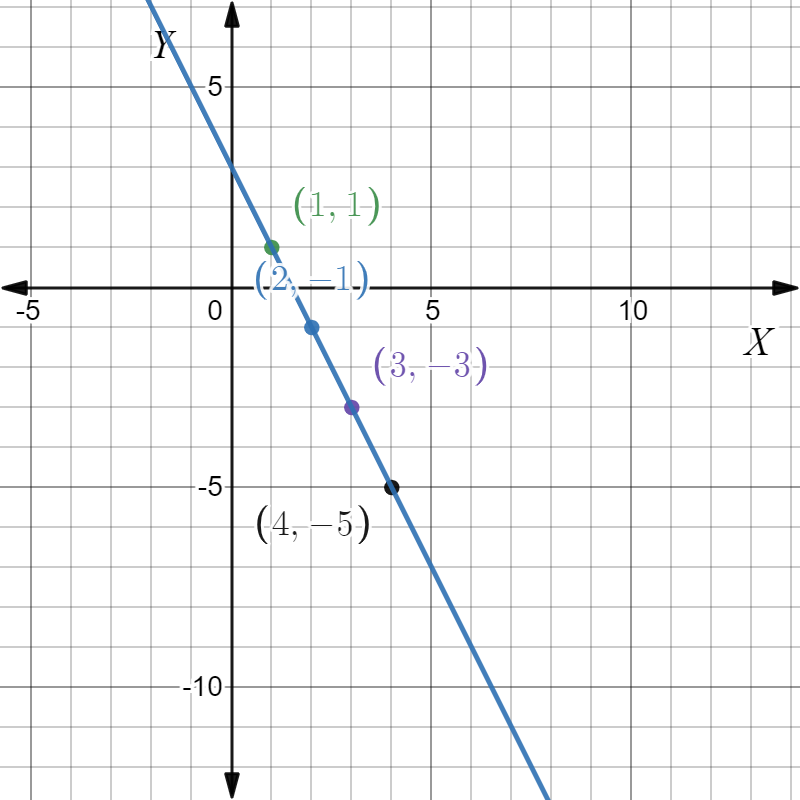
We are given a function y=3−2x.
We are asked to check whether it is linear or non-linear.
In order to do that we have to obtain points from the given equation.
Using these points we have to plot a graph.
If the points are in a straight line then the given function is linear.
If not, then the function is non-linear.
1. Value of x=1
Value of :
y=3−2x
=3−2×1
y=1
2. Value of x=2
Value of :
y=3−2x
=3−2×2
y=−1
3. Value of x=3
Value of :
y=3−2x
=3−2×3
y=−3
4. Value of x=4
Value of :
y=3−2x
=3−2×4
y=−5
Graph:

The given graph represents a straight line.
It is a linear function.
The graph for the function y=3−2x represents a straight line making the function a linear function.
Page 68 Exercise 6 Answer
We are given a function y=−\(y=-\frac{3}{4} x^3\).
We are asked to check whether it is linear or non-linear.
In order to do that we have to obtain points from the given equation.
Using these points we have to plot a graph.
If the points are in a straight line then the given function is linear.
If not, then the function is non-linear.
1. Value of x=1
Value of :
y=\(\frac{-3}{4} x^3\)
=\(\frac{-3}{4} 1^3\)
=−0.75
2. Value of x=2
Value of :
y=\(\frac{-3}{4} x^3\)
=\(\frac{-3}{4} 2^3\)
=−6
3. Value of x=3
Value of :
y=\(\frac{-3}{4} x^3\)
=\(\frac{-3}{4} 3^3\)
=−20.25
4. Value of x=4
Value of :
y=\(\frac{-3}{4} x^3\)
=−48
Graph:
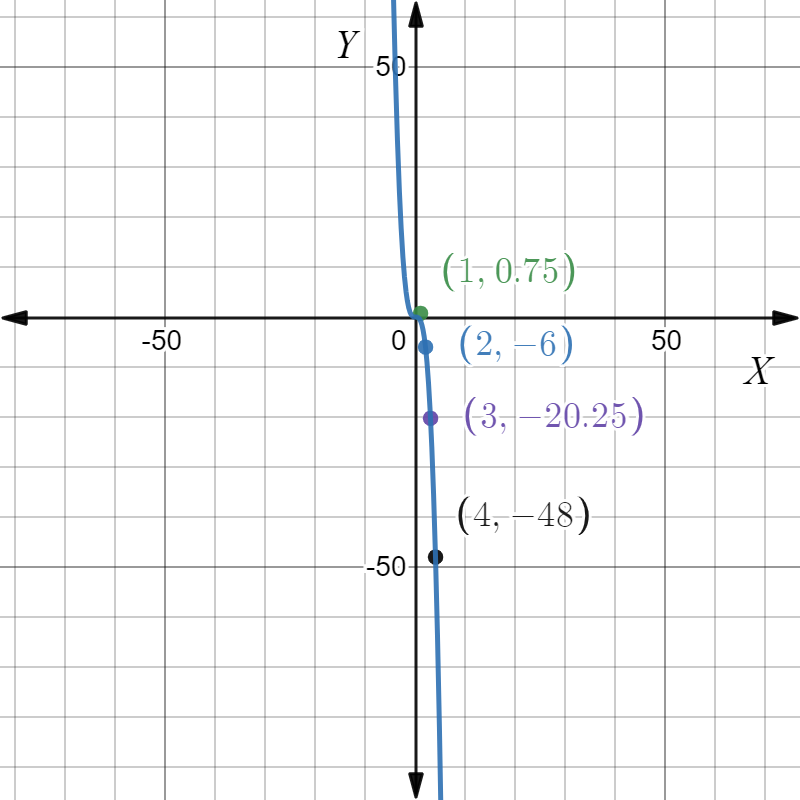
The graph does not represent a straight line.
It is non-linear.
The graph of the given function y= \(\frac{-3}{4} x^3\) does not represent a straight line, making the function a non-linear function.
Graph:

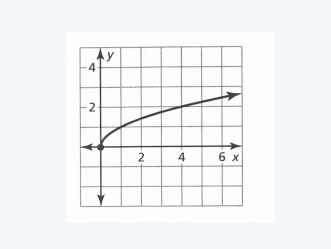
Page 68 Exercise 7 Answer
We are given a graph
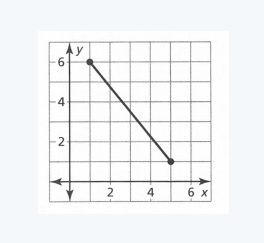
We are asked to find the domain of the function and also to determine whether the domain is discrete or continuous.
In order to do that we have to get the domain values from the graph.
Then analyze the values to check for discrete or continuous.
Domain:
The domain of a function is all the input values.
Here we have to get the values of the x-axis from the graph.
They are: (1,6)
The domain of the given graph is (1,6).
Check for discrete and continuous:
A domain is said to be discrete if the values are just points while it is called continuous if the values are continuously obtained in a range.
Domain: (1,6)
From the graph, we can trace a straight line with the following domain. They are continuous in nature as they display a range.
The given graph has a domain as (1,6).
The domain is continuous in nature.
Chapter 3 Exercise 3.2 Step-By-Step Solutions Big Ideas Math
Big Ideas Math Algebra 1 Student Journal 1st Edition Chapter 3 Graphing Linear Functions Exercise 3.2 Page 68 Exercise 8 Answer
We are given a graph
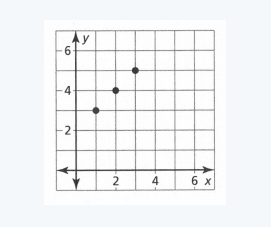
We are asked to find the domain of the function and also to determine whether the domain is discrete or continuous.
In order to do that we have to get the domain values from the graph.
Then analyze the values to check for discrete or continuous.
Domain:
The domain of a function is all the input values.
Here we have to get the values of the x-axis from the graph.
They are:(1,2,3)
It has multiple points as a domain. It does not display a range.
Check for discrete and continuous:
A domain is said to be discrete if the values are just points while it is called continuous if the values are continuously obtained in a range.
Domain: 1,2,3
The domain of the given function is in points and is not continuous. It is discrete.
The given graph has a domain of 1,2,3 points. It has a discrete domain as it does not display a range
Exercise 3.2 Big Ideas Math Algebra 1 Guide