
Algebra 1 Student Journal 1st Edition Chapter 2 Solving Linear Inequalities
Page 28 Essential Question Answer
When two values are compared, an inequality shows whether one is less than, greater than, or simply not equal to the other is known as inequality.
Inequality is the relationship between two amounts.
Here the amounts are not the same.
For example, the speed limit in highways is less than or equal to 65 miles per hour.
Inequality in real life may be stated as the speed limit in highways is less than or equal to 65 miles per hour.
Read and Learn More Big Ideas Math Algebra 1 Student Journal 1st Edition Solutions
Page 28 Exercise 1 Answer
Given: The graph
To find: The temperature t in Sweden is at least−10∘ C.
Evaluate to get the final answer.
If t is temperature it will be represented as the symbol ≥.
The inequality will be t ≥−10.
Graphically it will be represented as

The graphical representation of the inequality t≥−10 is

Given: The graph
To find: The elevation e of Alabama is at most 2047 feet.
Evaluate to get the final answer.
If e is elevation of Alabama it will be represented as the symbol ≤.
The inequality will be: e≤2047.
Graphically it will be represented as
The graphical representation of the inequality e≤2047 is
Big Ideas Math Algebra 1 Chapter 2 Exercise 2.1 Solution
Big Ideas Math Algebra 1 Student Journal 1st Edition Chapter 2 Solving Linear Inequalities Exercise 2.1 Page 28 Exercise 2 Answer
Given: The graph
To find The values of x.
Evaluate to get the final answer.
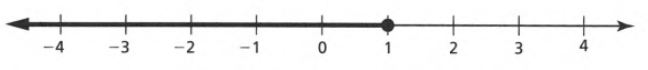
In the graph, we can see that x is at least 1.
Or x is greater than or equal to 1
We can depict it as x≥1.
Graphically we can represent it as
In words, we can write x is less than or equal to 1 graphically x≥1 can be represented as

Given: The graph
To find The values of x.
Evaluate to get the final answer.
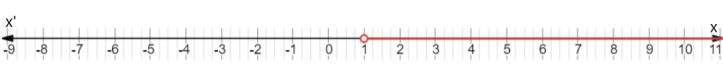
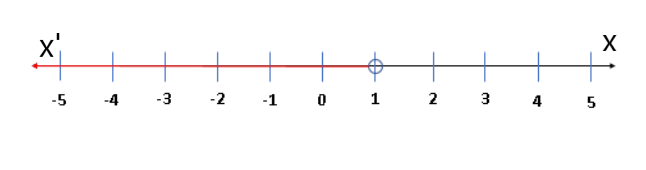
In the graph, we can see that x is always greater than 1.
We can depict it as x>1.
Graphically we can represent it as
In words, all the values of x that satisfy the given situation is x
is always greater than 1 graphically x>1 c an be represented as

Given: The graph
To find The values of x.
Evaluate to get the final answer.
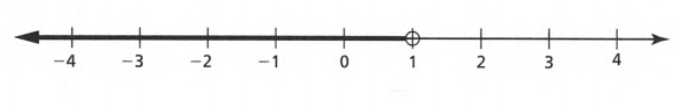
In the graph, we can see that x is always greater than or equal to 1.
We can depict it as x≤1.
Graphically we can represent it as
In words, we can write that x is less than or equal to 1 graphically x≤1
Can be represented as

Given: The graph

To find The values of x.
Evaluate to get the final answer.
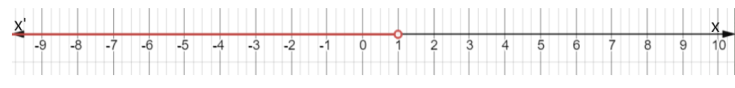
In the graph, we can see that x is always greater than 1.
We can depict it as x<1.
Graphically we can represent it as
Graphically x<1 is represented as

Solving Linear Inequalities Exercise 2.1 Big Ideas Math
Big Ideas Math Algebra 1 Student Journal 1st Edition Chapter 2 Solving Linear Inequalities Exercise 2.1 Page 29 Exercise 3 Answer
When two values are compared, an inequality shows whether one is less than, greater than, or simply not equal to the other is known as inequality.
Inequality is the relationship between two amounts.
Here the amounts are not the same.
For example, the speed limit in highways is less than or equal to 65 miles per hour.
Inequality in real life may be stated as the speed limit in highways is less than or equal to 65 miles per hour.
Page 31 Exercise 3 Answer
Let the number be q.
The inequality to represent seven is less than or equal to the difference of a number and 6 is 7<q−6.
The representation of seven is less than or equal to the difference of a number and 6 is 7<q−6.
Big Ideas Math Algebra 1 Student Journal 1st Edition Chapter 2 Solving Linear Inequalities Exercise 2.1 Page 31 Exercise 4 Answer
Let the number be u.
The inequality to represent the sum of a number and 14 is more than 6 is u+14>6.
The representation of the sum of a number and 14 is more than 6 is u+14>6.
Page 31 Exercise 5 Answer
Given: The inequality d−7<12.
To find The value=19.
Evaluate to get the final answer.
We will substitute d=12 in the given inequality.
Then, it will be evaluated as 19−7<12 12<12
So,d=12 is not a solution for the given equality.
The value d=12 is not a solution for the given inequality.
Page 31 Exercise 6 Answer
Given: The inequality 9≥3n+6.
To find The value n=1.
Evaluate to get the final answer.
We will substitute n=1 in the given inequality.
Then, it will be evaluated as:
9≥3n+6
9≥3(1)+6
9≥3+6
9≥9
So,n=1 is a solution for the given equality.
The value n=1 is a solution for the given equality.
Algebra 1 Student Journal Chapter 2 Exercise 2.1 Answers
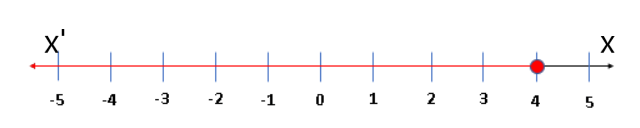
Big Ideas Math Algebra 1 Student Journal 1st Edition Chapter 2 Solving Linear Inequalities Exercise 2.1 Page 31 Exercise 8 Answer
Given: The graph
To find The inequality in the graph.
Evaluate to get the final answer.
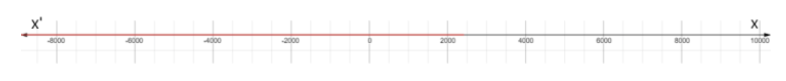
The inequality x≤4 will be plotted in the graph.
It will be shown as

The inequality x≤4 will be marked in the graph as
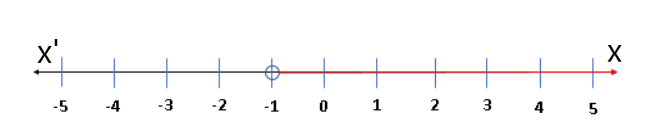
Page 32 Exercise 9 Answer
Given: The graph
To find The inequality in the graph.
Evaluate to get the final answer.
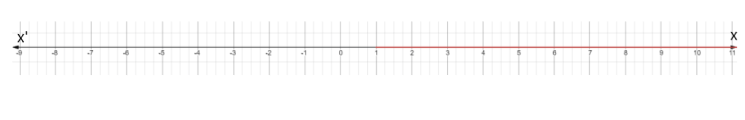
The inequality x>−1 will be plotted in the graph.
It will be shown as

The inequality x>−1 will be marked in the graph as

Big Ideas Math Algebra 1 Student Journal 1st Edition Chapter 2 Solving Linear Inequalities Exercise 2.1 Page 32 Exercise 10 Answer
Given: The graph
To find The inequality in the graph.
Evaluate to get the final answer.
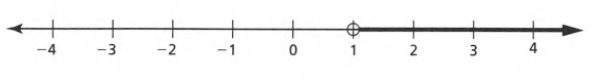
The inequality x<1 will be plotted in the graph.
It will be shown as:
The inequality x<1 will be marked in the graph as
Page 32 Exercise 11 Answer
Given: The graph

To find: The inequality marked in the graph.
Evaluate to get the final answer.
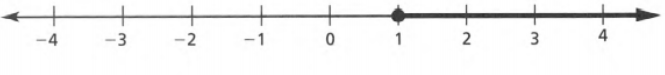
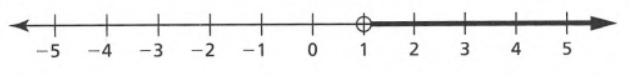
The dot is marked at 1 and the graph is shifting towards right.
It means that x is greater than 1.
The inequality to represent the graph is x>1.
We will observe the graph

The graph states thatx>1.
Big Ideas Math Linear Inequalities Exercise 2.1 Help
Big Ideas Math Algebra 1 Student Journal 1st Edition Chapter 2 Solving Linear Inequalities Exercise 2.1 Page 32 Exercise 13 Answer
Given: The graph
To find: The inequality marked in the graph.
Evaluate to get the final answer.
The dot is marked at−3 and the graph is shifting toward right.
It means that x is greater than equal to−3.
The inequality to represent the graph is x≥−3.
We will observe the graph.
The graph states that x≥−3.
Page 32 Exercise 14 Answer
Here since the dot is at 3 and the dot is filled in.
Which could be equal to 3 and the graph is filled into the left.
Therefore x is less than or equal to 3.
An inequality that represents the given graph is x≤3.
Chapter 2 Exercise 2.1 Step-By-Step Solutions Big Ideas Math