Financial Algebra 1st Edition Chapter 2 Modeling a Business
Page 108 Problem 1 Answer
Some states about Touchpad Company: Hewlett Packard
Year released: 2011
Revenue yr. released: $126.0 billion
Touchpad Introduced in July 2011, the TouchPad was Hewlett Packard′s attempt to compete with Apple′s iPad.
With powerful video capability and impressive Processing speeds, the TouchPad was widely anticipated to be among the only products that could give Apple a run for its money.
Despite large-scale press events and promotions, the HP TouchPad was a colossal failure and was discontinued almost immediately.
As a result of the TouchPad′s failure, the company wrote off $885 million in assets and incurred an additional $755 million in costs to wind down its webOS operations, ending all work on the Touchpad’s failed operating system.
Since then, HP has continued to struggle to maintain its edge in the PC market. The once−dominant PC company is in the midst of a multi−year turnaround plan.
While the plan may have recently begun to bear fruit, investors remain cautious.
Name of the product is : Touchpad
The reason behind its rise and fall are mentioned above. The answers of individuals may vary.
Read and Learn More Cengage Financial Algebra 1st Edition Answers

Page 109 Problem 2 Answer
The assessment involves an interview of a local businessperson.
Ask for examples of fixed and variable expenses. Do not ask for amounts as that information is private.
Make a comprehensive list. Also ask about the history of the business and how he or she became involved in it.
The interview of a business person is as follows
The most common fixed expenses are
Rent
Salaries
Electricity bill
Water bill
Natural gas bill
Telephone bill
Transportation
Property expenses
InsuranceInterest expenses etc
Variable Expenses
Raw materials for the production of some product
Credit card fees
Commissions supplies and
production piece rate labor etc
The answer of individuals may vary.
Page 109 Problem 3 Answer
Report is as follows
The top 10 Best Selling Beatles singles are:
She Loves You
Want To Hold Your Hand
Can′t Buy Me Love
I Feel Fine
Day Tripper/We Can Work It Out
Hey Jude
Help!
From Me To You
Hello Goodbye
Get back
According to some Statistics found online, the Beatles earned approximately 71 million dollars this year and thus it appears that Decca′s decision was a wrong decision as the Beatles were a lot more profitable than expected in 1962.
If a product is released at the wrong time (too early or too late), then the product is more likely to fail.
Decca′s decision was based on the fact that guitar groups were expected to no longer be popular, while this was not the case and thus Decca′s decision was based on the wrong timing.
Answers of individuals may vary.
Page 109 Problem 4 Answer
Report is as follows
A brand name is a name given to a product or a range of products by the maker of the products.
For this assignment, you will need to get two copies of the same newspaper or magazine.
Then you will need to read through the newspaper/magazine to determine all brand names that are mentioned in the newspaper.
There are many possible brand names that will be mentioned.
For example, some of the most famous brand names are Coca-Cola, Lays, Lego, Burger King, McDonald′s, Google, Yahoo, Amazon, etc.
In general, I suspect that you will find dozens of different brand names in a newspaper or magazine.
Answers of the individuals may vary.
Cengage Financial Algebra 1st Edition Chapter 2 Assessment Modeling A Business Solutions
Page 109 Problem 5 Answer
Assessment is as follows
There are many different breakeven calculators available only. If you search for ”Breakeven calculator” using a search engine, then you will find many possible calculators.
For example, some breakeven calculators are:
https://www.calcxml.com/do/breakeven−analysis
https://goodcalculators.com/break−even−calculator/
https://www.omnicalculator.com/business/break−even
The calculator of calc xml requires the total fixed costs, the variable cost per unit, the sales price per unit and the anticipated unit sales.
The calculator will then return how many units you need to sell to cover your costs and your expected profit/loss and the expected number of sold units.
The calculator of good calculators requires the same input. The calculator will calculate your break even units, total costs, net profit and total revenue.
Moreover, the calculator will also create a table of possible units solds and the corresponds costs/profit.
The calculator of omnicalculators require the per unit costs and the fixed costs, but the calculator also allows us to take into account a markup or sell margin.
The calculator will then return us how many units need to be sold to breakeven and returns the corresponding revenue.
The answers of individuals may vary.
Page 109 Problem 6 Answer
Report is as follows
A profit is a financial benefit which is the result of revenue gained from business activity reduced by costs/expenses/taxes.
Profit is calculated as total revenue decreased by total expenses.
However different companies tend to define a profit in different manners.
The difference often lies in what is included in the total expenses/revenue and what is not included.
For example, some companies will include dividends paid out to shareholders as expenses (while other companies won′t), while other companies will not include the interest and taxes in their profit calculations (as they are interested in the profit when not taking into account the interest and taxes), etc.
Answers of individuals may vary.
Page 109 Problem 7 Answer
The fixed costs are costs that are constant no matter how many units you produce. Some possible fixed costs for a lemonade stand are then:
Setting up the stand (such as a table, chairs, etc.).
Creating a sign (such that people know that they can buy lemonade at the stand and how much it costs) etc
The variable costs are costs that depend on how many units you produce. Some possible variable costs for a lemonade stand are then:
Ingredients for lemonade: lemons, water, sugar
Plastic cups (to serve the lemonade in)
Containers for the lemonade (before being served). etc
The price at which you sell your lemonade should cover your fixed and variables costs.
You should determine the fixed and variables costs per unit (glass of lemonade) by dividing the total costs by expected the number of sold units (glasses of lemonade).
The price per glass of lemonade should then exceed the total costs per unit (glass of lemonade)
Answers of individuals may vary.
Page 110 Problem 8 Answer
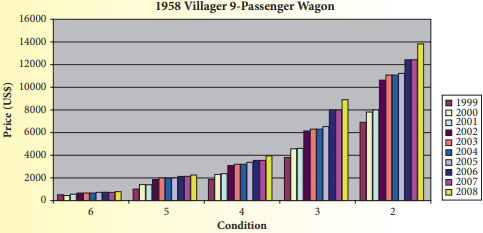
We have given The following bar graph that gives the values of a 1958 Edsel Villager 9-Passenger Station Wagon during the years 1999-2008.
Because the value depends on the condition of the car, car appraisers rate the condition of a classic car.
On this graph, Condition 2 is the best condition and Condition 6 is the poorest condition.
The bar graph is
Here we will examine the bar graph and find the approximate value for the 1958 Villager in a condition of 6 in 2008 .
We note that condition 6 is at the very left side of the bar graph.
And the yellow column shows the condition of the car in 2008.
Thus approximate value for the 1958 Villager in a condition of 6 in 2008 = $800
The answer may vary because be take an approximate value.
The approximate value for the 1958 Villager in a condition of 6 in 2008 = $800
Page 110 Problem 9 Answer
We have given The following bar graph that gives the values of a 1958 Edsel Villager 9-Passenger Station Wagon during the years 1999-2008.
Because the value depends on the condition of the car, car appraisers rate the condition of a classic car.
On this graph, Condition 2 is the best condition and Condition 6 is the poorest condition.
The bar graph is

Here we will examine the bar graph and find the approximate value for the 1958 Villager in a condition of 2 in 2008 .
We note that condition 2 is at the very left side of the bar graph.
And the yellow column shows the condition of the car in 2008.
Thus approximate value for the 1958 Villager in a condition of 2 in 2008 = $14,000
The answer may vary because be take an approximate value.
The approximate value for the 1958 Villager in a condition of 6 in 2008 = $14,000
Page 110 Problem 10 Answer
We have given The following bar graph that gives the values of a 1958 Edsel Villager 9-Passenger Station Wagon during the years 1999-2008.
Because the value depends on the condition of the car, car appraisers rate the condition of a classic car.
On this graph, Condition 2 is the best condition and Condition 6 is the poorest condition.
The bar graph is

Here we will examine the bar graph and find the approximate difference between a 1958 Villager in a condition of 6 and in a condition of 2 in 2008.
From last two part we have
The approximate value for the 1958 Villager in a condition of 6 in 2008 = $800
The approximate value for the 1958 Villager in a condition of 2 in 2008 = $14,000
Thus the approximate difference between a 1958 Villager in a condition of 6 and in a condition of 2 in 2008 is
$14,000− $800
= $13,200
The answer may vary because be take an approximate value.
The approximate difference between a 1958 Villager in a condition of 6 and in a condition of 2 in 2008 is $13,200
Cengage Financial Algebra Chapter 2 Assessment Modeling A Business Answers
Page 110 Problem 11 Answer
We have given The following bar graph that gives the values of a 1958 Edsel Villager 9-Passenger Station Wagon during the years 1999-2008.
Because the value depends on the condition of the car, car appraisers rate the condition of a classic car.
On this graph, Condition 2 is the best condition and Condition 6 is the poorest condition.
The bar graph is

Here we will examine the bar graph and find the approximate difference between a 1958 Villager in a condition of 2 in 1999 and in 2008.
From the bar graph we have
The approximate value for the 1958 Villager in a condition of 2 in 1999 = $7000
The approximate value for the 1958 Villager in a condition of 2 in 2008 = $14,000
Hence difference is = $14,000 −$7000 = $7000
The answer may vary because be take an approximate value.
The approximate difference between a 1958 Villager in a condition of 2 in 1999 and in 2008 is $7000
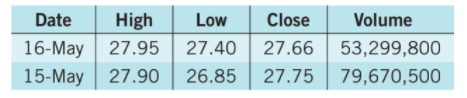
Page 111 Problem 12 Answer
Given scatter plot is

Here for identifying the correlation we will join the given point and check the slope.
If slope is positive then correlation is “positive correlation”.
If slope is negative then correlation is “negative correlation”.
If the line that going through the data points is horizontal then correlation is “no correlation”.
The scatter plot is
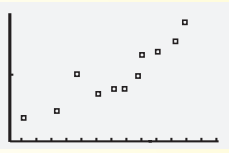
If we sketch a line through the given data points, this line will be increasing (positive slope) and thus the data shows a positive correlation.
The given scatter plot shows “positive correlation”.
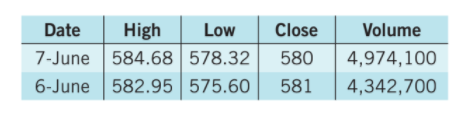
Page 111 Problem 13 Answer
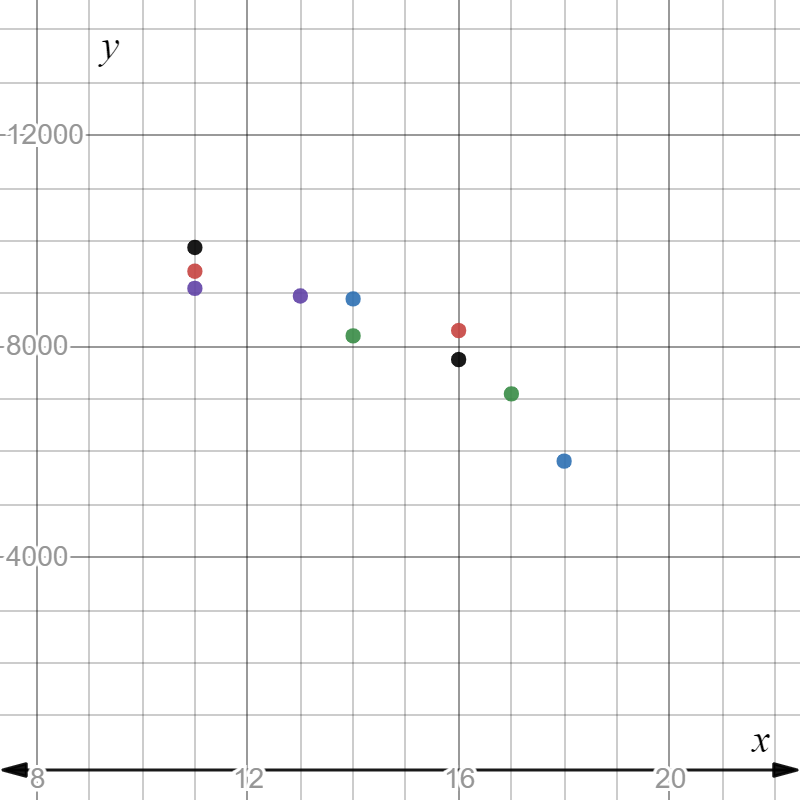
We have given scatter plot

Here for identifying the correlation we will join the given point and check the slope.
If slope is positive then correlation is “positive correlation”.
If slope is negative then correlation is “negative correlation”.
If the line that going through the data points is horizontal then correlation is “no correlation”.
The given scatter plot is
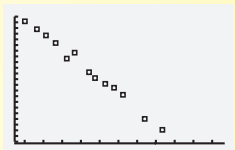
If we sketch a line through the given data points, this line will be increasing (negative slope) and thus the data shows negative correlation.
The given scatter plot shows “negative correlation”.
Page 111 Problem 14 Answer
Given scatter plot is
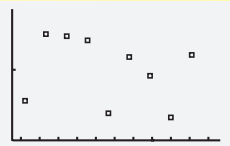
Here for identifying the correlation we will join the given point and check the slope.
If slope is positive then correlation is “positive correlation”.
If slope is negative then correlation is “negative correlation”.
If the line that going through the data points is horizontal then correlation is “no correlation”.
The scatter plot is

If we sketch a line through the given data points, this line will be increasing (positive slope) and thus the data shows a positive correlation.
The given scatter plot shows “no correlation”.
Page 111 Problem 15 Answer
Given scatter plots are:

Need to tell which of the following scatter plots does not show a line of best fit.
As a line of best fit is a single line that best fits the scattered points.
The scatter plot(b) consist two lines segments, thus, consists of scattered points that do not lie on the same line.
Whereas in scatter plot(a) and© all the scattered points that lie on the same line.
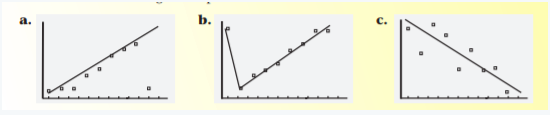
For the scatter plots:
The scatter plot(b) does not show a line of best fit.
Page 111 Problem 16 Answer
Given correlation coefficient,r=0.17 .
Need to describe the given correlation coefficient using the terms strong, moderate, or weak and positive or negative.
As r=0.17 is positive, thus, the correlation is positive.
The absolute value of the given correlation coefficient,∣r∣=0.17, is less than 0.3, thus, the correlation is weak.
The correlation coefficient, r=0.17, represents a positive and weak correlation.
Page 111 Problem 17 Aswer
Given correlation coefficient,r=−0.62.
Need to describe the given correlation coefficient using the terms strong, moderate, or weak and positive or negative.
As r=−0.62 is negative, thus, the correlation is negative.
The absolute value of the given correlation coefficient is,∣r∣=0.62, and satisfies0.3≤r≤0.75, thus, the correlation is moderate.
The correlation coefficient,r=−0.62, represents a negative and moderate correlation.
Solutions For Cengage Financial Algebra Chapter 2 Assessment Modeling A Business
Page 111 Problem 18 Answer
Given the correlation coefficient,r=−0.88
Need to describe the given correlation coefficient using the terms strong, moderate, or weak and positive or negative.
As r=−0.88 is negative, thus, the correlation is negative.
The absolute value of the given correlation coefficient,∣r∣=0.88 , is more than0.75, thus, the correlation is strong.
The correlation coefficient,r=−0.88 , represents a negative and strong correlation.
Page 111 Problem 19 Answer
Given correlation coefficient,r=0.33
Need to describe the given correlation coefficient using the terms strong, moderate, or weak and positive or negative.
As r=0.33 is positive, thus, the correlation is positive.
The absolute value of the given correlation coefficient is,∣r∣=0.33, and satifies 0.3≤r≤0.75, thus, the correlation is moderate.
The correlation coefficient, r=0.33, represents a positive and moderate correlation.
Page 111 Problem 20 Answer
Given correlation coefficient, r=0.49.
Need to describe the given correlation coefficient using the terms strong, moderate, or weak and positive or negative.
As r=0.49 is positive, thus, the correlation is positive.
The absolute value of the given correlation coefficient is,∣r∣=0.49 , and satisfies 0.3≤r≤0.75, thus, the correlation is moderate.
The correlation coefficient, r=0.49, represents a positive and moderate correlation.
Page 111 Problem 21 Answer
Given correlation coefficient,r=−0.25.
Need to describe the given correlation coefficient using the terms strong, moderate, or weak and positive or negative.
As r=−0.25
is negative, thus, the correlation is negative. The absolute value of the given correlation coefficient,
∣r∣=0.25, is less than 0.3, thus, the correlation is weak.
The correlation coefficient,r=−0.25, represents a negative and weak correlation.
Page 111 Problem 22 Answer
Given correlation coefficient,r=0.91.
Need to describe the given correlation coefficient using the terms strong, moderate, or weak and positive or negative.
As r=0.91 is positive, thus, the correlation is positive.
The absolute value of the given correlation coefficient, ∣r∣=0.91, is more than0.75, thus, the correlation is strong.
The correlation coefficient,r=0.91, represents a positive and strong correlation.
Page 112 Exercise 1 Answer
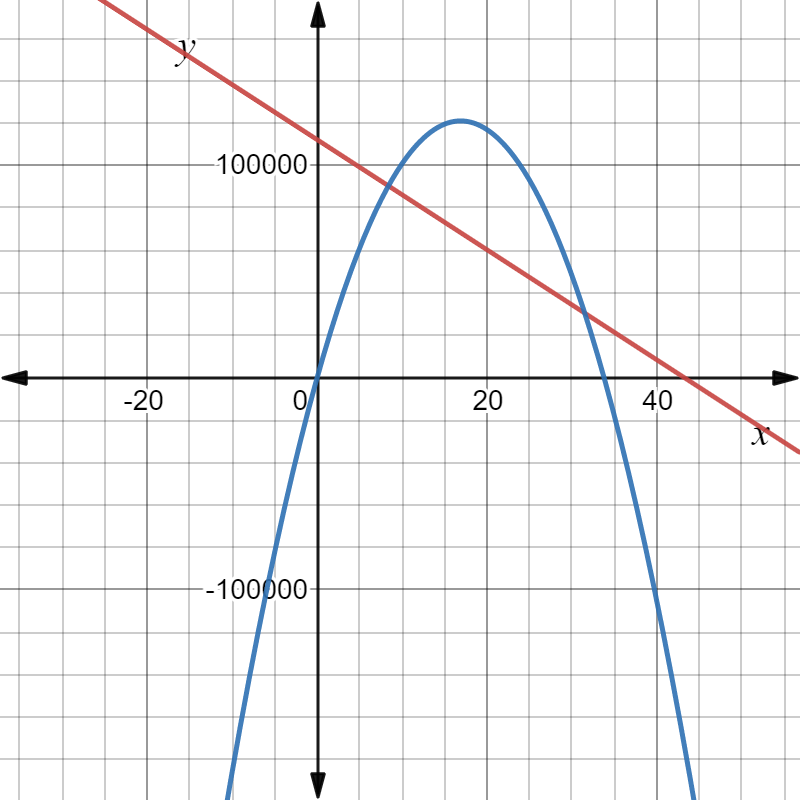
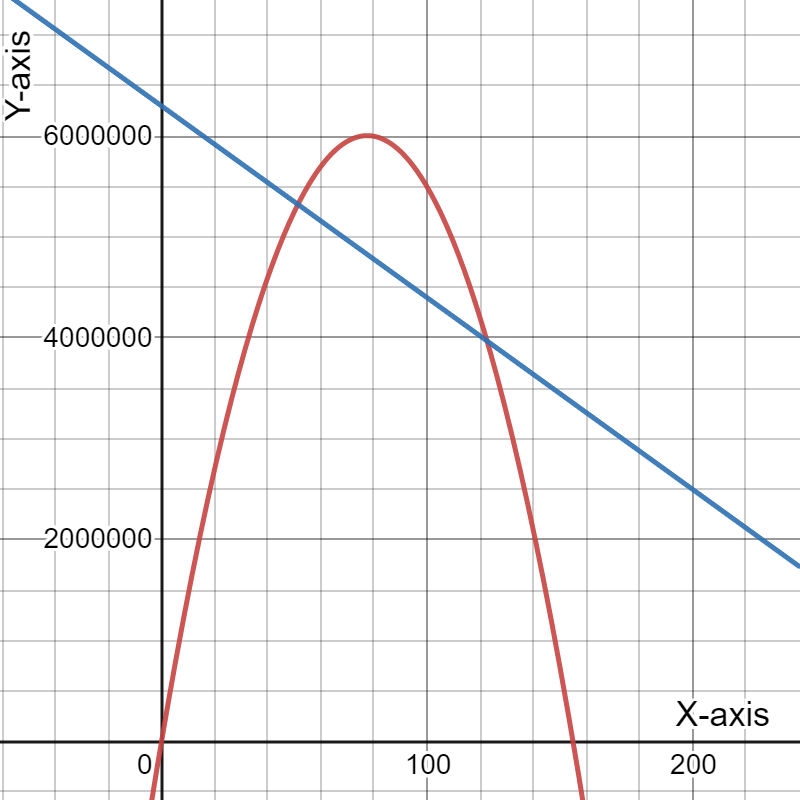
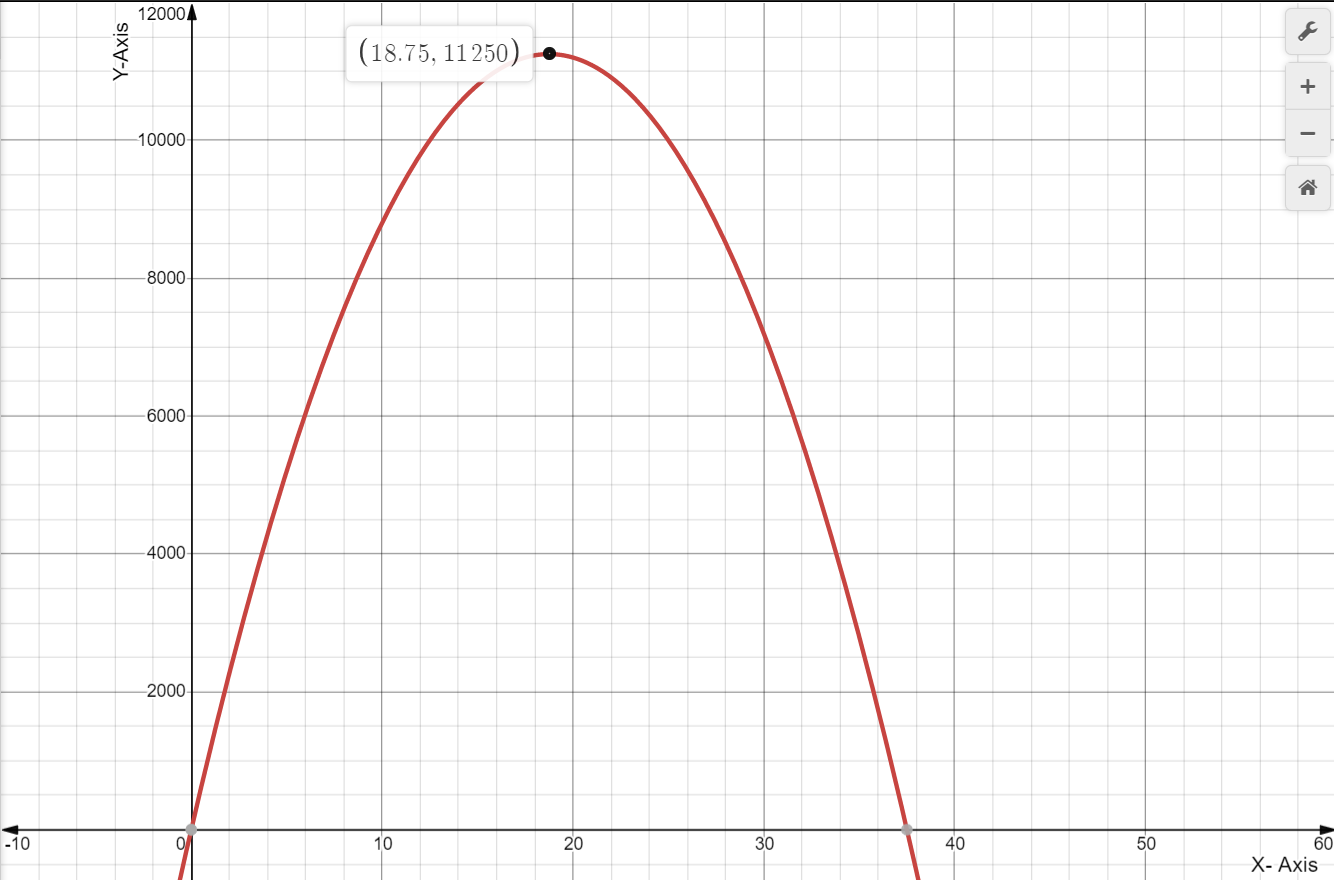
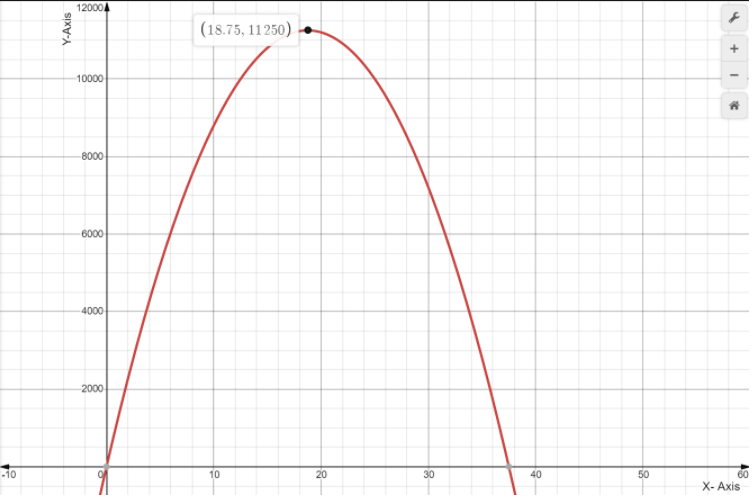
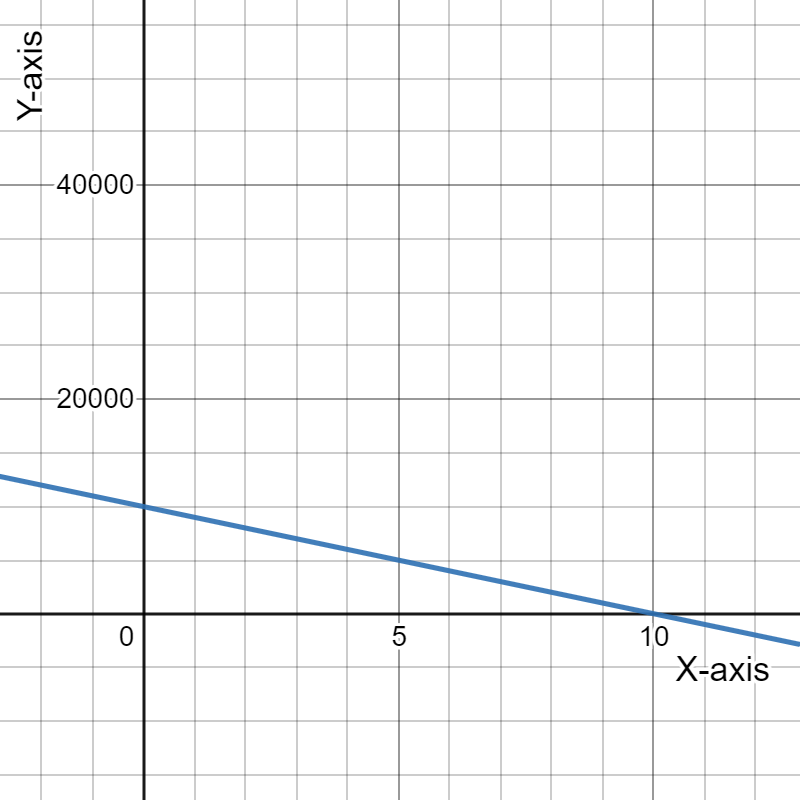
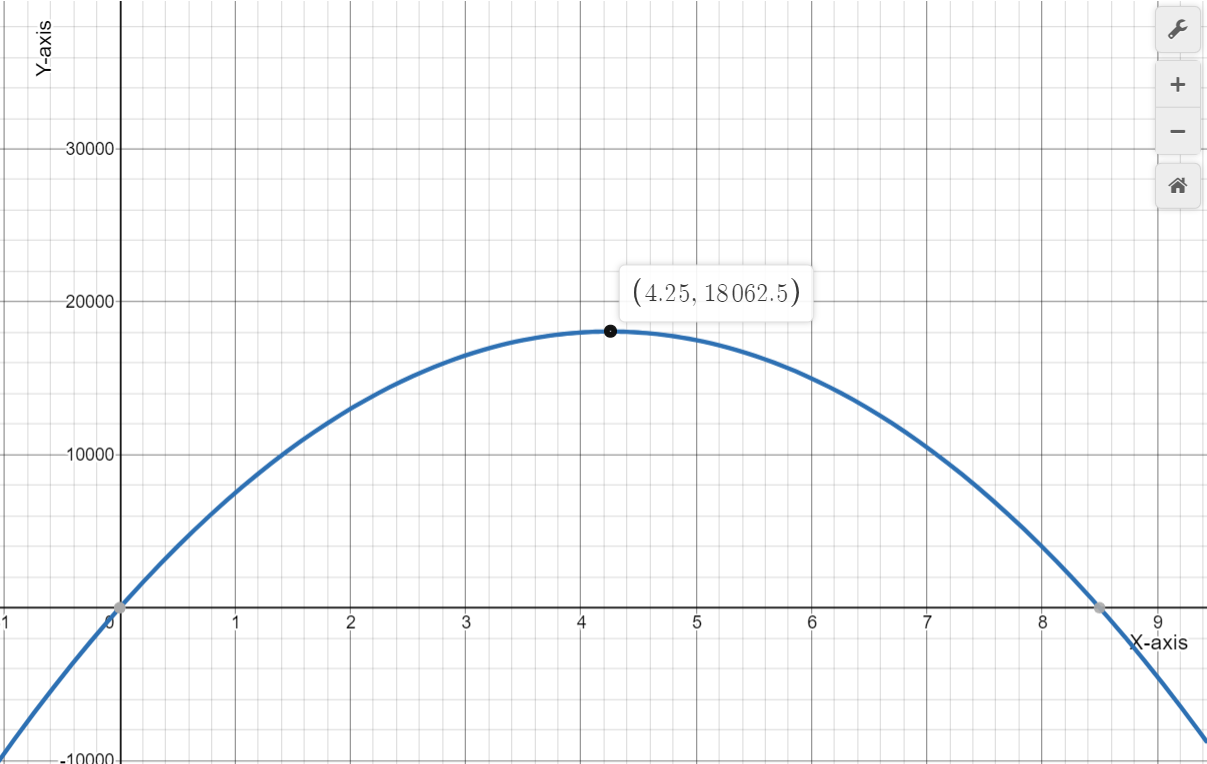
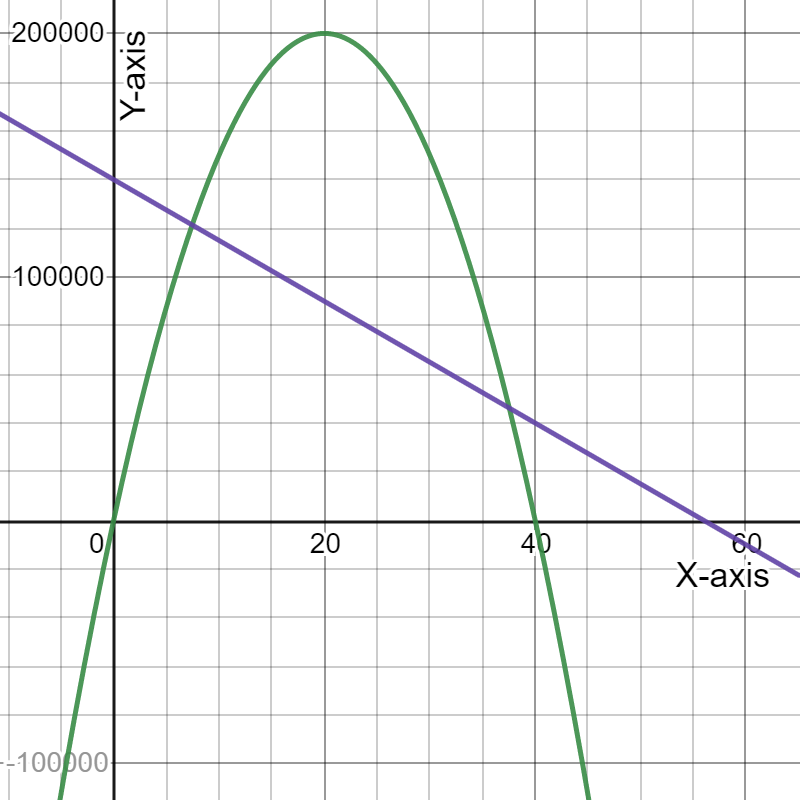
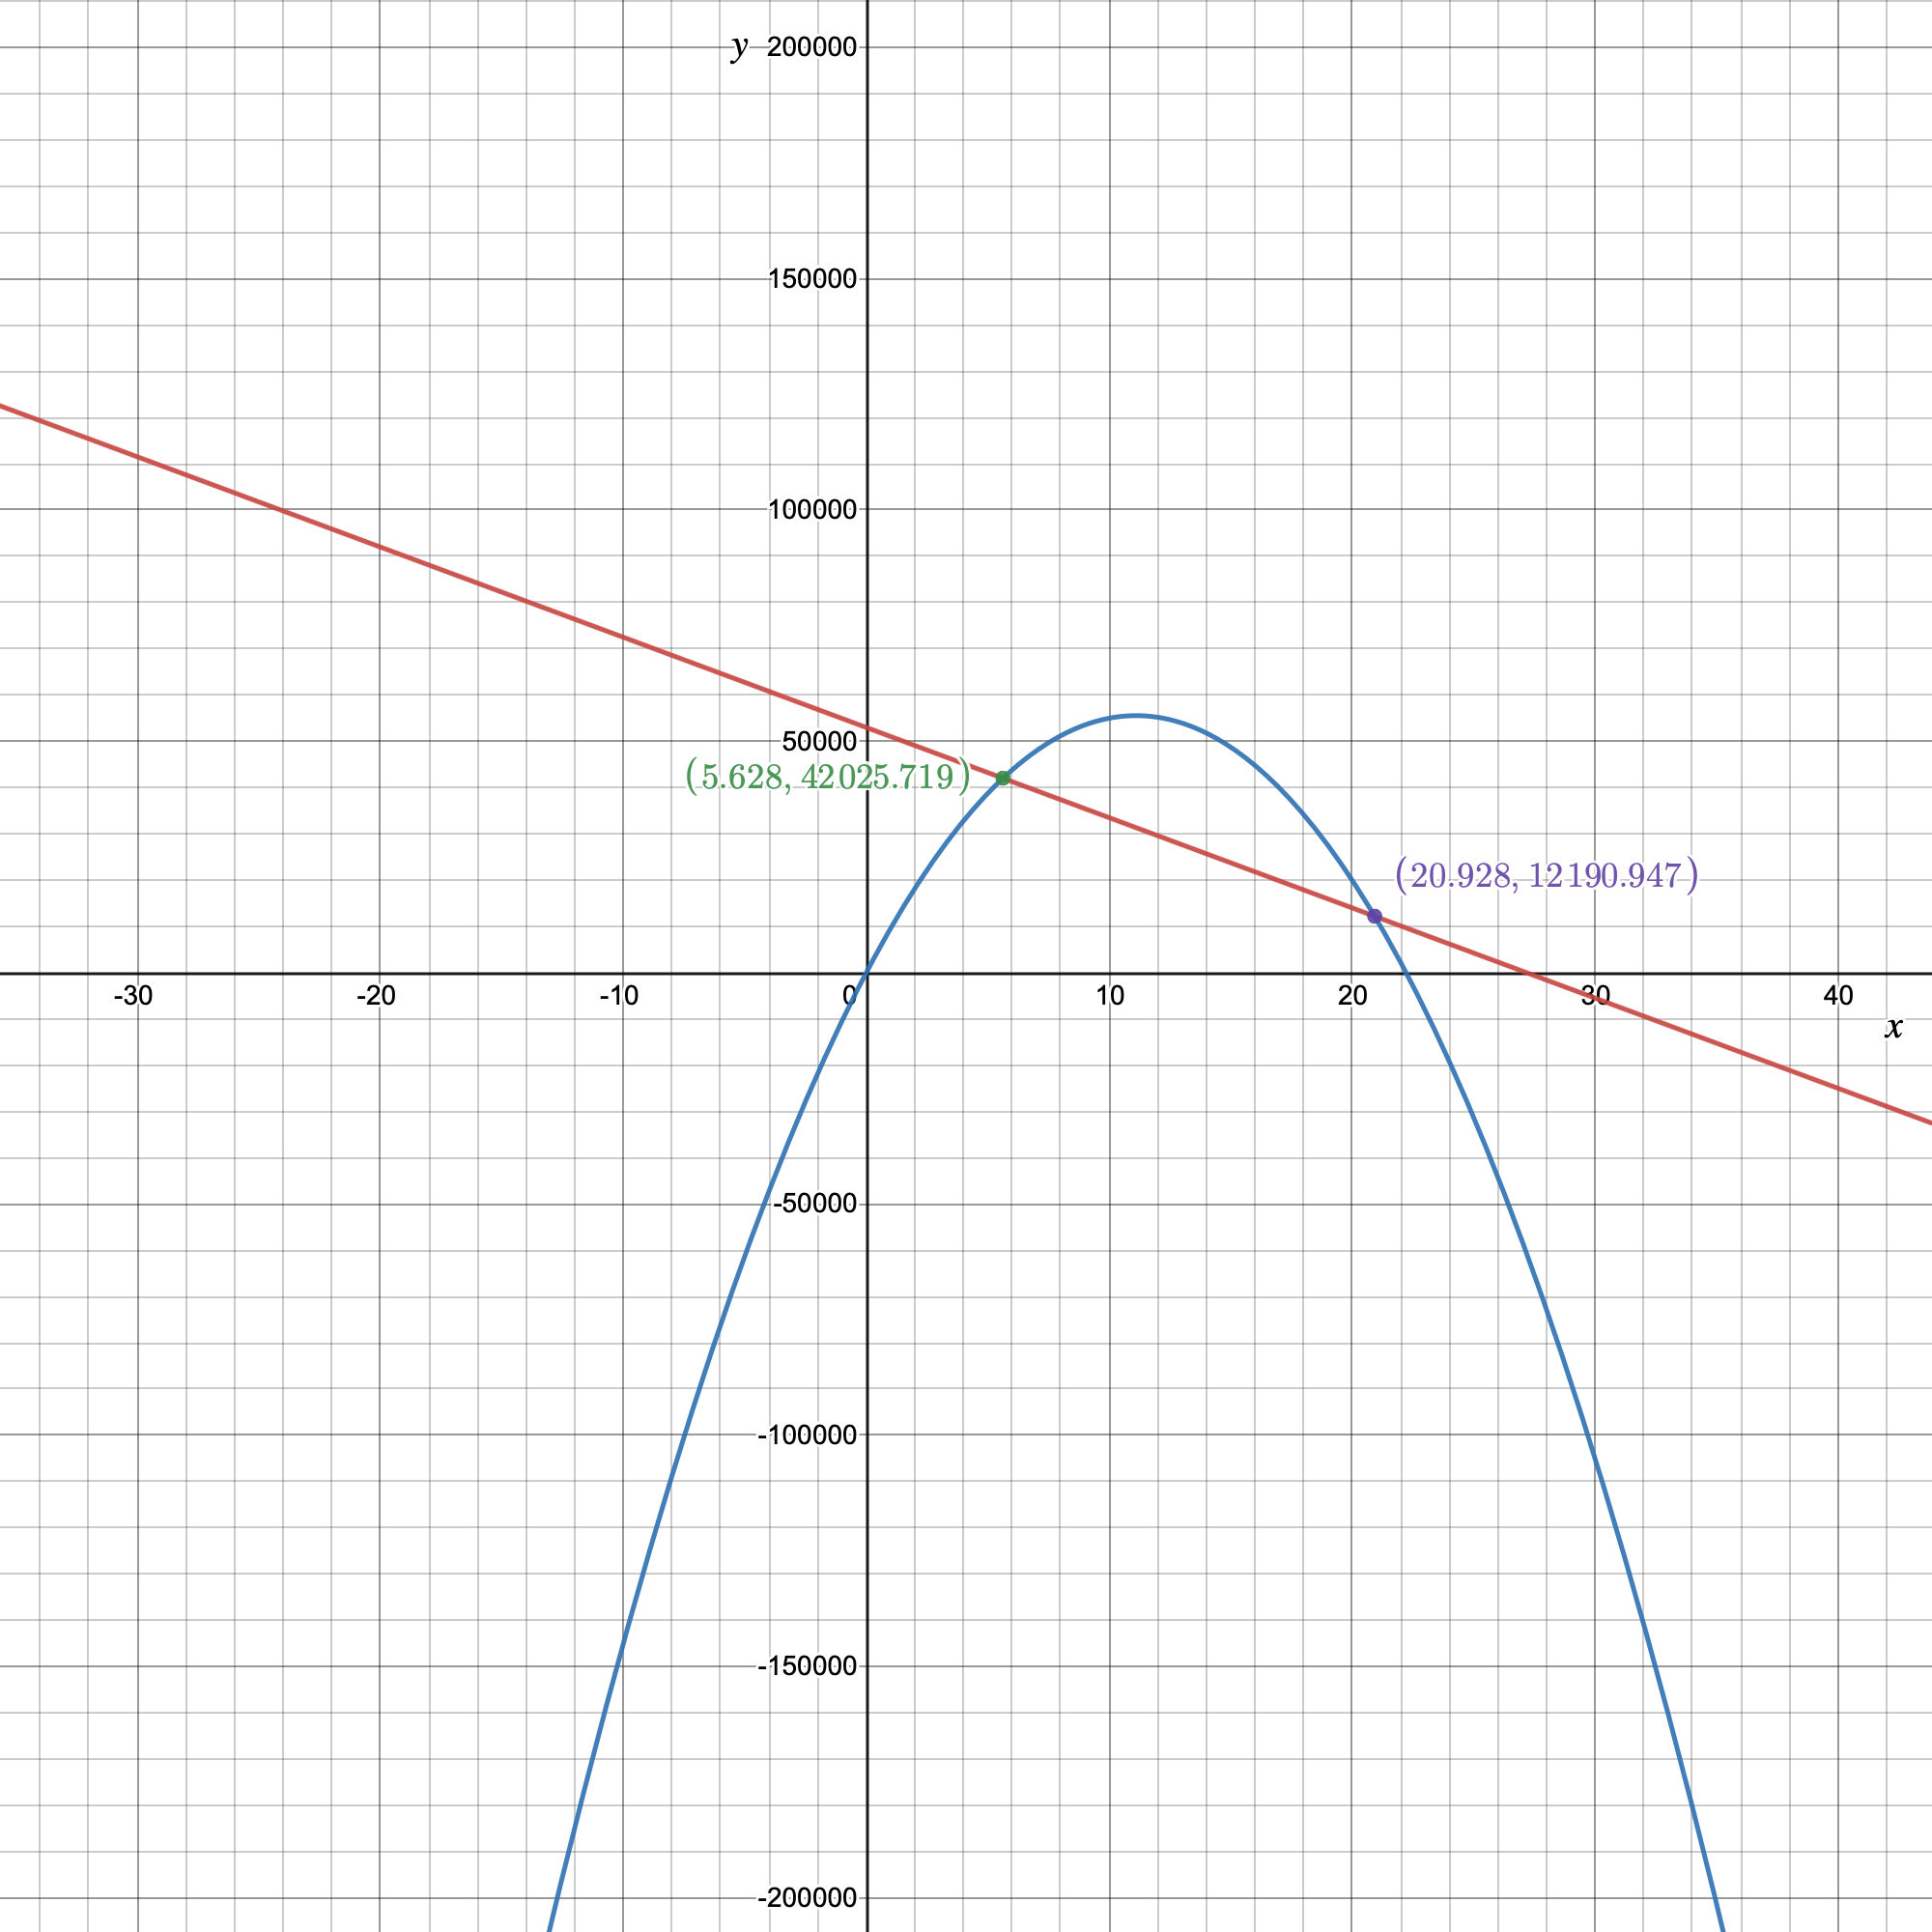
Given the expense function for a particular item be defined as y=−1,950x+53,000
and the revenue function be defined as y=−450x2+10,000x, where x represents price in each equation.
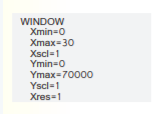
Graph the two functions using the window:

The graph the two functions using the above window is:
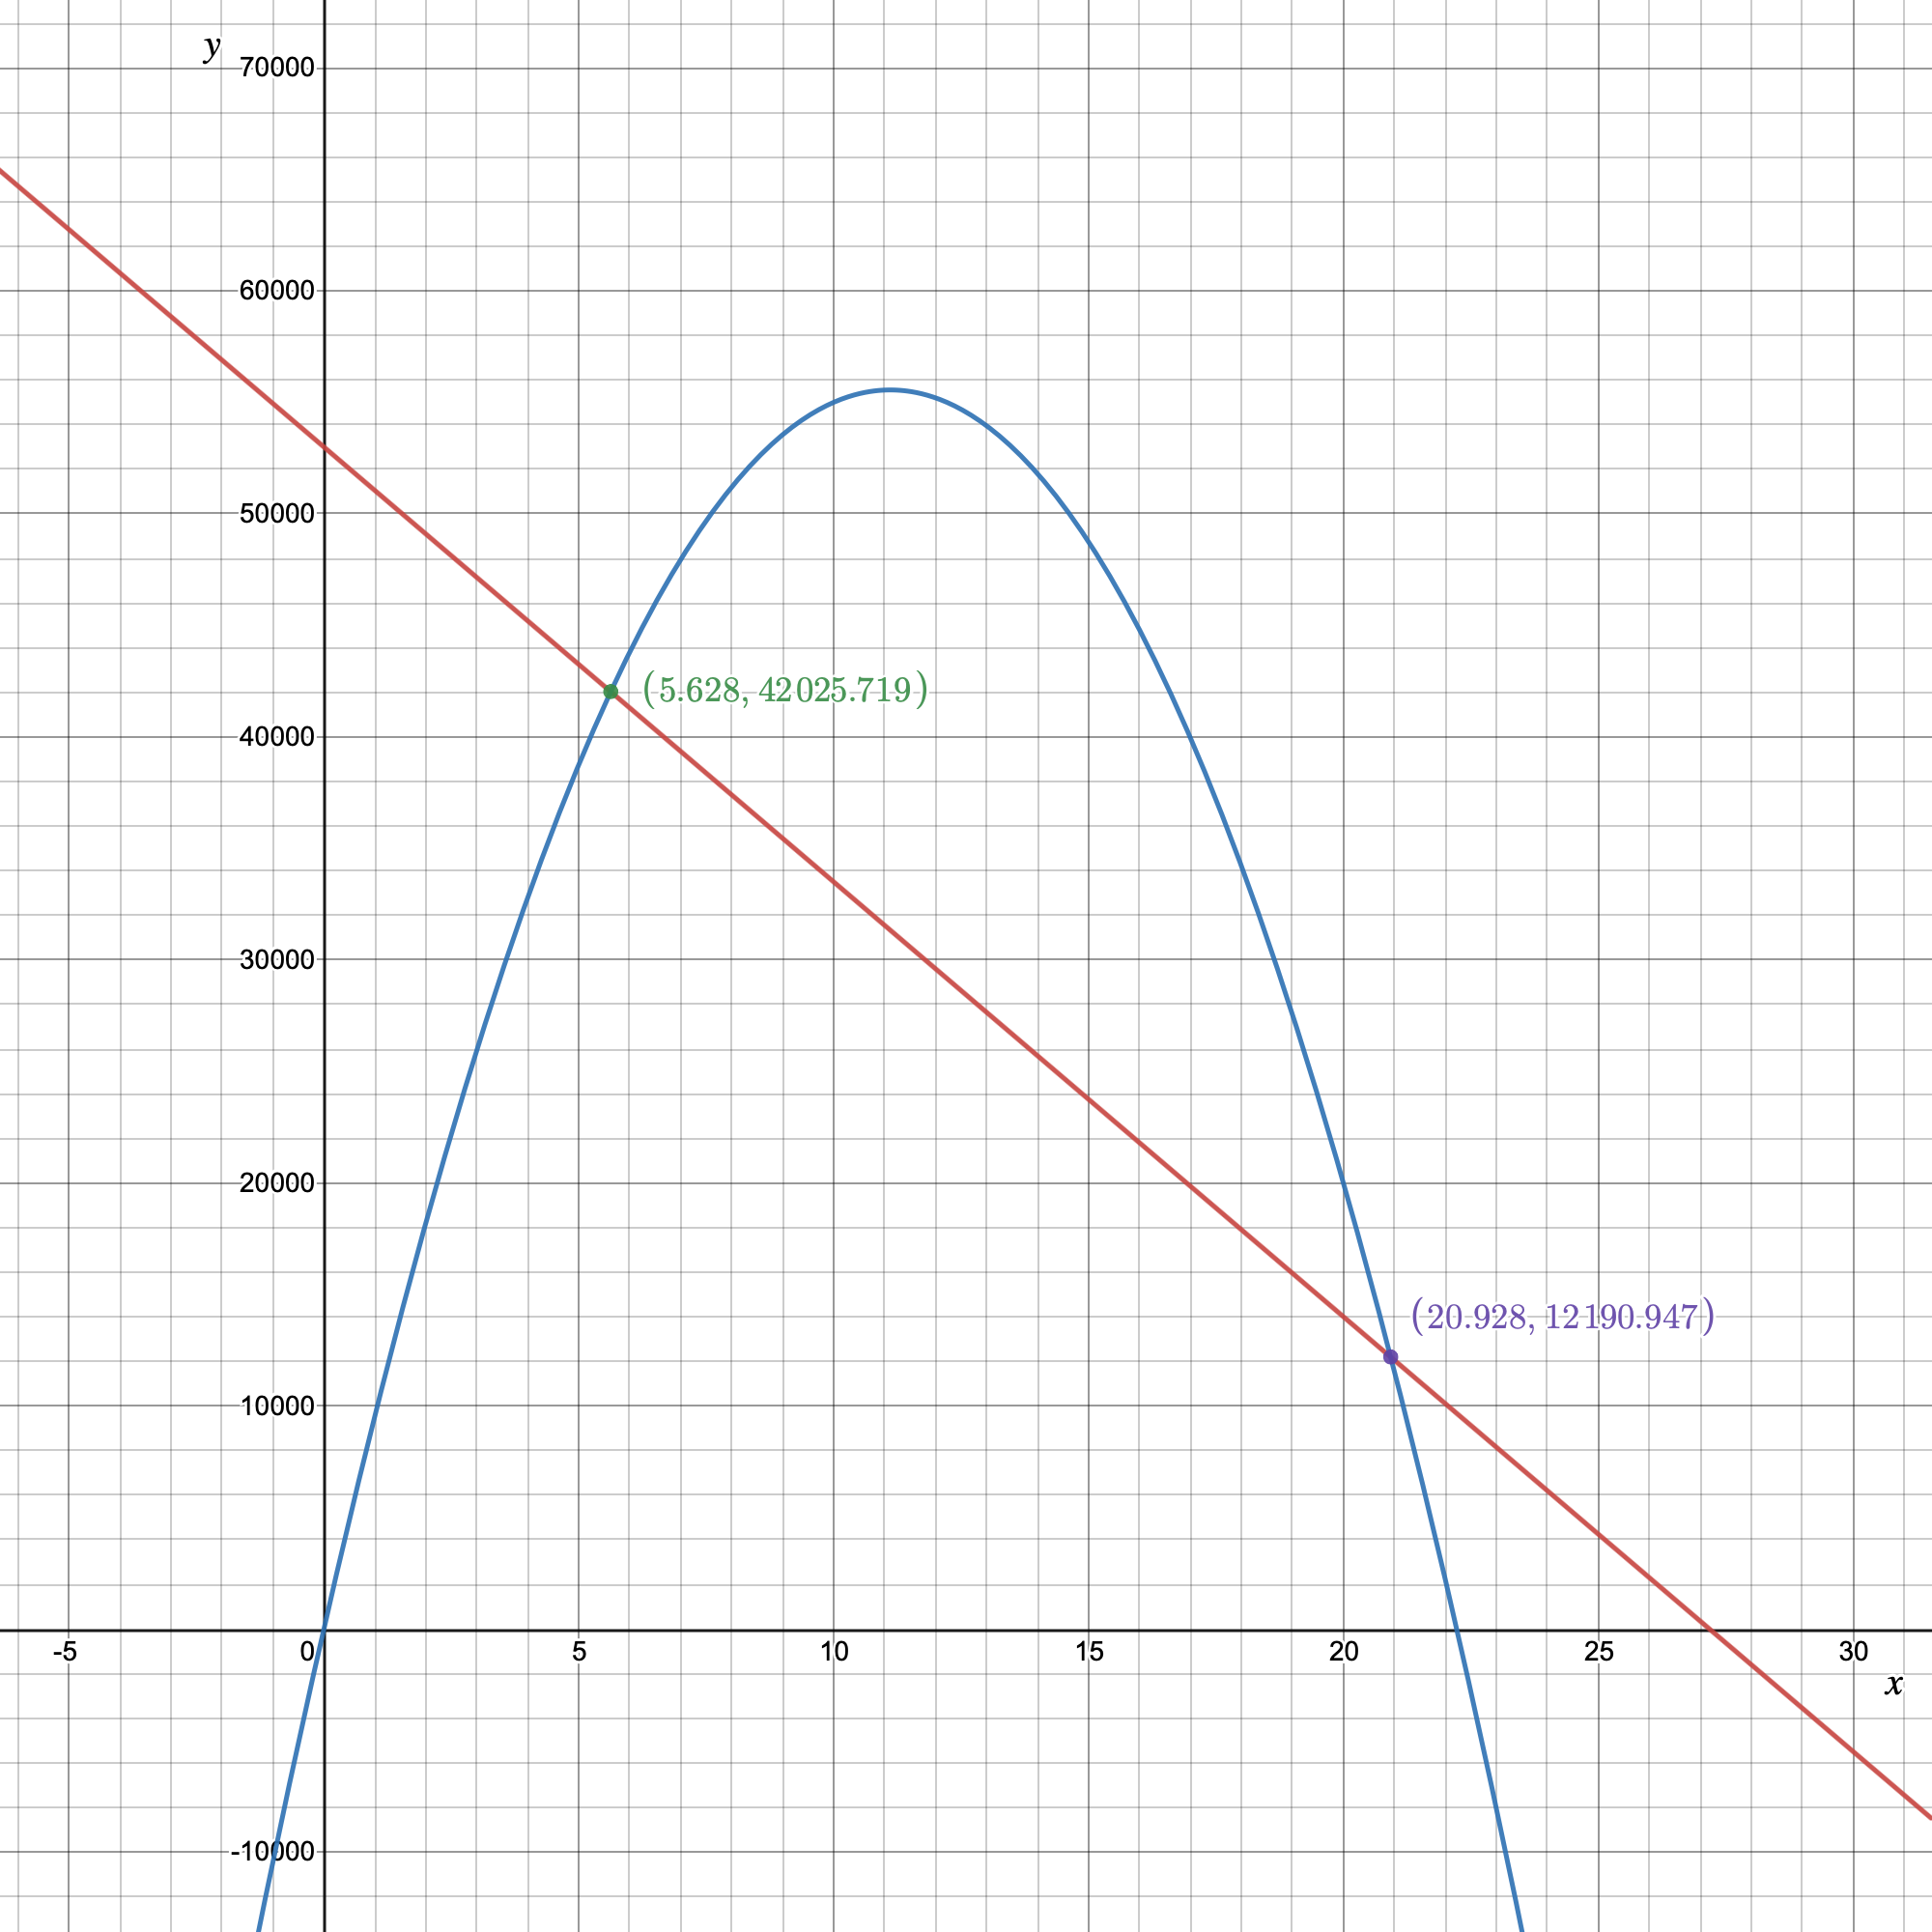
For the expense function for a particular item be defined as y=−1,950x+53,000 and the revenue function be defined as y=−450x2+10,000x.
The graph the two functions using the window:

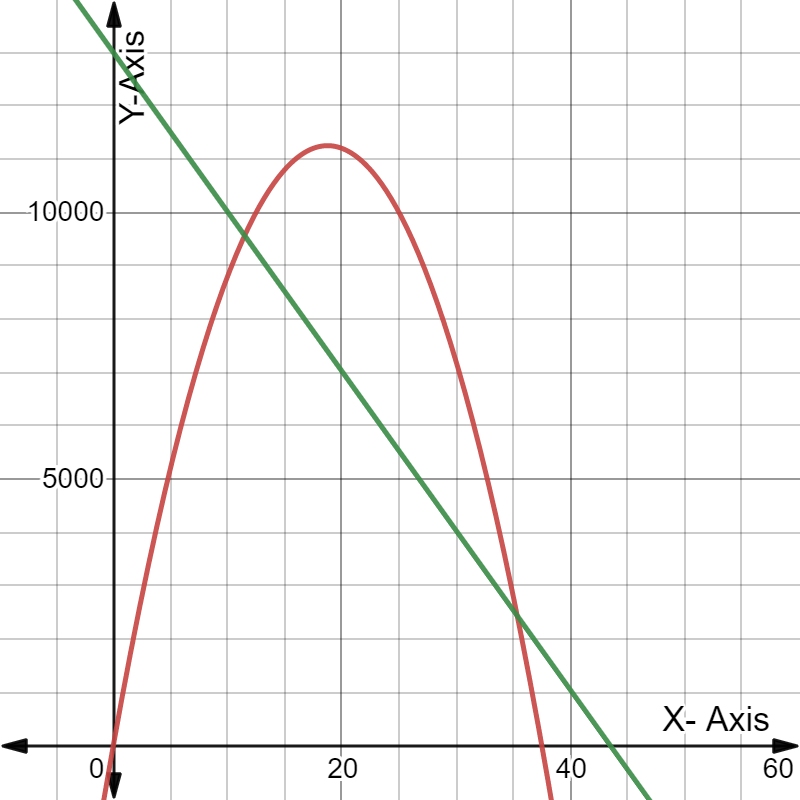
Page 112 Exercise 2 Answer
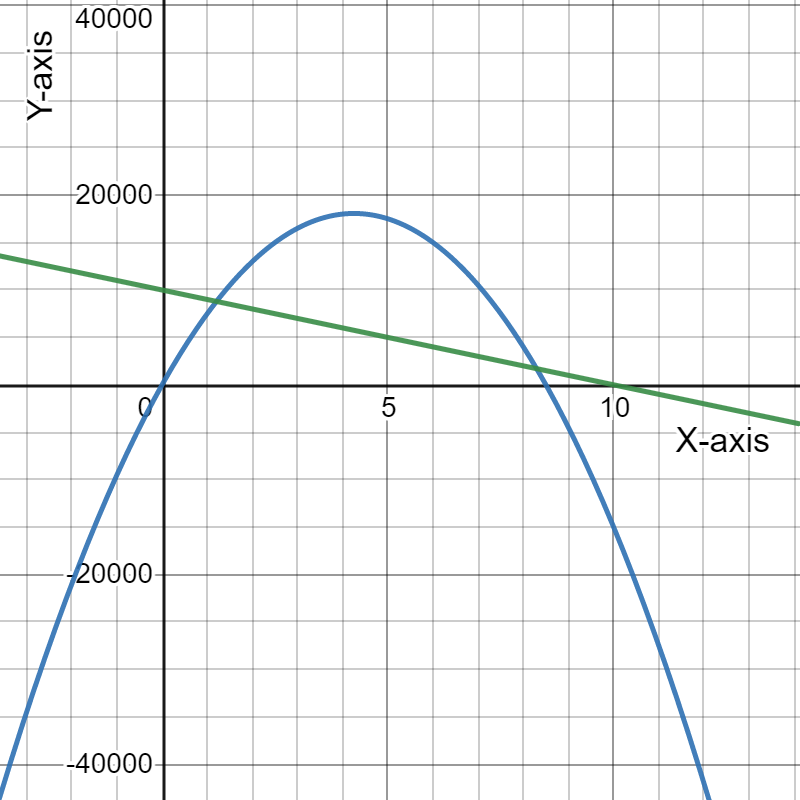
Given the expense function for a particular item be defined asy=−1,950x+53,000 and the revenue function be defined as y=−450x2+10,000x, where x represents price in each equation.
Need to determine the x-coordinate and they-coordinate of the first point where the two graphs intersect and round those values to the nearest whole number.
As the two intersect if they have the same value of(x,y). Using this find the required coordinates.
The graph is:

Putting the value of expense finction equals to revenue function gives us:
−1,950x+53,000=−450x2+10,000x
⇒450x2−11,950x+53,000=0
Using quadratic formula for finding the value of x, gives us:
x=−(−11,950)±√(−11,950)2−4⋅450⋅53,000/2⋅450
=11,950±√142,802,500−95,400,000/900
=11,950±√47,402,500/900
=11,950±6884.94/900
⇒x=11,950+6884.94/900 or
x=11,950−6884.94/900
Solving this further gives us:
x=11,950+6884.94/900
=18,834.64/900
=20.92 and x=11,950−6884.94/900
=5065.06/900
=5.6278≈5.63
The corresponding value of y is y=−1,950x+53,000
=−1,950×(5.6278)+53,000
=42025.79
The x-coordinate and the y-coordinate of the first point where the two graphs intersect is (5.63,42025.79).
Rounding these values to the nearest whole number gives us(6,42026).
For the expense function for a particular item be defined asy=−1,950x+53,000
and the revenue function be defined asy=−450x2+10,000x, where x
represents price in each equation.
The x-coordinate and the y-coordinate of the first point where the two graphs intersect is (5.63,42025.79).
Rounding these values to the nearest whole number gives us(6,42026)
for the graph:

Cengage Financial Algebra Chapter 2 Modeling A Business Key
Page 112 Exercise 3 Answer
Given the expense function for a particular item be defined as y=−1,950x+53,000
and the revenue function be defined as y=−450x2+10,000x, where xrepresents price in each equation.
Need to tell the significance of the point where the two graphs intersect in the context of expense, revenue, and price.
As at the point of intersection the expense function is equal to the revenue function or the price at which the profit is zero.
Thus, the point is called the break even point for the graph:

For the expense function for a particular item be defined as y=−1,950x+53,000 and the revenue function be defined as y=−450x2+10,000x, where x represents price in each equation.
The point where the two graphs intersect in the context of expense, revenue, and price is the breakeven point for the graph:
Page 112 Exercise 4 Answer
Given, a company is interested in producing and selling a new device called an eyePOD (eyewear personal optical device).
The eyePOD is an MP3 and video player built into a pair of sunglasses.
The user can listen to music from the small earphones and watch videos projected on the screen behind the glasses.
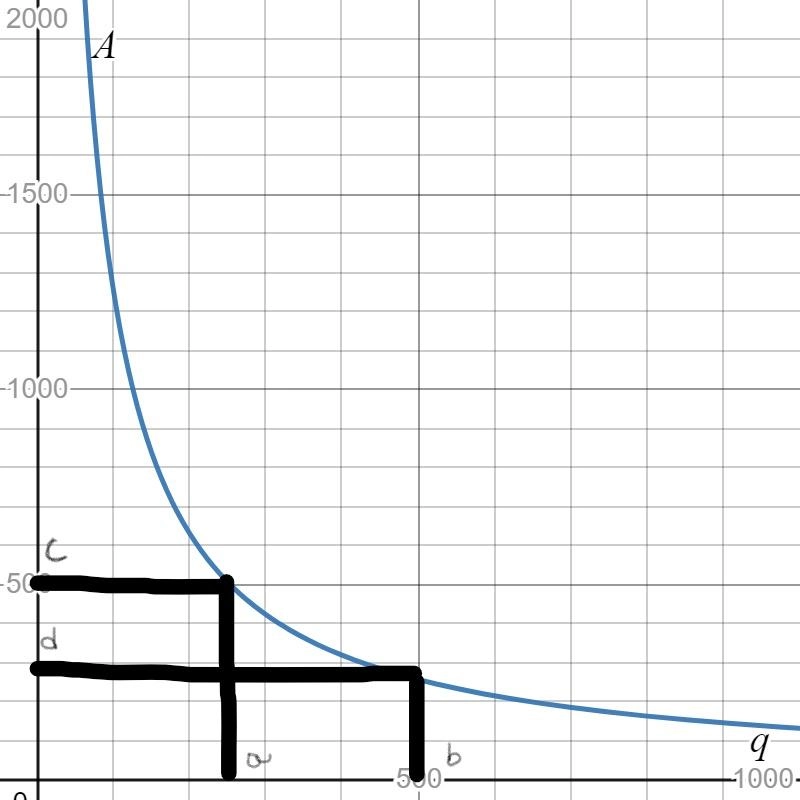
To determine what will happen to the quantity demanded as the price of the eyePOD increases.
We need to use the fact that the demand for a product depends on the quality of the product as well as the price of the product.
We know that the demand for a product depends on the quality of the product as well as the price of the product.
Thus, in the case of eyePOD, if the price of the eyePOD increases then certainly the quantity of the product demanded will decrease.
Hence, as the price of the eyePOD increases, the demand for the EyePOD will decrease.
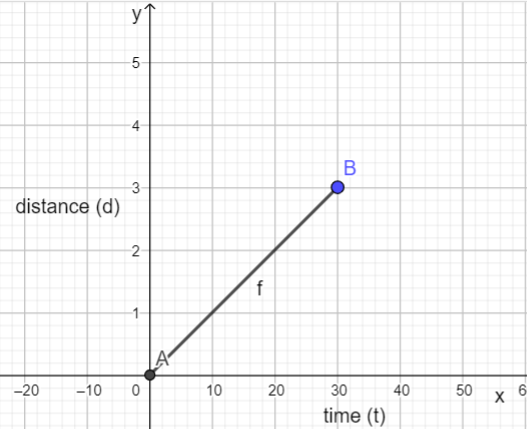
Page 113 Exercise 5 Answer
Given, a company is interested in producing and selling a new device called an eyePOD (eyewear personal optical device).
The eyePOD is an MP3 and video player built into a pair of sunglasses.
The user can listen to music from the small earphones and watch videos projected on the screen behind the glasses.
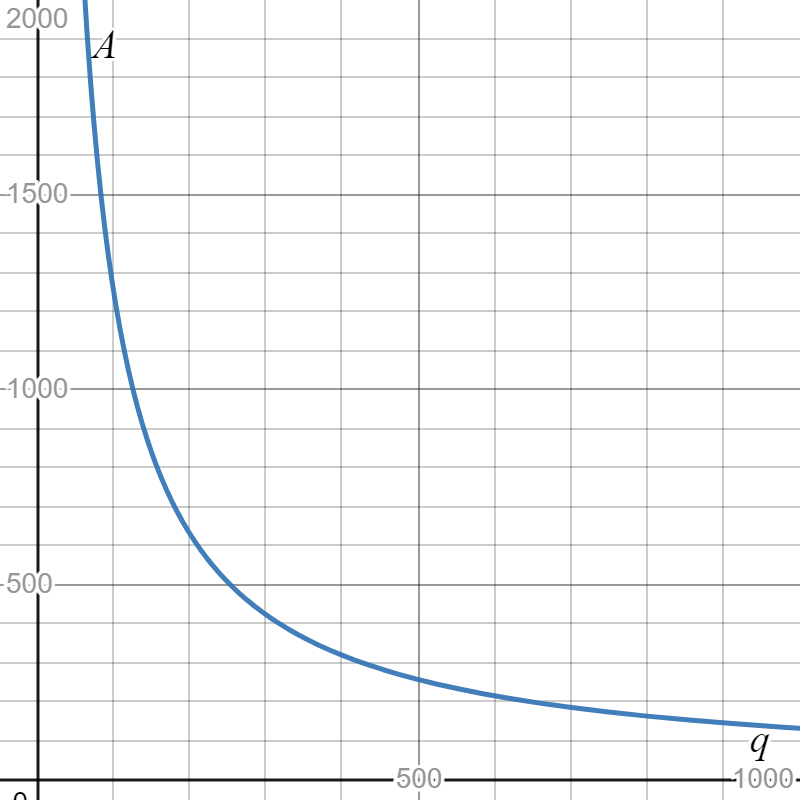
To make a scatterplot of the points represented by(p,q) which are given by
(300,10,000),(325,8,900),(350,8,800),(375,8,650),(400,6,700)
(425,6,500),(450,5,000),(475,4,500),(500,4,450),(525,3,000)
We need to plot the above-given coordinates on the x,y graph to get the scatterplot.
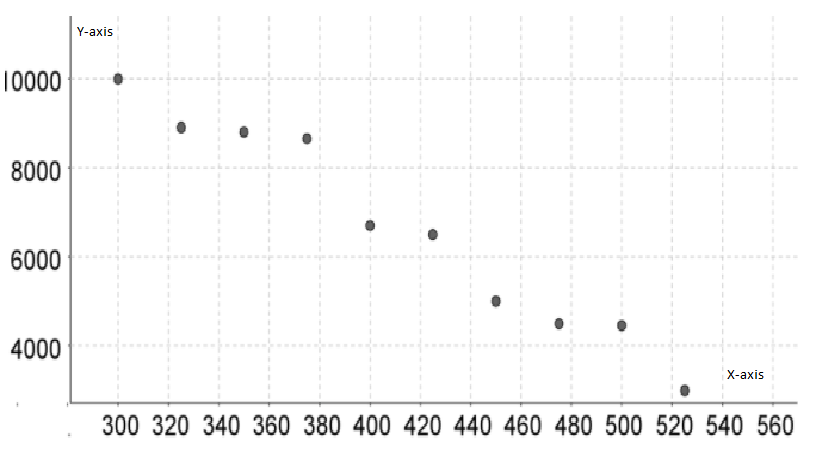
On plotting prices on x−axis and quantity on y−axis, we get:
Hence, the scatter plot of the data is given by

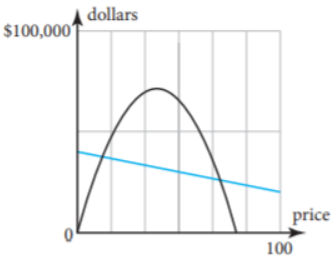
Page 113 Exercise 6 Answer
Given, a company is interested in producing and selling a new device called an eye POD (eyewear personal optical device).
The eyePOD is an MP3 and video player built into a pair of sunglasses.
The user can listen to music from the small earphones and watch videos projected on the screen behind the glasses.
To determine the correlation coefficient and to determine whether this line is a good predictor or not.
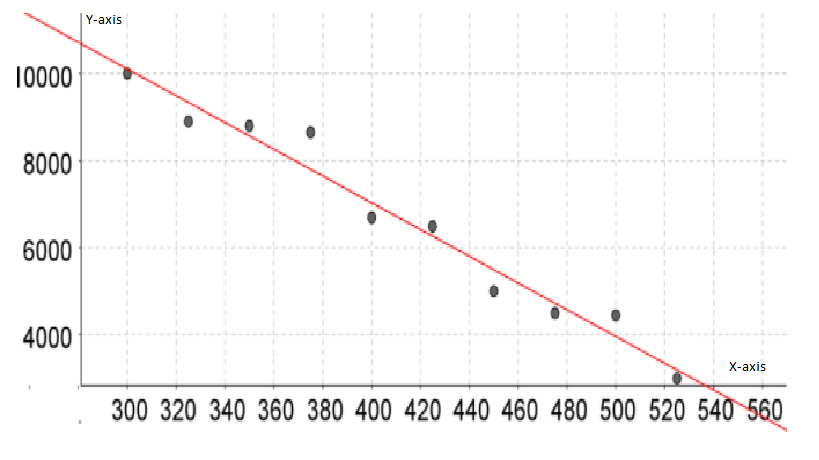
We need to calculate the correlation coefficient through LinReg(ax+b)L1,L2.
On calculating correlation coefficient through Lin Reg(ax+b)L1,L2, we get:
y=ax+b
a=−30.7393939394
b=19330
r2=0.9659385288
r=−0.9828217177
Therefore, the correlation coefficient is −0.98 which represents a negative correlation.
As the correlation is close to ±1, there is a strong correlation.
Thus, we conclude that the line is a good predictor since there is a strong, negative correlation between the price and the demand.

Hence, the correlation coefficient is −0.98 and yes, the regression line is a good .
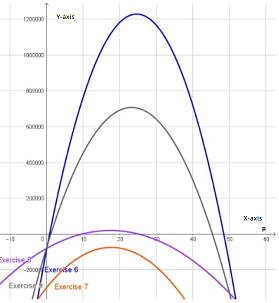
Page 113 Exercise 7 Answer
Given, a company is interested in producing and selling a new device called an eyePOD (eyewear personal optical device).
The eyePOD is an MP3 and video player built into a pair of sunglasses.
The user can listen to music from the small earphones and watch videos projected on the screen behind the glasses.
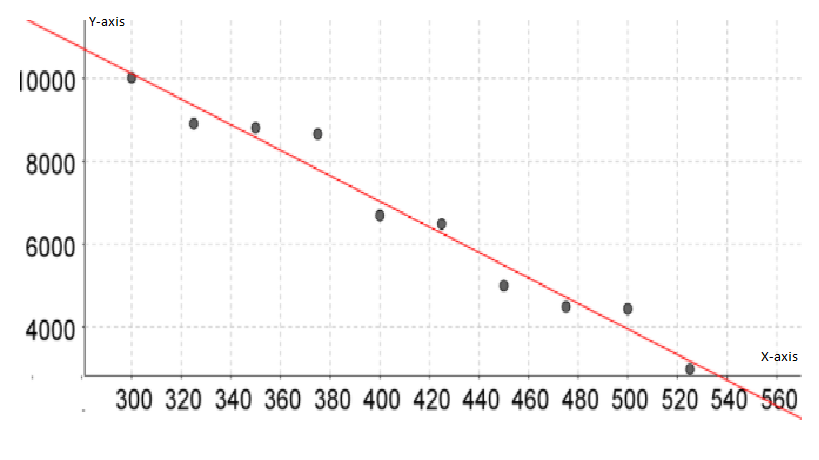
To write the regression equation. We need to use Lin Reg(ax+b)L1, L2 to get the equation and then replace x,y with p,q respectively.
Using Lin Reg(ax+b)L1,L2 to get the regression equation,
y=ax+b
a=−30.7393939394
b=19330
r2=0.9659385288
r=−0.9828217177
Thus, the regression equation is given by y=ax+b=−30.74x+19330
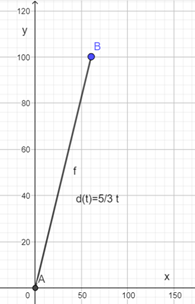
On replacing x,y with p,q respectively, we get: q=−30.74p+19330 which is represented by
Hence, the regression equation is q=−30.74p+19330 which is represented by

Page 113 Exercise 8 Answer
Given, The accounting department has calculated that this could be the biggest product to hit the market in years.
It anticipates the fixed costs to be $160,000 and the variable cost to be $150 per eye POD.
To Express expenses E, as a function of q, the quantity produced.
We need to form an equation with two variables using the given statement.
We have, the fixed cost=$160,000 the variable cost=$150 per eye POD let q represent the number of eye PODs, then the expenses E can be expressed as
E=150q+160,000
Hence, expenses E, as a function of q , the quantity produced can be expressed as
E=150q+160,000
Page 113 Exercise 9 Answer
Given, a company is interested in producing and selling a new device called an eyePOD (eyewear personal optical device).
The eyePOD is an MP3 and video player built into a pair of sunglasses.
The user can listen to music from the small earphones and watch videos projected on the screen behind the glasses.
The horizontal axis represents price, and the vertical axis represents quantity.To express the revenue R, in terms of p and q.
We need to use the fact that the product of the price and the quantity gives the revenue of the product.
We know that the product of the price p and the quantity q gives the revenue R.
Thus, we conclude that the revenue R can be expressed as R=pq
Hence, the revenue R, in terms of p and q can be expressed as R=pq
Page 113 Exercise 10 Answer
Given, A company is interested in producing and selling a new device called an eyePOD (eyewear personal optical device).
The eyePOD is an MP3 and video player built into a pair of sunglasses.
The user can listen to music from the small earphones and watch videos projected on the screen behind the glasses.
To express the revenue R, in terms of p.
We need to use the fact that the product of the price and the quantity gives the revenue of the product.
We know that the product of the price p and the quantity q gives the revenue R.
Thus, we conclude that the revenue R can be expressed as R=pq
On replacing q with−30.74p+19,330, we get:
R=p(−30.74p+19,330)=−30.74p{2}+19,330p
R=−30.74p{2}+19,330p
Hence, the revenue R, in terms of p can be expressed as R=−30.74p{2}+19,330p
Page 113 Exercise 11 Answer
Given, A company is interested in producing and selling a new device called an eyePOD (eyewear personal optical device).
The eye POD is an MP3 and video player built into a pair of sunglasses.
The user can listen to music from the small earphones and watch videos projected on the screen behind the glasses.
To express expenses E, in terms of p.
We need to use the transitive property of dependence and make an equation of two variables.
From the previous exercise15 , the expenses E, in terms of q can be expressed as
E=150q+160,000
Now, on replacing q with −30.74p+19,330, we get:
E=150(−30.74p+19,330)+160,000
=−4,611p+2,899,500+160,000
=−4,611p+3,059,500
Hence, the expenses E, in terms of p can be expressed as
E=−4,611p+3,059,500
Page 113 Exercise 12 Answer
Given, a company is interested in producing and selling a new device called an eyePOD (eyewear personal optical device).
The eye POD is an MP3 and video player built into a pair of sunglasses.
The user can listen to music from the small earphones and watch videos projected on the screen behind the glasses.
To determine an appropriate maximum horizontal-axis value.
We need to put zero for the expense function to get the maximum horizontal-axis value.
We have, expense function E=−4,611p+3,059,500 and revenue function R=−30.74p{2}+19,330p from the previous exercise.
On putting expense function as zero, we get:
0=−4,611p+3,059,500
4,611p=3,059,500
p=663.52≈700
Hence, an appropriate maximum horizontal-axis value is 700.
Page 113 Exercise 13 Answer
Given, a company is interested in producing and selling a new device called an eyePOD (eyewear personal optical device).
The eye POD is an MP3 and video player built into a pair of sunglasses.
The user can listen to music from the small earphones and watch videos projected on the screen behind the glasses.
To determine an appropriate maximum vertical-axis value.
We need to put zero for the price at the expense function to get the maximum vertical-axis value.
We have, expense function E=−4,611p+3,059,500 and
revenue function R=−30.74p{2}+19,330p from the previous exercise.
On putting zero for the price at the expense function, we get:
E=3,059,500≈3,100,000
Hence, an appropriate maximum vertical-axis value is 3,100,000.
Page 113 Exercise 14 Answer
Given, A company is interested in producing and selling a new device called an eyePOD (eyewear personal optical device).
The eye POD is an MP3 and video player built into a pair of sunglasses.
The user can listen to music from the small earphones and watch videos projected on the screen behind the glasses.
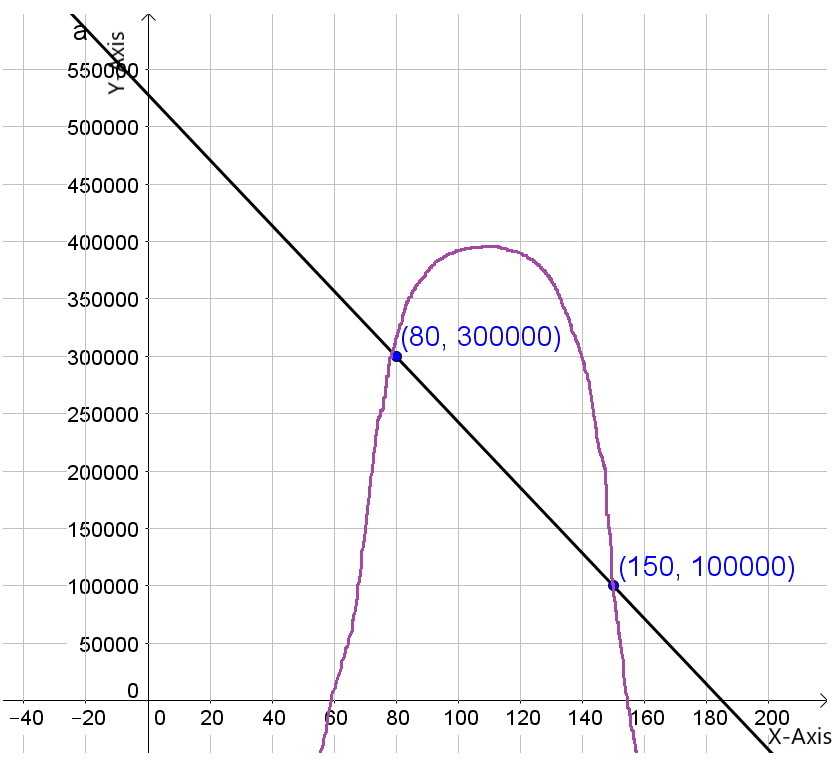
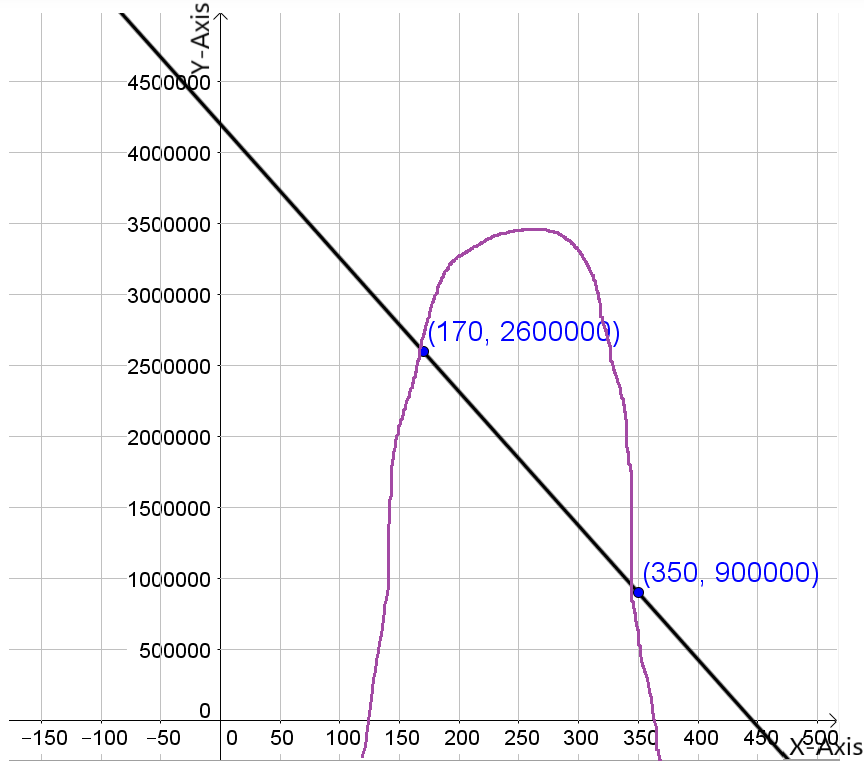
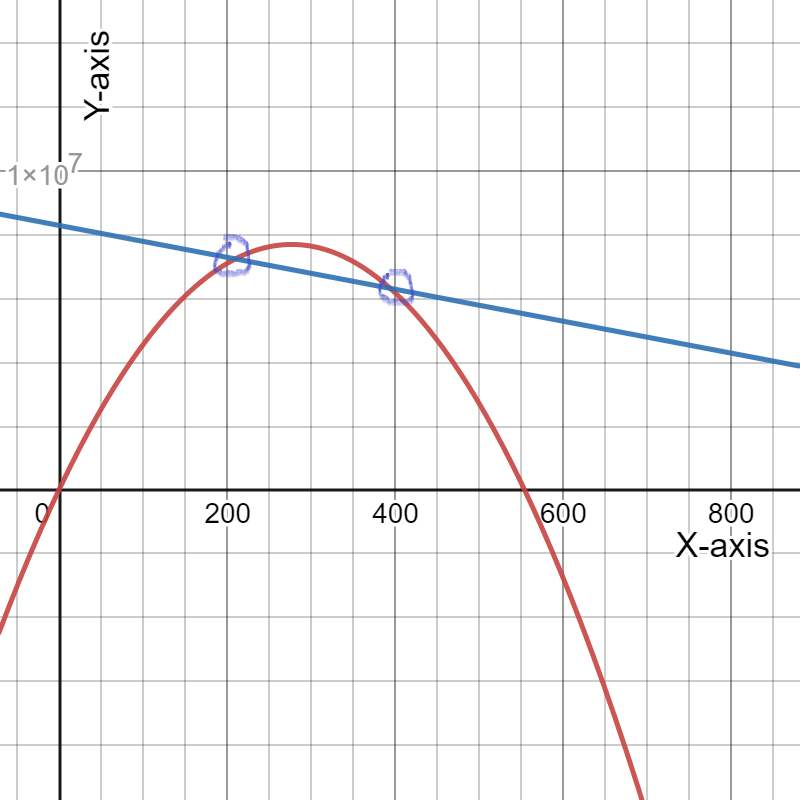
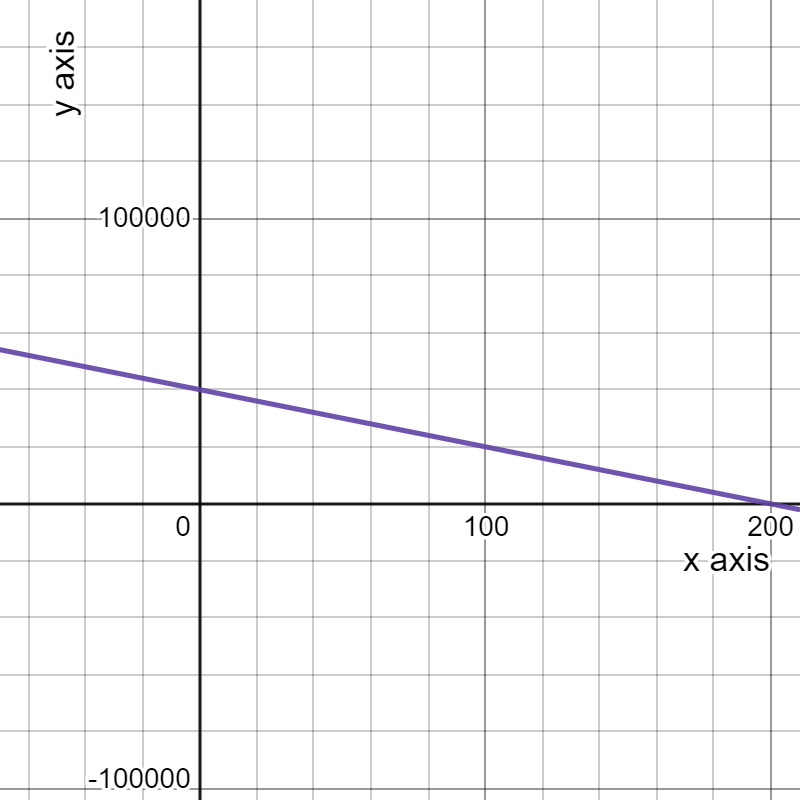
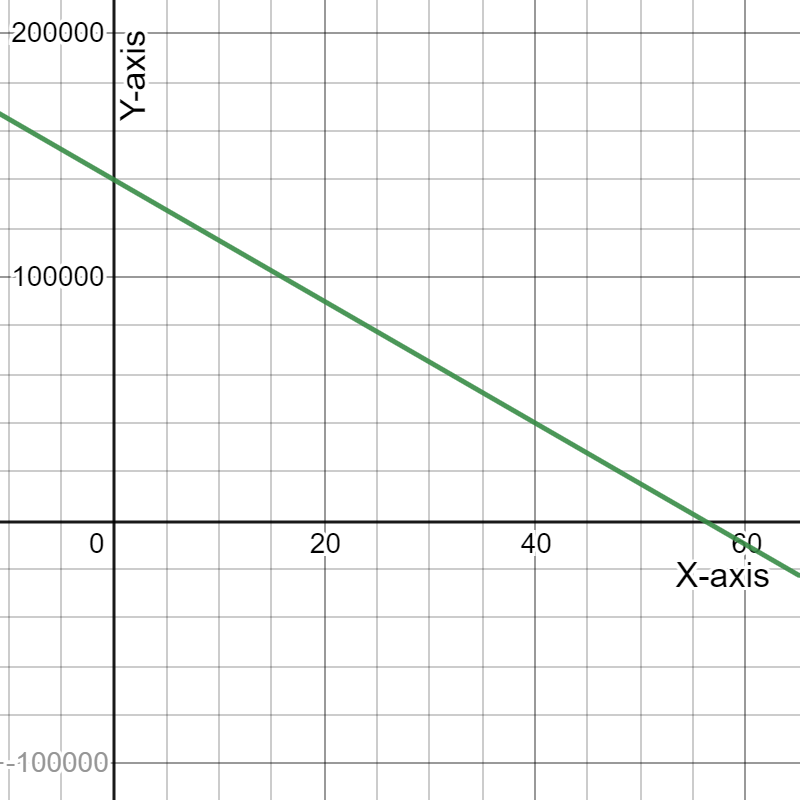
To draw a graph of the expense and revenue functions.
We need to get the (x,y) coordinates of the function to draw the graph.
On drawing expense function, represented by a black line and revenue function, represented by purple parabola, we get:
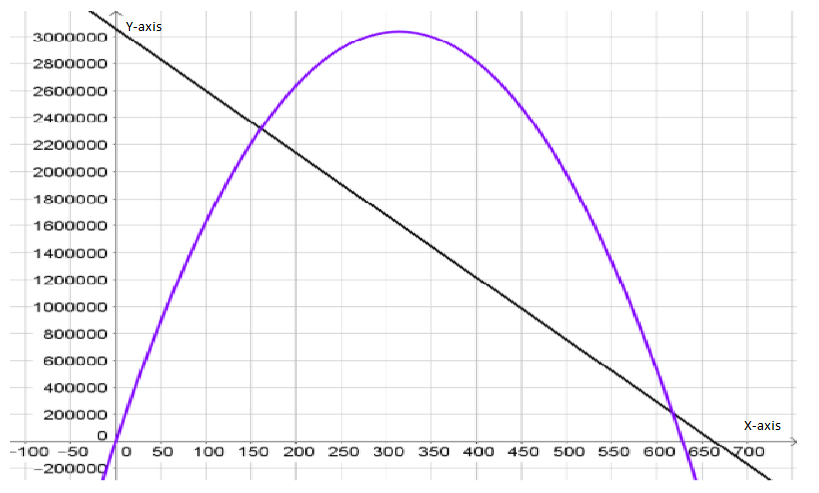
Hence, the graph of the expense and revenue functions is given by

Page 113 Exercise 15 Answer
Given, a company is interested in producing and selling a new device called an eyePOD (eyewear personal optical device).
The eye POD is an MP3 and video player built into a pair of sunglasses.
The user can listen to music from the small earphones and watch videos projected on the screen behind the glasses.
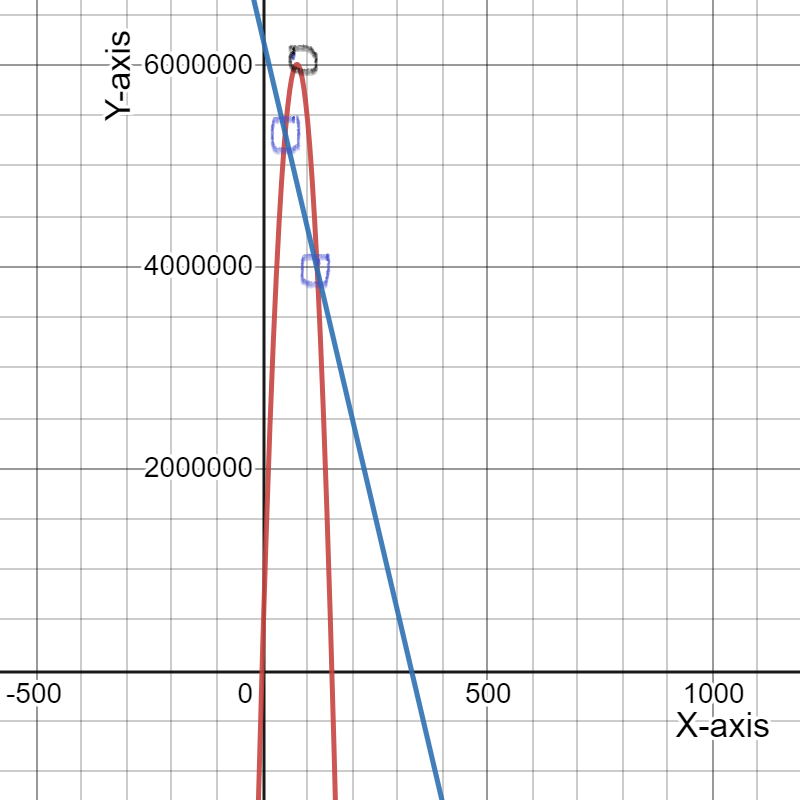
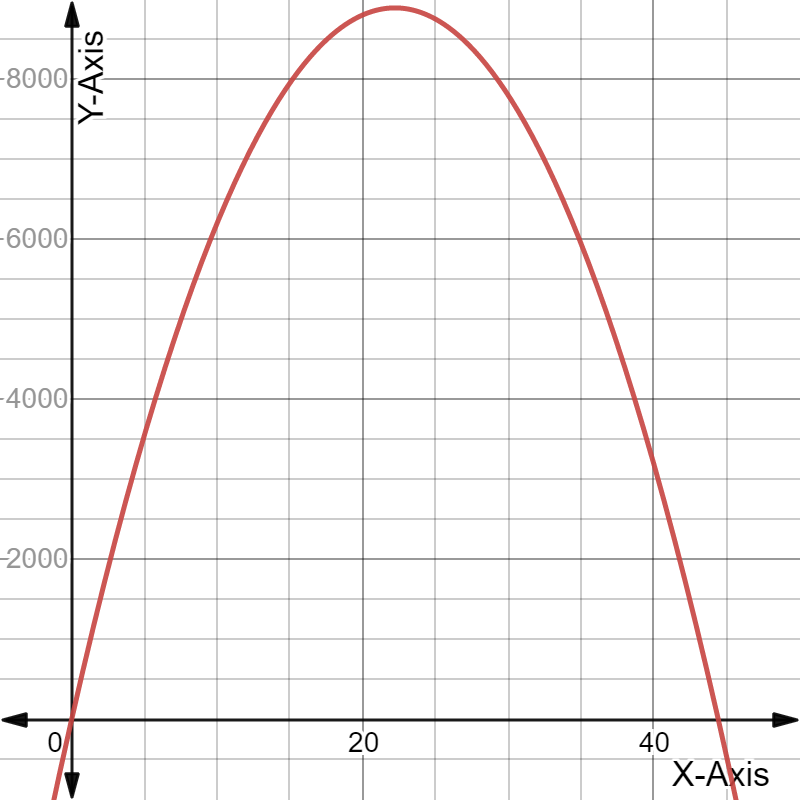
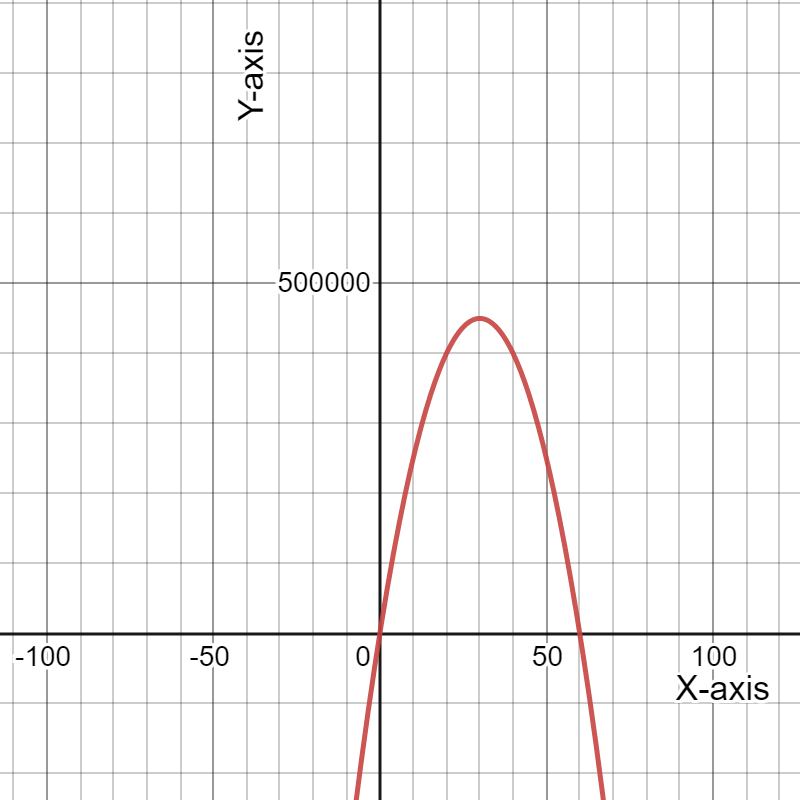
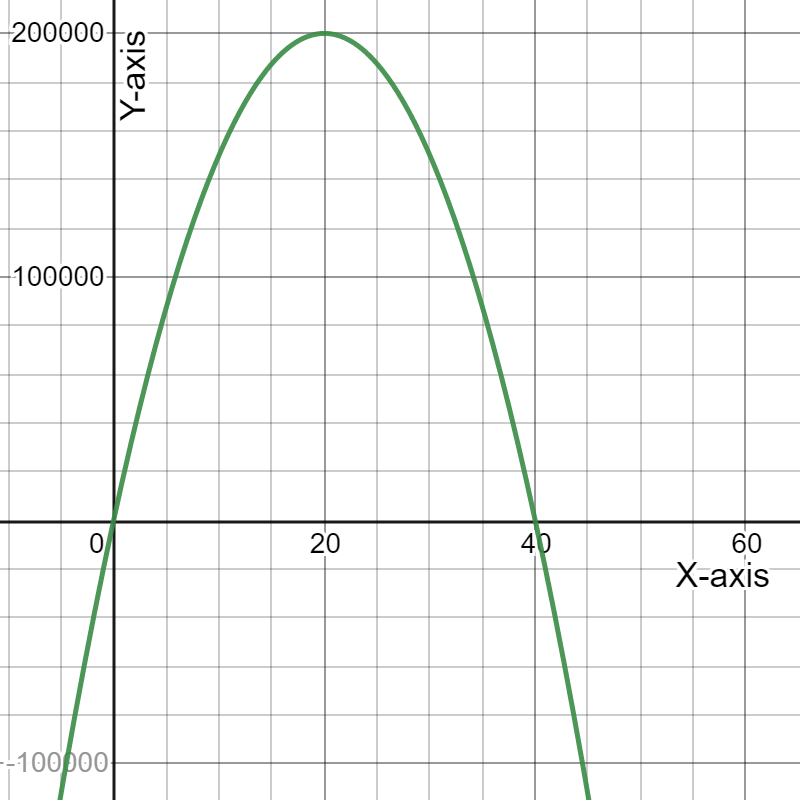
To determine the coordinates of the maximum point on the revenue graph.
We need to use the fact the maximum of a quadratic function y=ax{2}+bx+c lies at the symmetry x=−b/2a.
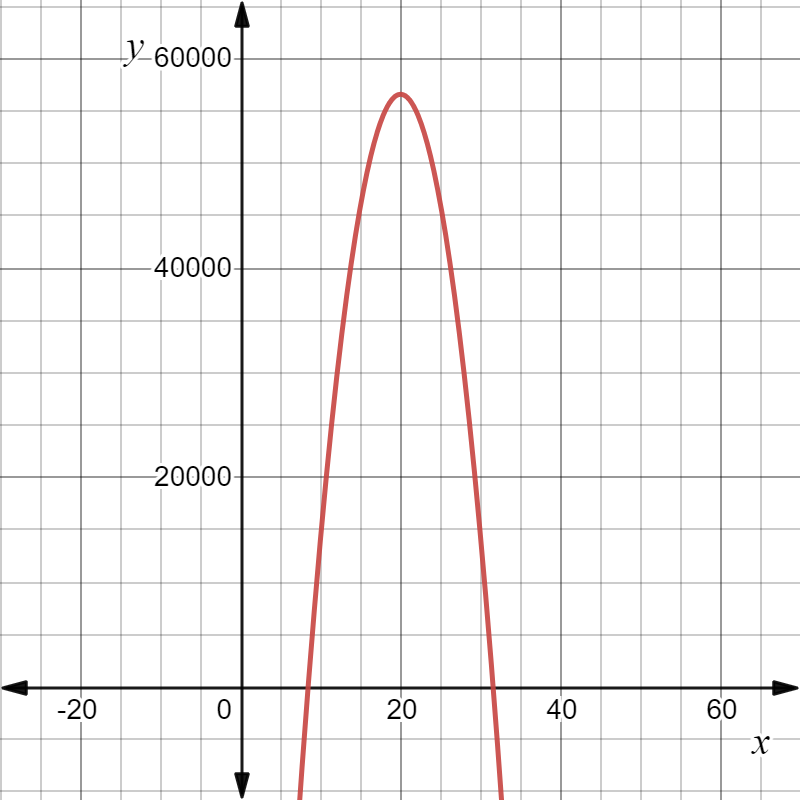
We have the revenue function from the previous exercise R=−30.74p{2}+19,330p.
Since we know that the maximum of a quadratic function y=ax{2}+bx+c lies at symmetry
x=−b/2a.
So, here is a=−30.74
b=19,330 and c=0
Now, p=−b/2a
=−19330/2(−30.74)
≈314.41
Therefore, the maximum revenue price is $314.41
On putting this value of p in revenue function, we get: R=3,038,784.16 which represents the maximum revenue.
Hence, the coordinates of the maximum point on the revenue graph is
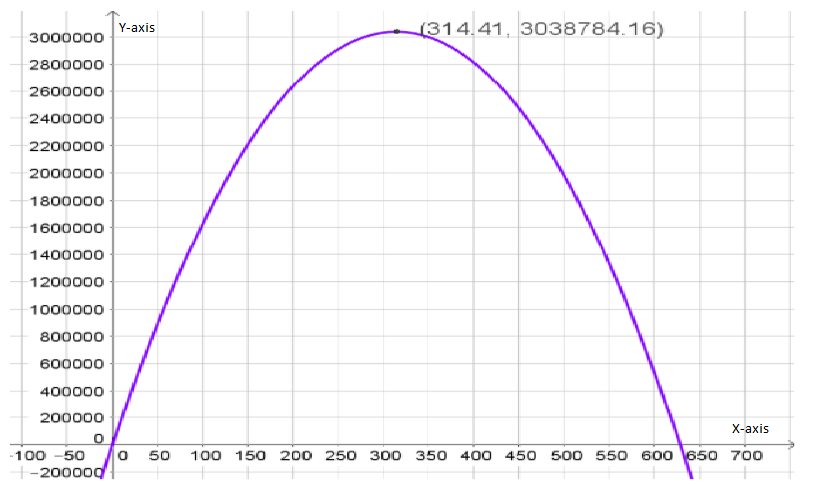
and the graph of the revenue function is given by

Detailed Solutions For Cengage Financial Algebra Chapter 2 Assessment Modeling A Business
Page 113 Exercise 16 Answer
Given, a company is interested in producing and selling a new device called an eyePOD (eyewear personal optical device).
The eyePOD is an MP3 and video player built into a pair of sunglasses.
The user can listen to music from the small earphones and watch videos projected on the screen behind the glasses.
To express the profit, P in terms of p.
We need to find the difference between the revenue and the expense function to get the profit function.
We have the revenue and the expense function from the previous exercises as
E=−4,611p+3,059,500
R=−30.74p2+19,330p
Since the difference between the revenue and the expense function gives the profit function, we get:
P=R−E
=−30.74p{2}+23,941p−3,059,500
Hence, the profit function P in terms of price p is represented as
=−30.74p{2}+23,941p−3,059,500
Page 113 Exercise 17 Answer
Given, a company is interested in producing and selling a new device called an eyePOD (eyewear personal optical device).
The eye POD is an MP3 and video player built into a pair of sunglasses.
The user can listen to music from the small earphones and watch videos projected on the screen behind the glasses.
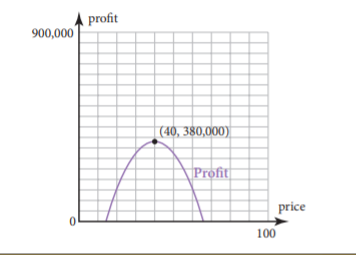
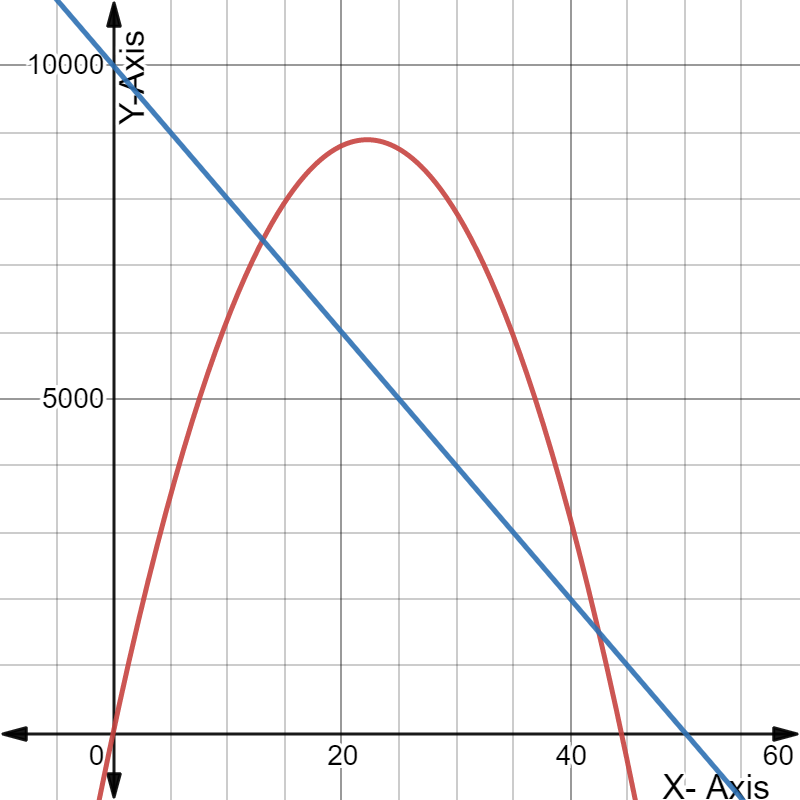
To plot the profit function and to determine the coordinates of the maximum point of the profit graph and determine when the price p is profit maximized.
We need to use the fact the maximum of a quadratic functiony=ax{2}+bx+c lies at the symmetry x=−b/2a.
We have the profit function from the previous exercise P=−30.74p{2}+23,941p−3,059,500
Since we know that the maximum of a quadratic functiony=ax{2}+bx+c lies at symmetry
x=−b/2a
So, here is a=−30.74
b=23,941 and
c=−3,059,500
Now, p=−b/2a
=−23,941/2(−30.74)
≈314.41
Therefore, the maximum revenue price is$314.41
Now, from the graph, we conclude that maximum profit is made at a price $389.41
Also, the coordinates of the maximum point of the profit graph is
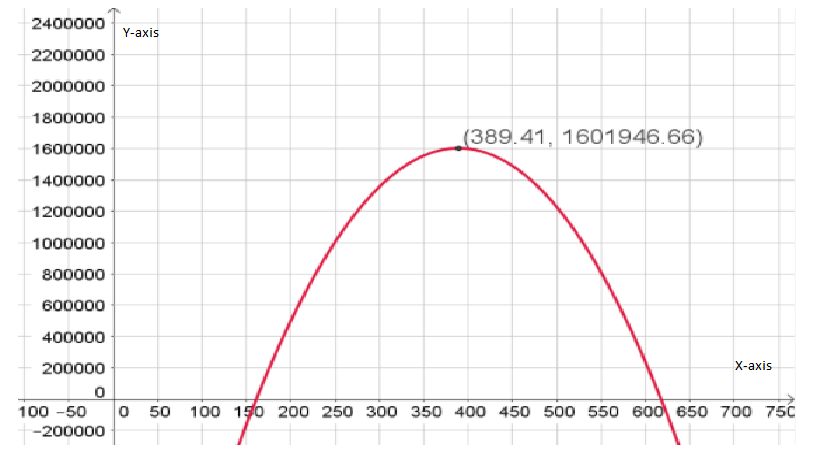
Hence, the coorinates of the maximum point of he profit graph is and the profit is maximized at $389.41.

Page 113 Exercise 18 Answer
Given, a company is interested in producing and selling a new device called an eyePOD (eyewear personal optical device).
The eyePOD is an MP3 and video player built into a pair of sunglasses.
The user can listen to music from the small earphones and watch videos projected on the screen behind the glasses.
To find the shares that must be sold to get enough money to start the business if shares of stock are sold with an initial value of $10.
We need to use the maximum profit price for business profits.
We have the expense function from the previous exerciseE=−4,611p+3,059,500
Also, the maximum profit price is $389.41
Thus, the expense is given by
E=−4,611(389.41)+3,059,500
≈$1,263,930.49 which represents the total income of the shares.
Since the cost of each shares is$10. Consider x shares then the total income of the shares is 10x which is given by
10x=1,263,930.49
x=126,393.049
Hence, the number of shares that must be sold to get enough money to start the business is 126,393.049.
Practice Problems For Cengage Financial Algebra Chapter 2 Modeling A Business Assessment
Chapter 2 Solving Linear Inequalities
- Cengage Financial Algebra 1st Edition Chapter 2 Exercise 2.1 Modeling a Business
- Cengage Financial Algebra 1st Edition Chapter 2 Exercise 2.2 Modeling a Business
- Cengage Financial Algebra 1st Edition Chapter 2 Exercise 2.3 Modeling a Business
- Cengage Financial Algebra 1st Edition Chapter 2 Exercise 2.4 Modeling a Business
- Cengage Financial Algebra 1st Edition Chapter 2 Exercise 2.5 Modeling a Business
- Cengage Financial Algebra 1st Edition Chapter 2 Exercise 2.6 Modeling a Business
- Cengage Financial Algebra 1st Edition Chapter 2 Exercise 2.7 Modeling a Business
- Cengage Financial Algebra 1st Edition Chapter 2 Exercise 2.8 Modeling a Business