HMH Algebra 2, Volume 1 1st Edition Module 1 Chapter 1 Exercise 1.1 Analyzing Function
Page 4 Problem 1 Answer
In the question, it is given that A is (1,5).
It is required to determine the location of A′ when A is rotated 90∘ clockwise.
To solve this, multiply the x-value with −1 and switch it with the y-coordinate to get the location of A′.
Multiply the x-coordinate of the point A(1,5) with −1 and simplify using mathematical operations.
A(1⋅(−1),5)=A(−1,5)
Switch the x-value of the point A(−1,5) with the y-coordinate to get the location of A′.
A(−1,5)=A′(5,−1)
The location of A′ when A(1,5) is rotated 90∘ clockwise is A′(5,−1).
Page 4 Problem 2 Answer
In the question, it is given that A is (1,5).
It is required to determine the location of A′ when A is translated 1 unit left.
To solve this, subtract the x-value by 1 as it is translating to the left to get the location of A′.
Subtract the x-coordinate of the point A(1,5) by 1 and simplify using subtraction operations.
A(1−1,5)=A′(0,5)
The location of A′ when A(1,5) is translated 1 unit left is A′(0,5).

Page 4 Problem 3 Answer
In the question, it is given that A is (1,5).
It is required to determine the location of A′ when A is reflected across the x-axis.
To solve this, multiply the y-value with −1 and simplify to get the location of A′.
When the point is reflected across the x-axis, the y-coordinate will become negative and the x-coordinate will remain the same.
Multiply the y-coordinate of the point A(1,5) with −1 and simplify using mathematical operations.
A(1,5⋅(−1))=A′(1,−5)
The location of A′ when A(1,5) is reflected across the x-axis is A′(1,−5).
HMH Algebra 2 Volume 1 Module 1 Chapter 1 Exercise 1.1 Solutions
HMH Algebra 2, Volume 1 1st Edition Module 1 Chapter 1 Exercise 1.1 Analyzing Function Page 6 Problem 4 Answer
In the question intervals [0,5], [0,5) and (0,5) are given.
It is required to show the common interval and the difference between them.
To solve this, check the interval notations of the given intervals and evaluate the answer.
Write the given intervals,[0,5], [0,5) and (0,5)And check their interval notations.
Upon visualization, it is evident that numbers between 0 and 5 are common in the interval [0,5], [0,5) and (0,5).
The difference between the intervals [0,5], [0,5) and (0,5) are,
In interval [0,5], 0 and 5 both are included in the interval.
In interval [0,5), 0 is included but the 5 is not.
In interval (0,5), the numbers between 0 and 5 are included, but the value 0 and 5 are not.
In the intervals [0,5], [0,5) and (0,5), the numbers between 0 and 5 are common.
The difference is that, in interval [0,5], 0 and 5 both are included in the interval, in interval [0,5), 0 is included but the 5 is not and in interval (0,5), the numbers between 0 and 5 are included, but the value 0 and 5 are not.
Page 4 Problem 5 Answer
It is given in the question that the graph of the quadratic function f(x)=−x2 is, It is required to write the domain and range of function using an inequality, set notation and using interval notation.
To solve this, use the concept of intervals along with the knowledge of domain and range to write the notations in the form of inequality, set and intervals.
The graph of the function f(x)=−x2 is

By analyzing the function and the graph the domain and range of the function can be known.
The domain of function f(x)=−x2 in inequality, set notation and using interval notation is as follows,
Inequality notation: −∞<x<∞
Set notation: {x∣−∞<x<∞}
Interval notation: (−∞,∞)
The range of function f(x)=−x2 in inequality, set notation and using interval notation is as follows,
Inequality notation: −∞<x⩽0
Set notation: {x∣−∞<x⩽0}
Interval notation: (−∞,0]
The end behaior of the function f(x)=−x2 is,
As x→∞
, f(x)→−∞
As x→−∞
, f(x)→−∞
The domain and range of function are as follows,
Domain:
Inequality notation: −∞<x<∞
Set notation: {x∣−∞<x<∞}
Interval notation: (−∞,∞)
Range:
Inequality notation: −∞<x⩽0
Set notation: {x∣−∞<x⩽0}
Interval notation: (−∞,0]
The end behavior of the function f(x)=−x2 is, As x→∞, f(x)→−∞
As x→−∞
, f(x)→−∞
The function f(x)=−x2 will always lead to a non positive real number.
HMH Algebra 2 Module 1 Chapter 1 Exercise 1.1 Analyzing Functions Answers
HMH Algebra 2, Volume 1 1st Edition Module 1 Chapter 1 Exercise 1.1 Analyzing Function Page 4 Problem 6 Answer
It is given that the domain of the function f(x)=3/4x+2 is changed to (−4,4) instead of [−4,4].
It is required to depict the change in the graph due to change in the domain of the function.
To solve this, insert the end point values of the domain in the function and analyze the result.
Earlier the domain of the function f(x)=3/4x+2 was [−4,4].
Calculate the f(x) for the endpoints of domain.
Substitute x=−4 in function f(x) and simplify using the division and addition properties.
f(−4)=3/4
(−4)+2
f(−4)=(−3)+2
f(−4)=−1
Substitute x=4 in function f(x) and simplify using the division and addition properties.
f(4)=3/4
(4)+2
f(4)=(3)+2
f(4)=5
The domain of the function changes from to .
Since, and , then the new domain , will not contain and in its range.
Therefore, the endpoints and will not be included in the graph for the domain .
The graph does not include the endpoints (4,5) and (−4,−1) when the domain is (−4,4) instead of [−4,4].
Page 9 Problem 7 Answer
In the question, the given function and domain is f(x)=2/3x−1, (−∞,3].
It is required to draw the graph for the function and determine its range.
To solve this, first plot the graph of the given function, then substitute the value of x
from the domain to the given function and simplify to determine its range.
Plot the graph of the function f(x)=2/3x−1 with the domain (−∞,3]

Substitute the value x=3 in the function f(x)=2/3x−1 and simplify using simple Mathematical operations.
Calculation when x=3 is substituted gives
f(x)=2/3
(3)−1
f(3)=2−1
f(3)=1
Substitute the value x=0 in the function f(x)=2/3x−1 and simplify using simple Mathematical operations.
Calculation when x=0 is substituted gives
f(x)=2/3
(0)−1
f(0)=0−1
f(0)=−1
As x→−∞,f(x)→−∞
Range: (−∞,1]
The range of the function f(x)=2/3x−1 is (−∞,1].
Page 11 Problem 8 Answer
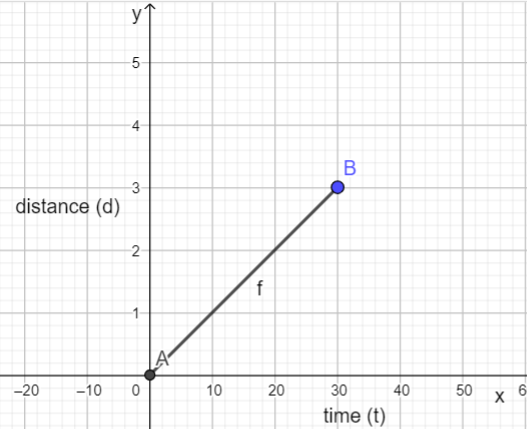
In the question, it is given that Joyce jogs for 30min.
It is required to determine how the domain changes.
To solve this, domain is the time interval in minutes during which Joyce jogs.
Since Joyce jogs for 30 min and time is always a positive integer.Therefore, Domain: 0⩽t⩽30
The domain of the function changes as 0⩽t⩽30.
HMH Algebra 2, Volume 1 1st Edition Module 1 Chapter 1 Exercise 1.1 Analyzing Function Page 11 Problem 9 Answer
In the question, it is given that Joyce jogs for 30min.
It is required to determine how the graph changes.
To solve this, plot the graph with intervals 0⩽t⩽30 and 0⩽d⩽3 to observe the changes.
Plot the graph with the intervals 0⩽t⩽30 and 0⩽d⩽3.
The graph becomes steeper as the interval of time and distance change which is directly proportional to speed.
The graph can be plotted with 0⩽t⩽30 and 0⩽d⩽3
we observe the change that the graph becomes steeper as the interval of time and distance change which is directly proportional to speed.
Page 11 Problem 10 Answer
In the question, it is given that Joyce jogs for 30min.
It is required to determine how the range changes.
To solve this, range is the distance (in miles) covered by Joyce in the time t in the domain.
Since Joyce jogging rate is 0.1miles/min.
Her jogging distance (in miles) at any time t (in minutes) is given by d(t)=0.1t
Therefore, Range: 0⩽d⩽3.
The range of the function changes as 0⩽d⩽3.
HMH Algebra 2 Chapter 1 Exercise 1.1 Key For Analyzing Functions
HMH Algebra 2, Volume 1 1st Edition Module 1 Chapter 1 Exercise 1.1 Analyzing Function Page 11 Problem 11 Answer
In the question it is given that on a moving walkway one is carried 25 feet every 15sec for 1min.
It is required to write a function to model the situation and determine domain, range and plot the graph.
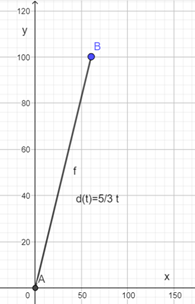
To solve this, model the function using distance in terms of time to form a linear function, then obtain the domain and range. Plot the graph using the obtained domain and range.
The function modelling the distance in terms of time is a linear function:
d(t)=mt+n
Since at time t=0, the distance will be zero, simplify using simple addition properties to find n:
d(0)=0
0+n=0
n=0
The rate mcan be computed as m=d/t where d is 25feet and t is 15sec
Substitute the respective values in the equation for rate and simplify using simple division.
m=d/t
m=25/15
m=5/3
Substituting the value of min the linear function of time d(t)=5/3t
For the domain, use the time interval in seconds.
t=1min
t=60sec
The domain: {t∣0⩽t⩽60}=[0,60]
For the range, it is the distance for the given time interval:
For t=0
d(0)=0
Similarly for t=60
d(60)=100
The range: {d∣0⩽d⩽100}=[0,100]
Plot the graph with the interval {t∣0⩽t⩽60}=[0,60]and {d∣0⩽d⩽100}=[0,100]
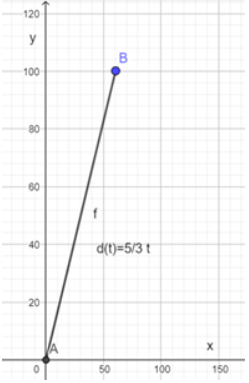
The function is d(t)=5/3t, the domain for the function is {t∣0⩽t⩽60}=[0,60] and range is {d∣0⩽d⩽100}=[0,100].
Page 11 Problem 12 Answer
In the question it is given aand bare real numbers and a<b
It is required to write four different intervals with aand bas endpoints
To solve this, consider the four intervals as (a,b), (a,b], [a,b), [a,b]
(a,b): This interval includes real numbers from a to b excluding a and b.
(a,b]: This interval includes real numbers from a to b excluding a .
[a,b): This interval includes real numbers from a to b excluding b.
[a,b]: This interval includes real numbers from a to b.
The four different intervals with aand bas endpoints are (a,b), (a,b], [a,b), [a,b].
HMH Algebra 2, Volume 1 1st Edition Module 1 Chapter 1 Exercise 1.1 Analyzing Function Page 12 Exercise 1 Answer
In the question, the following number line is given:
It is required to write the interval as given in the number line as an inequality, set notation and interval notation.
To solve this, use the number line to determine the line’s interval and express it as an inequality, set notation and interval notation.

For the given number line, the interval is all real numbers from 5 to infinity, including 5.
The finite interval for the number line is x≥5.
Thus, the set notation for the number line is {x∣x≥5}and the interval notation is [5,+∞).
The number line’s interval as an inequality is x≥5.
The set notation for the number line is {x∣x≥5} and the interval notation is [5,+∞).
Page 12 Exercise 2 Answer
In the question, the given interval is (5,100].
It is required to write the interval as an inequality and using set notation.
To solve this, use the numbers and the parenthesis of the interval to express it as an inequality and as a set notation.
The interval (5,100] is all real numbers from 5 to 100, including 100 but not including 5.
The interval expressed as an inequality is 5<x≤100.
Thus, the interval using set notation is {x∣5<x≤100}.
The interval written as an inequality is 5<x≤100. The interval expressed as a set notation is {x∣5<x≤100}.
Page 12 Exercise 3 Answer
In the question, the given interval is −25≤x<30.
It is required to write the interval using set notation and interval notation.
To solve this, use the numbers and inequality signs in the interval to express it as a set notation and interval notation.
The inequality −25≤x<30 means that the interval is all real numbers from −25 to 30, including −25 but not including 30.
The interval expressed as a set notation is {x∣−25≤x<30}.
Thus, the interval expressed as an interval notation is [−25,30).
The interval written as a set notation is {x∣−25≤x<30}. The interval expressed as an interval notation is [−25,30).
HMH Algebra 2, Volume 1 1st Edition Module 1 Chapter 1 Exercise 1.1 Analyzing Function Page 12 Exercise 4 Answer
In the question, the given interval is {x∣−3<x<5}.
It is required to write the interval as an inequality and using interval notation.
To solve this, use the numbers and inequality signs in the set notation to express it as an inequality and interval notation.
The interval is all real numbers from −3 to 5, but not including −3 and 5.
The interval expressed as an inequality from the set notation {x∣−3<x<5} is −3<x<5.
Thus, the interval expressed as an interval notation is (−3,5).
The interval written as an inequality is −3<x<5. The interval expressed as an interval notation is (−3,5).
Page 12 Exercise 5 Answer
In the question, the graph of quadratic function f(x)=x2+2 is given as shown below:
It is required to write the function’s domain and range as an inequality, set notation and interval notation.
It is also required to describe the end behaviour of the function.
To solve this, use the graph to determine the function’s domain and range.
Write the domain and range as an inequality, set notation and interval notation. Describe the end behaviour of the function from the curve in the graph.
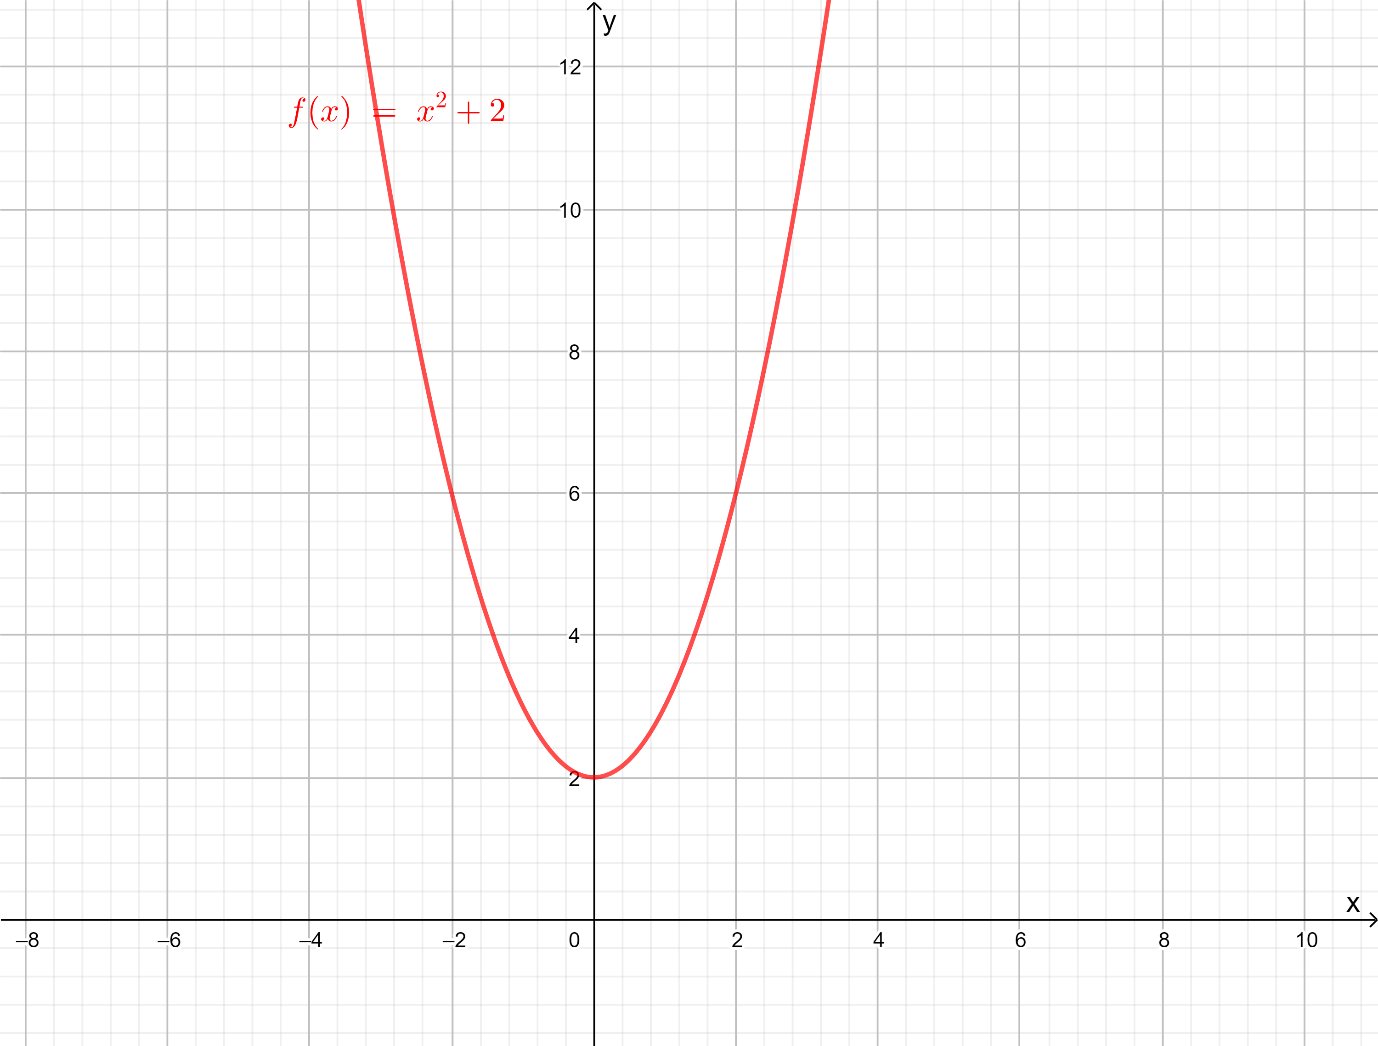
The function’s f(x)=x2+2 domain will be the set of all real numbers. The domain written as an interval is −∞<x<+∞.
The domain expressed as a set notation is {x∣−∞<x<+∞}.
Thus, the domain expressed as an interval notation is (−∞,+∞).
The function’s f(x)=x2+2 range will be the set of all real numbers from 2 to infinity, including 2.
The range written as an interval is 2≤f(x)<+∞\.
The range expressed as a set notation is {f(x)∣2≤f(x)<+∞}.
Thus, the range expressed as an interval notation is [2,+∞).
As the value of x tends towards +∞ or −∞, the end behaviour of function f(x) tends towards +∞.
The domain written as an interval is −∞<x<+∞ and as a set notation is {x∣−∞<x<+∞}.
The domain expressed as an interval notation is (−∞,+∞).
The range written as an interval is 2≤f(x)<+∞ and as a set notation is {f(x)∣2≤f(x)<+∞}. The range expressed as an interval notation is [2,+∞).
As the value of x tends towards+∞ or −∞, the end behaviour of functionf(x)tends towards +∞.
HMH Algebra 2 Exercise 1.1 Analyzing Functions Answer Guide
HMH Algebra 2, Volume 1 1st Edition Module 1 Chapter 1 Exercise 1.1 Analyzing Function Page 13 Exercise 6 Answer
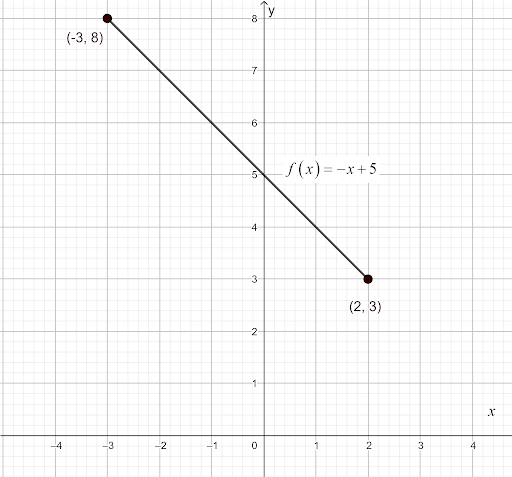
In the question, the given function is f(x)=−x+5 and the domain is [−3,2]. The below diagram has been given:
It is required to draw the function’s graph and state the function’s range using the same notation as the domain.
To solve this, draw the graph using the given function and the domain.
Determine the function’s range from the graph and write it in the same notation as the domain.
The function’s domain is given as [−3,2]. Hence, the x-coordinates of two endpoints of the line are −3 and 2.
The y-coordinates of two endpoints will be f(−3) and f(2).

Substitute x as −3 in the equation f(x)=−x+5 and simplify using mathematical operations to determine the y-coordinate.
f(x)=−(−3)+5
=3+5
=8
Hence, one endpoint of the line given by f(x)=−x+5 is (−3,8).
Substitute x as 2 in the equation f(x)=−x+5 and simplify using mathematical operations to determine the y-coordinate.
f(x)=−2+5
=3
Hence, another endpoint of the line given by f(x)=−x+5 is (2,3).
Draw the function’s f(x)=−x+5 graph in the domain [3,8].
Page 12 Exercise 7 Answer
From the graph, the function’s range is [3,8].
The function’s f(x)=−x+5 graph in the domain [−3,2] is shown below:
The function’s range is [3,8].
HMH Algebra 2, Volume 1 1st Edition Module 1 Chapter 1 Exercise 1.1 Analyzing Function Page 13 Exercise 8 Answer
In the question, the given function is f(x)=3x/2+1 and the domain is {x∣x>−2}. The below diagram has been given:

It is required to draw the function’s graph and state the function’s range using the same notation as the domain.
To solve this, draw the graph using the given function and the domain. Determine the function’s range from the graph and write it in the same notation as the domain.
The function’s domain is given as {x∣x>−2}.
The domain of the function is all real numbers from −2 to +∞ but not including x.
Hence, the x-coordinate of one endpoint of the ray is −2.
The y-coordinate of endpoint will be f(−2).
Substitute x as −2 in the equation f(x)=3x/2+1 and simplify using mathematical operations to determine the y-coordinate.
f(x)=3⋅(−2)/2+1
=−3+1
=−2
Hence, one endpoint of the line given by f(x)=3x/2+1 is (−2,−2).
Take another point x=2 to find another point for drawing the graph.
Substitute x as 2 in the equation f(x)=3x/2+1 and simplify using mathematical operations to determine the y-coordinate.
f(x)=3⋅2/2+1
=3+1
=4
Hence, another endpoint of the line given by f(x)=3x/2+1 is (2,4).
Draw the function’s f(x)=3x/2+1 graph in the domain {x∣x>−2}.

From the graph, the function’s range is {f(x)∣f(x)>−2}.
The function’s f(x)=3x/2+1
graph in the domain{x∣x>−2} is shown below:
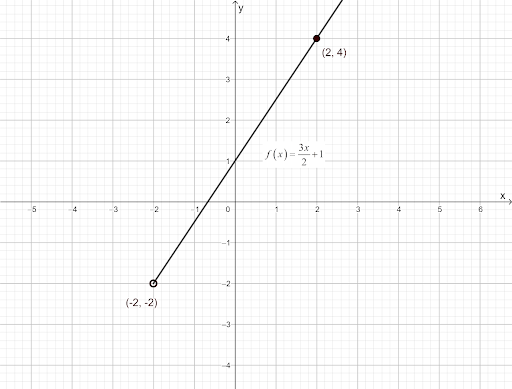
The function’s range is {f(x)∣f(x)>−2}.
HMH Algebra 2, Volume 1 1st Edition Module 1 Chapter 1 Exercise 1.1 Analyzing Function Page 14 Exercise 9 Answer
In the question, it is given that a building is 90 metres above ground and an elevator starts at a floor, and descends 2 metres every 0.5 seconds for 6 seconds.
The below diagram has been given:

It is required to write a function modelling the situation and draw the function’s graph after stating its domain.
It is also required to identify the function’s range using inequality.
To solve this, use the given data to write a function that models the situation. Find the domain and draw the graph using the domain.
Determine the function’s range from the graph.
The elevator travels at 2 metres every 0.5 seconds, or 4 metres every second.
Let t be the total time the elevator descends. The total distance f(t) travelled by the elevator descending from 90 metres can be written as:
f(t)=90−4t
Since the total time travelled by the elevator has been given as 6seconds, the function’s domain is 0≤t≤6.
Substitute t as 6 in the equation f(t)=90−4t and simplify using mathematical operations to determine the range.
f(t)=90−4⋅6
=90−24
=66
Hence, the range of the function is 66≤f(t)≤90.
Draw the function’s f(t)=90−4t graph in the domain 0≤t≤6.
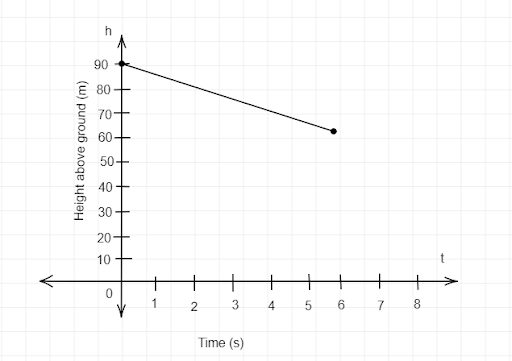
The given situation can be written as the function’s f(t)=90−4t with the domain 0≤t≤6 and range 66≤f(t)≤90.
The function’s graph has been shown below:

Step-By-Step Solutions For HMH Algebra 2 Module 1 Exercise 1.1
HMH Algebra 2, Volume 1 1st Edition Module 1 Chapter 1 Exercise 1.1 Analyzing Function Page 15 Exercise 10 Answer
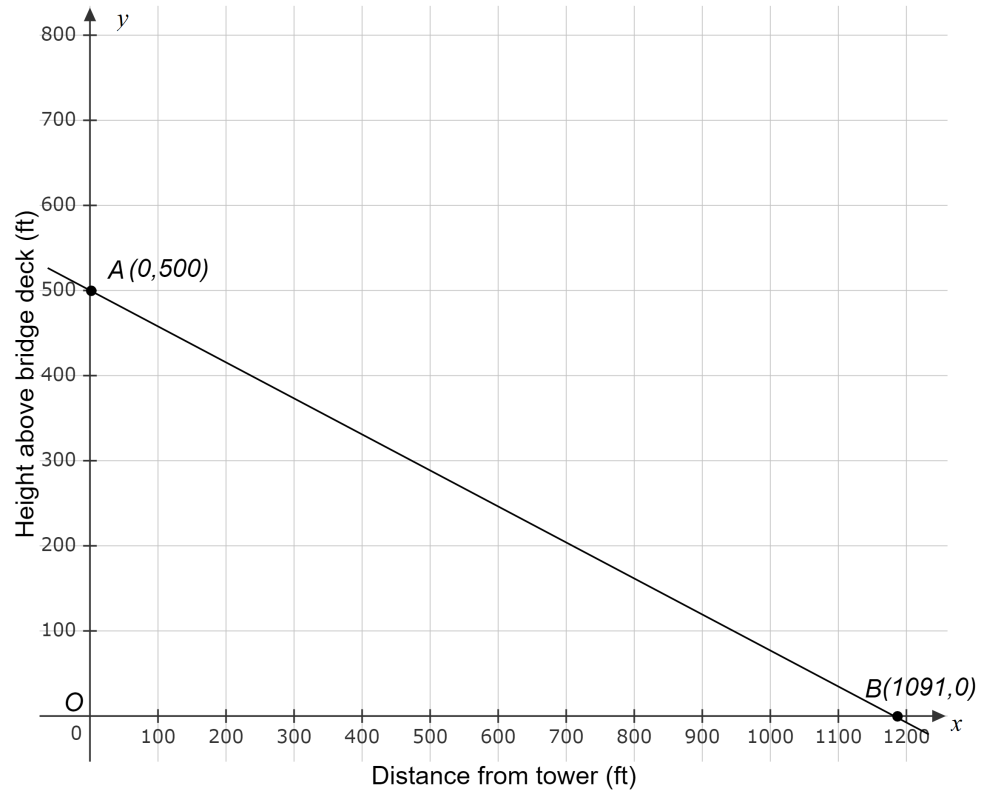
It is given in the question that the height from the bridge deck to the top of the tower, where a cable is anchored is 500 feet, and the length of the cable is 1200 feet.
It is required to sketch the cable on a coordinate plane, where x-axis represents the bridge deck and y-axis represents the tower.
It is required to write the linear function for the model graph and identify the domain and range, writing each as an inequality, using set notation, and using interval notation.
To solve this, draw a graph where x axis represents the bridge deck and y-axis represents the tower.
Find the coordinates of the end points where the cables are attached using the Pythagoras theorem.
Write the linear function for the cable line obtained and identify the domain and range of the function.
Draw the graph for the required situation and mark the points accordingly.

Use the Pythagoras theorem to get the distance OB.
It is given that OA=500and ABthe length of the cable is 1200.
According to Pythagoras theorem,OA2+OB2=AB2
Subtract OA2 from both the sides and simplify the equation OA2+OB2=AB2,
OB2=AB2−OA2
Square root each sides of the equation OB2=AB2−OA2,
OB=√AB2−OA2
Substitute the value of OA=500 and AB=1200 in the equation OB=√AB2−OA2,
OB=√(1200)2−(500)2
Square the terms within the bracket in the equation OB=√(1200)2−(500)2, and simplify using the subtraction properties.
OB=√1440000−250000
OB=√1190000
OB=1090.87
OB≈1091
Determine the coordinates of points A and B.
It is known that OA=500 and OB=1091 .
So the coordinates of points A and B are,A(0,500) B(1091,0)
Write the equation for the line AB using the coordinates of points A and B.
The equation of a line with two known points is,
y−y1=y2−y1
x2−x1
(x−x1) where, x, y are the variables and (x1,y1) and (x2,y2) are the two points on the line.
Let point A be (x1,y1) and point B be (x2,y2).
Substitute the value A(0,500) and B(1091,0) in the equation of line, y−y1
=y2−y1/x2−x1(x−x1)
y−500=0−500/1091−0(x−0)
Add 500 on both sides of the equation y−500=0−500/1091−0
(x−0), and simplify using the addition property.
y=0−500/1091−0
(x−0)+500
y=−500/1091
x+500
Thus, the linear equation of line is y=−500
1091
x+500
By visualizing the graph, it is evident that input values of x can vary from 0 to 1091.
Therefore, the domain of function is 0⩽x⩽1091.
Set notation: {x∣0⩽x⩽1091}
Interval notation: [0,1091]
Substitute the endpoints of the domain in the function, the required results obtained will be the Range of function.
Put x=0 in the equation
y=−500/1091
x+500, and simplify using addition properties.
y=−500/1091
x+500
y=−500/1091
(0)+500
y=500
Put x=1091in the equation y=−500/1091 x+500, and simplify using addition properties.
y=−500/1091
x+500
y=−500/1091 (1091)+500
y=−500+500
y=0
Therefore, the range of function is0⩽y⩽500.
Set notation:{x∣0⩽y⩽500}
Interval notation:[0,500]
The linear function whose graph models the cable is y=−500/1091
x+500.
Domain of the function:
Inequality: 0⩽x⩽1091
Set notation: {x∣0⩽x⩽1091}
Interval notation: [0,1091]
Range of the function:
Inequality: 0⩽y⩽500
Set notation:{x∣0⩽y⩽500}
Interval notation:[0,500]
The model graph is as shown below,