
Envision Math Grade 8 Volume 1 Student Edition Solutions Chapter 2 Analyze And Solve Linear Equations Exercise 2.8
Page 135 Exercise 1 Answer
To find the age of horse in human years.
We find that by first dividing the horse age with 5 and after that multiplying the result by 2
\(\frac{50}{2}=10\)10 * 2 = 20
The horse is 20 years old in human years.
So now we have to subtract 8 years from the years of the horse and we will get,
20 − 8 = 12
Hence, the horse was 12 human years old when Alex was born.
Page 135 Exercise 1 Answer
To find the age of cat in human years.
To find out how old is the cat in human years.
We have to divide the cat years with 8 and after that multiply the result with 2.
\(\frac{64}{8}=8\)8 * 2 = 16
Hence, the cat is 16 human years old.
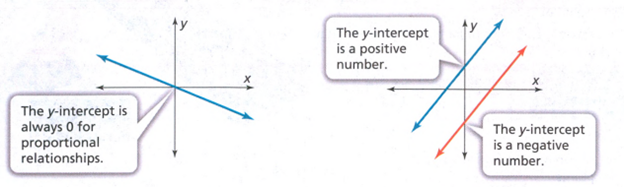
Page 136 Question 1 Answer
The y−intercept is the value of y−coordinate in point at which the line crosses the y−axis.
When the line crosses through the origin, the y−intercept is 0.
When the line crosses above the origin, the y−intercept is positive.
When the line crosses below the origin, the y−intercept is negative.

The y−intercept is the value of y−coordinate in point at which the line crosses the y−axis.
Envision Math Grade 8 Volume 1 Chapter 2 Exercise 2.8 Linear Equations Solutions
Envision Math Grade 8 Volume 1 Student Edition Solutions Chapter 2 Analyze And Solve Linear Equations Exercise 2.8 Page 136 Exercise 1 Answer
The given table is,
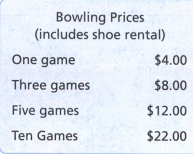
We need to find the pattern that we can see in the costs of different numbers of games given.
From the given table, the cost of one game is $4
The cost of three games is $8.
The difference between the cost and the number of games will be,
(3−1)games = (8−4)dollars
2games = 4dollars
1game = 2dollars
Thus, for the increase in one game, the cost increases by $2.
This can be represented by the equation,
(1+n)games = (4+2(n))dollars
Thus for 10 games, the cost will be,
(1+n)games = (4+2(n))dollars
(1+9)games = (4+2(9))dollars
10games = (4+18)dollars
10games = 22dollars
Thus, a certain pattern is observed.
The pattern which we observe in the costs of different numbers of games is that after every one game, there is $2 increase in the price.
Page 136 Exercise 1 Answer
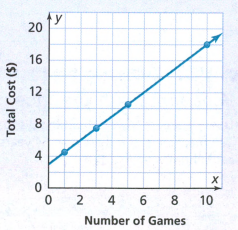
We have to find the slope of the given line.
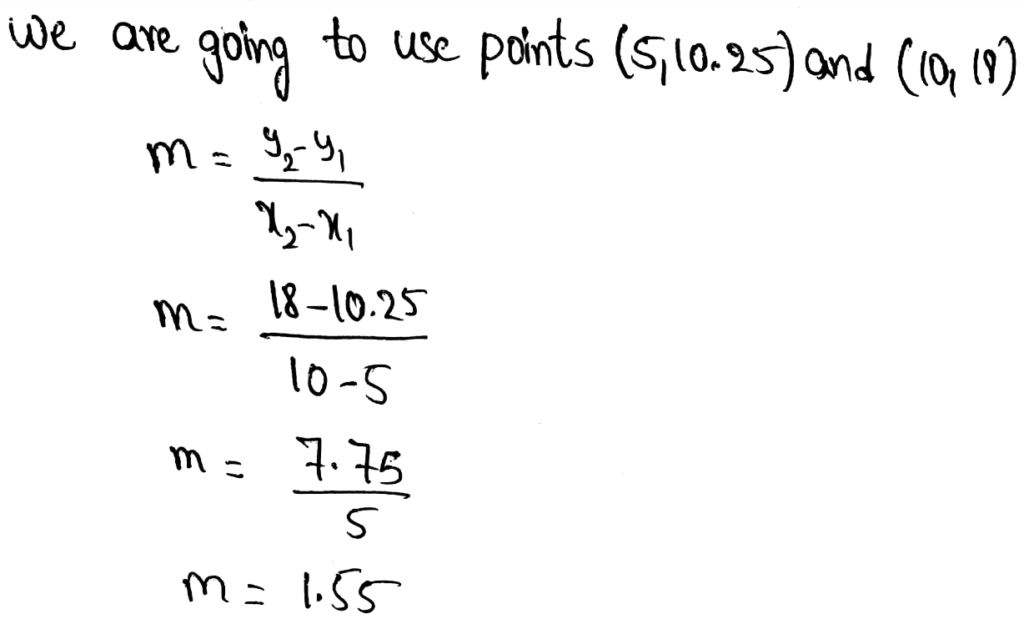
The cost of each game is 1.55
The y−intercept has to be read from the graph but it is not clear.
We are going to say that the y−intercept is 3.5.
Hence, the y−intercept is 3.5.
Page 137 Exercise 2 Answer
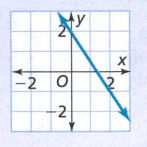
We can see that the y-intercept is 2 because the value of y-coordinate is 2 When the line crosses the y-axis.
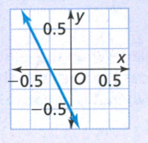
We can see that the y-intercept is -0.5
y-intercept for the first graph is 2 and for the second graph is -0.5.
Envision Math Grade 8 Exercise 2.8 Analyze And Solve Linear Equations
Envision Math Grade 8 Volume 1 Student Edition Solutions Chapter 2 Analyze And Solve Linear Equations Exercise 2.8 Page 136 Exercise 1 Answer
We need to explain why does the y-intercept represent the cost to rent bowling shoes in these examples.
The y−intercept can be found when the value of x = 0
This means that the y−intercept is the value when there are no games.
That is, the number of games played is zero.
The y−intercept of the line is obtained to be $2.
This means that the cost to rent bowling shoes is $2.
At the y−intercept, the number of games played is zero. This is why the y−intercept represents the cost to rent bowling shoes.
Page 138 Exercise 1 Answer
The y−intercept is the value of y−coordinate in point at which the line crosses they−axis.
When the line crosses through the origin, the y−intercept is0
When the line crosses above the origin, the y−intercept is positive.
When the line crosses below the origin, the y−intercept is negative.
The y-intercept is the value of y-coordinate in point at which the line crosses the y−axis.
Envision Math Grade 8 Volume 1 Student Edition Solutions Chapter 2 Analyze And Solve Linear Equations Exercise 2.8 Page 138 Exercise 2 Answer
Since we know that the y−intercept is always 0 for the proportional relationships and the Bradyn’s graph passes through the origin which is point(0,0), that means that the both lines has y−intercept 0.
Hence, the both y−intercepts are 0.
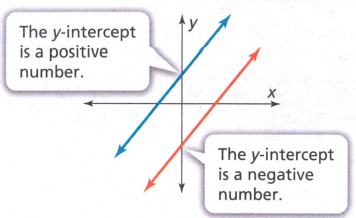
Page 138 Exercise 3 Answer
When the line crosses above the origin, the y−intercept is positive.
When the line crosses below the origin, the y−intercept is negative.
When the line crosses above the origin, the y-intercept is positive.
When the line crosses below the origin, the y-intercept is negative.
Analyze And Solve Linear Equations Grade 8 Exercise 2.8 Envision Math
Envision Math Grade 8 Volume 1 Student Edition Solutions Chapter 2 Analyze And Solve Linear Equations Exercise 2.8 Page 138 Exercise 5 Answer
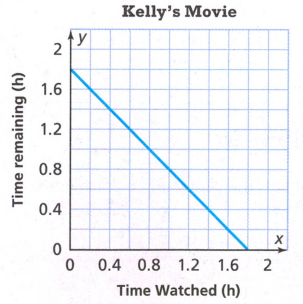
The y−intercept on the given graph is 1.8
This means that the movie is 1.8 hours long.
Hence, the y−intercept on the given graph is 1.8.
Page 139 Exercise 6 Answer
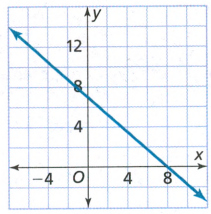
The y−intercept is the point where the graph crosses the y−axis.
This means that we need to find the point which has x−coordinate is 0
The line crosses the y−axis at the point(0,7).
So, the y−intercept is 7.
Hence, the line crosses the y−axis at the point(0,7). So, the y−intercept is 7.
Envision Math Grade 8 Volume 1 Student Edition Solutions Chapter 2 Analyze And Solve Linear Equations Exercise 2.8 Page 139 Exercise 7 Answer
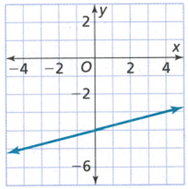
The y−intercept is the point where the graph crosses the y−axis.
This means that we need to find the point which has x−coordinate is 0
The line crosses the y−axis at the point (0,−4).
So, the y−intercept is −4.
Hence, the y−intercept is −4.
Page 139 Exercise 8 Answer
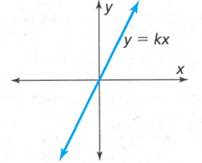
We can see from the graph the line passes through the origin.
This means that the graph passes through the point (0,0) and that means that the y-intercept is 0.
Hence, the y-intercept is 0.
Page 139 Exercise 9 Answer
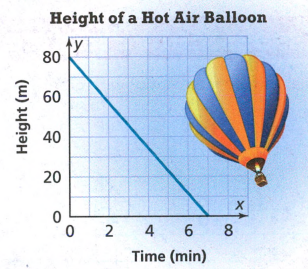
We have to find the value of y−coordinate in the point at which the line crosses the y−axis.
We can see from the graph this point is(0,80). So,the y−intercept is 80
The height of the air balloon when it began to descent was 80 meters.
Hence, the height of the air balloon was 80 meters.
Envision Math Grade 8 Chapter 2 Exercise 2.8 Solutions
Envision Math Grade 8 Volume 1 Student Edition Solutions Chapter 2 Analyze And Solve Linear Equations Exercise 2.8 Page 139 Exercise 10 Answer
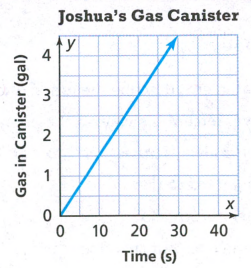
We can see from the graph the line crosses through the origin. So the y−intercept is 0.
When the y-intercept is for the given function it means that there was no gas in the canister.
Hence, the y−intercept is 0.
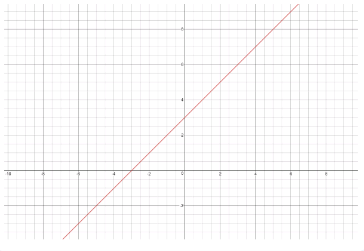
Page 140 Exercise 11 Answer

The y−intercept is the point where the graph crosses the y−axis.
This means that we need to find the point which has x−coordinate is 0
The line crosses the y−axis at the point(0,4).
So, the y−intercept is 4.
Hence, the y−intercept is 4.
The y−intercept tells us what the temperature was when it was sunrise.
The y−intercept tells us the temperature at sunrise.
Envision Math 8th Grade Exercise 2.8 Step-By-Step Linear Equation Solutions
Envision Math Grade 8 Volume 1 Student Edition Solutions Chapter 2 Analyze And Solve Linear Equations Exercise 2.8 Page 140 Exercise 12 Answer
Given

To find/solve
a. Explain your friend’s possible error.
A y-intercept or vertical intercept is a point where the graph of a function or relation intersects the y-axis of the coordinate system. These points satisfy x = 0.
On the given graph we can see that the y-intercept is -4. The student had switched the x-intercept and y-intercept.
The student has switched x and y intercepts.
The student has switched x and y intercepts.
To find/solve
Draw a line on the graph that does represent a y-intercept of 3.
On the given graph we can see the line that has y-intercept is 3.
Draw a line that crosses the y-axis at y = 3.
Draw a line that crosses the y-axis at y = 3.
How To Solve Exercise 2.8 Linear Equations In Envision Math Grade 8
Page 140 Exercise 13 Answer
Given
Graph
To find/solve
What is the y-intercept.
We simply have to look closely at each graph and find the point at which the line passes through the y-axis.
As we can see from the first graph the y-intercept is at point (0,-3) which means that the y-intercept of given graph is -3.
As for the second graph we can see that the point at which he line crosses the y-axis is (0,3). This means that the y-intercept for the second graph is 3.
The y-intercept of first graph is -3 and of the second graph is 3.
The y-intercept of first graph is -3 and of the second graph is 3.