
Envision Math Grade 8 Volume 1 Student Edition Solutions Chapter 2 Analyze And Solve Linear Equations Exercise 2.6
Page 123 Exercise 1 Answer
We are given that Rashida earns money as a soccer referee for her town’s under- 10 soccer league. So far, she has worked 5 games and has been paid $98.50. She will work a total of 14 games this fall.
We have to find that how much Rashida will earn refereeing soccer games in this fall.
We know that Rashida earns money as a soccer referee for her town’s under- 10 soccer league. So far, she has worked 5 games and has been paid $98.50. She will work a total of 14 games this fall.
In order to calculate the money earned by Rashida by refereeing soccer games in this fall, we will first find the money she gets for 1 game, which will be evaluated when we divide the money earned by her by the number of games.
When she is the referee for 5 games,
\(\frac{98.5}{5}=19.7\)Thus, Rashida earns $19.7 for refereeing one game.
In this fall she was the referee for 14 games, so she earns
14 × 19.7 = 275.8
Therefore, she earns $275.8 for 14 games.
Rashida will earn $275.8 for refereeing 14 soccer games this fall.
Envision Math Grade 8 Volume 1 Chapter 2 Exercise 2.6 Linear Equations Solutions
Envision Math Grade 8 Volume 1 Student Edition Solutions Chapter 2 Analyze And Solve Linear Equations Exercise 2.6 Page 123 Exercise 1 Answer
We are given that Rashida earns money as a soccer referee for her town’s under- 10 soccer league. So far, she has worked 5 games and has been paid $98.50. She will work a total of 14 games this fall.
We have to find the relation between the number of games and her earnings.
We know that Rashida earns money as a soccer referee for her town’s under- 10 soccer league. So far, she has worked 5 games and has been paid $98.50. She will work a total of 14 games this fall.
In order to calculate the money earned by Rashida by refereeing soccer games in this fall, we will first find the money she gets for 1 game, which will be evaluated when we divide the money earned by her by the number of games.
As Rashida gets her earnings from the game in which she is a referee, there is a relation between the number of games for which she works to her earnings.
Earning and number of games are related, as the earning can be calculated based on the rate and number of game in which she is a referee.
Envision Math Grade 8 Exercise 2.6 Analyze And Solve Linear Equations
Page 123 Exercise 1 Answer
We are given that Rashida earns money as a soccer referee for her town’s under- 10 soccer league. So far, she has worked 5 games and has been paid $98.50. She will work a total of 14 games this fall.
We have to find the change in her earnings if she was paid on basis of per hour.
We know that Rashida earns money as a soccer referee for her town’s under- 10 soccer league. So far, she has worked 5 games and has been paid $98.50. She will work a total of 14 games this fall.
She is paid on the basis of the number of games in which she is a referee.
In case, she is paid on the basis of hours she work, it is necessary to know that for how many hours does she work as a referee.
Also, the amount to be paid to be working for one hour is to be known.
Thus, on basis of hours, her earnings will be calculated where number of hours and pay per hour will be multiplied.
Rashida’s earnings will change if she was paid by hour and not by game, which completely depends on the number of hours she has worked.
Envision Math Grade 8 Volume 1 Student Edition Solutions Chapter 2 Analyze And Solve Linear Equations Exercise 2.6 Page 124 Question 1 Answer
We have to define the term slope.
Slope is defined as the ratio of the change in the y-coordinate to the change in x-coordinate.
It is represented by the letter m.
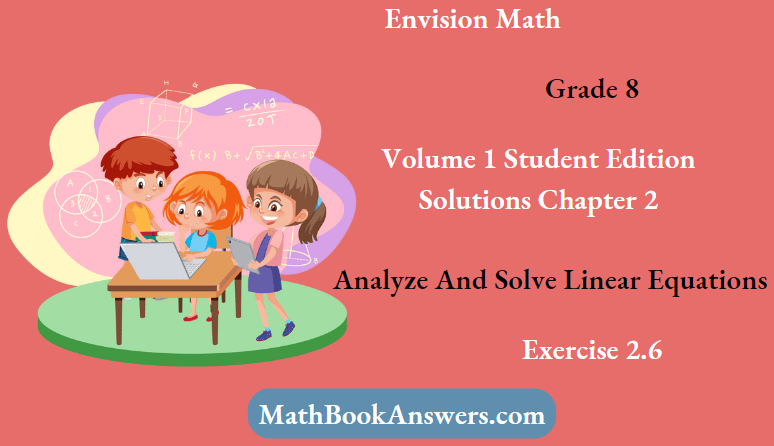
The formula of slope is
\(m=\frac{\Delta y}{\Delta x}\) \(m=\frac{y_2-y_1}{x_2-x_1}\)Slope is the change in y divided by the change in x.
Page 124 Exercise 1 Answer
It is given that Jack graphs how far he plans to bike over a 3-day charity ride.
We have to find the slope of the line.
Slope is defined as the ratio of the change in the y-coordinate to the change in x-coordinate.
It is represented by the letter m.
The slope of the line is obtained as 30.
Analyze And Solve Linear Equations Grade 8 Exercise 2.6 Envision Math
Page 125 Exercise 2 Answer
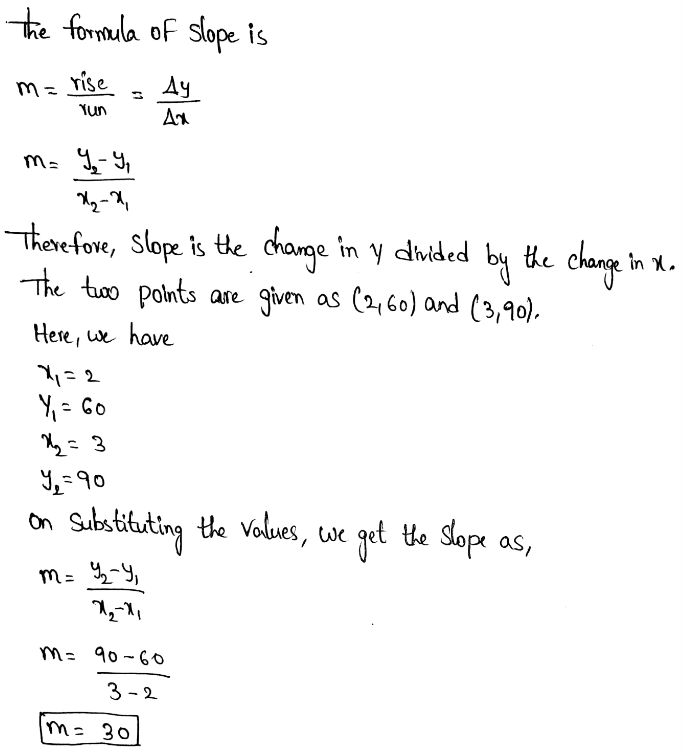
It is given that The graph shows the proportions of red and blue food coloring that Taylor mixes to make purple frosting.
We have to find the slope of the line.
Slope is defined as the ratio of the change in the y-coordinate to the change in x-coordinate.
It is represented by the letter m.
The slope implies that to get the purple food colour, for every 5 blue drops we need to add 7 red drops.
The slope of the line is obtained as \(\frac{7}{5}\) which means that for every 5 blue drops we need to add 7 red drops.
Envision Math Grade 8 Volume 1 Student Edition Solutions Chapter 2 Analyze And Solve Linear Equations Exercise 2.6 Page 124 Exercise 1 Answer
It is given that Jack graphs how far he plans to bike over a 3-day charity ride.
We have to find the slope of the line.
Slope is defined as the ratio of the change in the y-coordinate to the change in x-coordinate.
It is represented by the letter m.
The formula of slope is
\(m=\frac{\text { rise }}{\text { run }}=\frac{\Delta y}{\Delta x}\)\(m=\frac{y_2-y_1}{x_2-x_1}\)
The constant of proportionality is the ratio of vertical distance to the horizontal distance.
The slope of a line is the same as the constant of proportionality.
There is no difference in them at all.
Unit Rate is the rate in which the second quantity is compared to the first quantity.
Whereas, the slope is the unit rate because in it, the second quantity or changes in y is compared to the first quantity which is change in x.
The slope of a line, unit rate and constant of proportionality all are the same.
Page 125 Exercise 1 Answer
We have to tell the relation among coordinates when the slope is negative.
Slope is defined as the ratio of the change in the y-coordinate to the change in x-coordinate.
It is represented by the letter m.
The formula of slope is
\(m=\frac{\Delta y}{\Delta x}\) \(m=\frac{y_2-y_1}{x_2-x_1}\)Therefore, Slope is the change in y divided by the change in x.
When the slope is obtained as a negative value, there is decreasing or descending nature of quantities observed.
Negative slope simply means that the two variables are related negatively.
This means that when x increases, the value of y decreases and similarly, when x decreases, value of y increases.
Negative slope implies that the two variable or coordinates are negatively related to each other.
This means that when x increases, the value of y decreases and similarly, when x decreases, value of y increases.
Envision Math Grade 8 Chapter 2 Exercise 2.6 Solutions
Envision Math Grade 8 Volume 1 Student Edition Solutions Chapter 2 Analyze And Solve Linear Equations Exercise 2.6 Page 126 Exercise 1 Answer
We have to define the term slope.
Slope is defined as the ratio of the change in the y-coordinate to the change in x-coordinate.
It is represented by the letter m.
The formula of slope is
\(m=\frac{\Delta y}{\Delta x}\) \(m=\frac{y_2-y_1}{x_2-x_1}\)Slope is the change in y divided by the change in x.
Page 126 Exercise 2 Answer
We have to define slope and unit rate and find their relation.
Slope is defined as the ratio of the change in the y-coordinate to the change in x-coordinate.
It is represented by the letter m.
The formula of slope is
\(m=\frac{\text { rise }}{\text { run }}=\frac{\Delta y}{\Delta x}\) \(m=\frac{y_2-y_1}{x_2-x_1}\)Unit Rate is the rate in which the second quantity is compared to the first quantity.
Whereas, the slope is the unit rate because in it, the second quantity or change in y is compared to the first quantity which is change in x.
The slope of a line and unit rate both are the same.
Envision Math Grade 8 Volume 1 Student Edition Solutions Chapter 2 Analyze And Solve Linear Equations Exercise 2.6 Page 126 Exercise 3 Answer
We have to define the term slope.
Slope is defined as the ratio of the change in the y-coordinate to the change in x-coordinate.
It is represented by the letter m.
The formula of slope is
\(m=\frac{\text { rise }}{\text { run }}=\frac{\Delta y}{\Delta x}\)\(m=\frac{y_2-y_1}{x_2-x_1}\)
The ratio of any two points located along a straight line is always constant.
As we know slope is nothing but the ratio.
Thus, the slope of a straight line among any two points is always constant or the same.
The slope of a straight line among any two points is always constant or the same, because the the ratio of any two points located along a straight line is always constant.
Page 126 Exercise 4 Answer
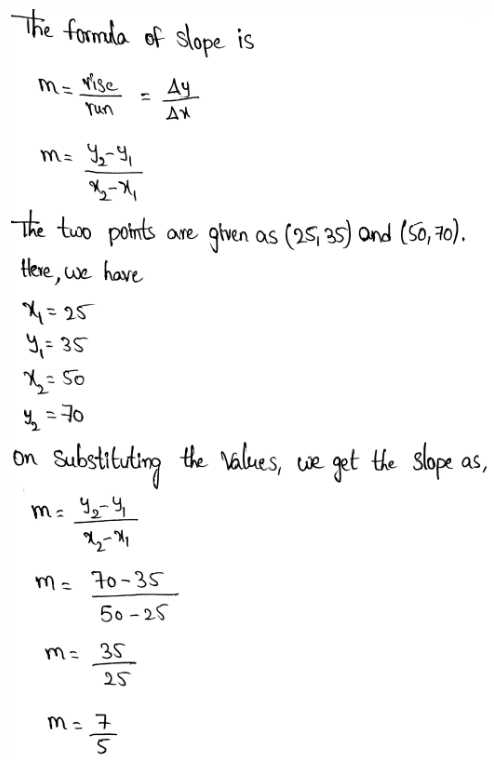
We have to find the slope of line on the given graph.
Slope is defined as the ratio of the change in the y-coordinate to the change in x-coordinate.
It is represented by the letter m.

The slope of the given line is obtained as 3.
Envision Math 8th Grade Exercise 2.6 Step-By-Step Linear Equation Solutions
Envision Math Grade 8 Volume 1 Student Edition Solutions Chapter 2 Analyze And Solve Linear Equations Exercise 2.6 Page 126 Exercise 5 Answer
We have to find the slope of line on the given graph.
Slope is defined as the ratio of the change in the y-coordinate to the change in x-coordinate.
It is represented by the letter m.

We have to find the slope of line on the given graph.
Slope is defined as the ratio of the change in the y-coordinate to the change in x-coordinate.
It is represented by the letter m.
In the given problem situation, the dimensions of the model airplane as the ratio of centimetres to feet is given.
As the slope obtained is 5/3, it denotes that 5cm of dimension, will be equivalent to 3 feet of the dimension.
The slope obtained is 5/3, it denotes that 5 cm of dimension, will be equivalent to 3 feet of the dimension.
Envision Math Grade 8 Volume 1 Student Edition Solutions Chapter 2 Analyze And Solve Linear Equations Exercise 2.6 Page 127 Exercise 7 Answer
We have to find the slope of line on the given graph.
Slope is defined as the ratio of the change in the y-coordinate to the change in x-coordinate.
It is represented by the letter m.
The slope of the given line is obtained as 5.
Page 127 Exercise 8 Answer
We have to find the slope of the line passing through the given points (0,0) and (2,4).
The given graph tells us about the number of soda bottles which a machine makes over the given time.
In order to find, the number of bottles made in one minute, we will have to divide the difference between the y coordinates to the difference in c-coordinates, which is nothing but slope.
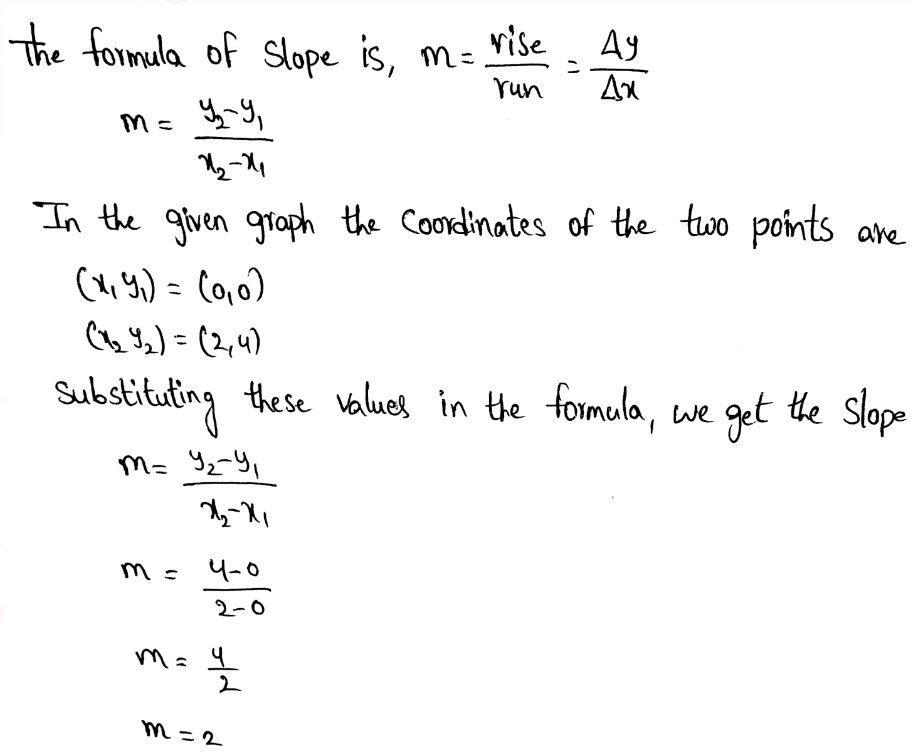
The slope of the line that passes through the points (0,0) and (2,4) is obtained as 2.
How To Solve Exercise 2.6 Linear Equations In Envision Math Grade 8
Envision Math Grade 8 Volume 1 Student Edition Solutions Chapter 2 Analyze And Solve Linear Equations Exercise 2.6 Page 127 Exercise 9 Answer
We have to find the slope of the line passing through the given points (2.1,-4.2) and (2.5,-5).
The given graph tells us about the number of soda bottles which a machine makes over the given time.
In order to find, the number of bottles made in one minute, we will have to divide the difference between the y coordinates to the difference in c-coordinates, which is nothing but slope.
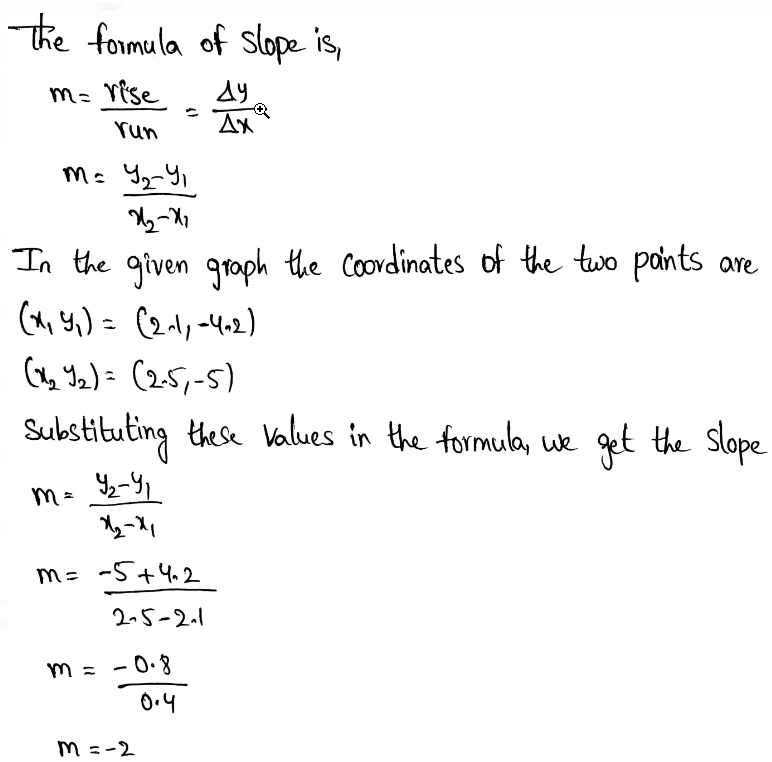
The slope of the line that passes through the points (2.1,-4.2) and (2.5,-5) is obtained as -2.
Page 128 Exercise 11 Answer
We have to find the slope of line on the given graph.
Slope is defined as the ratio of the change in the y-coordinate to the change in x-coordinate.
It is represented by the letter m.
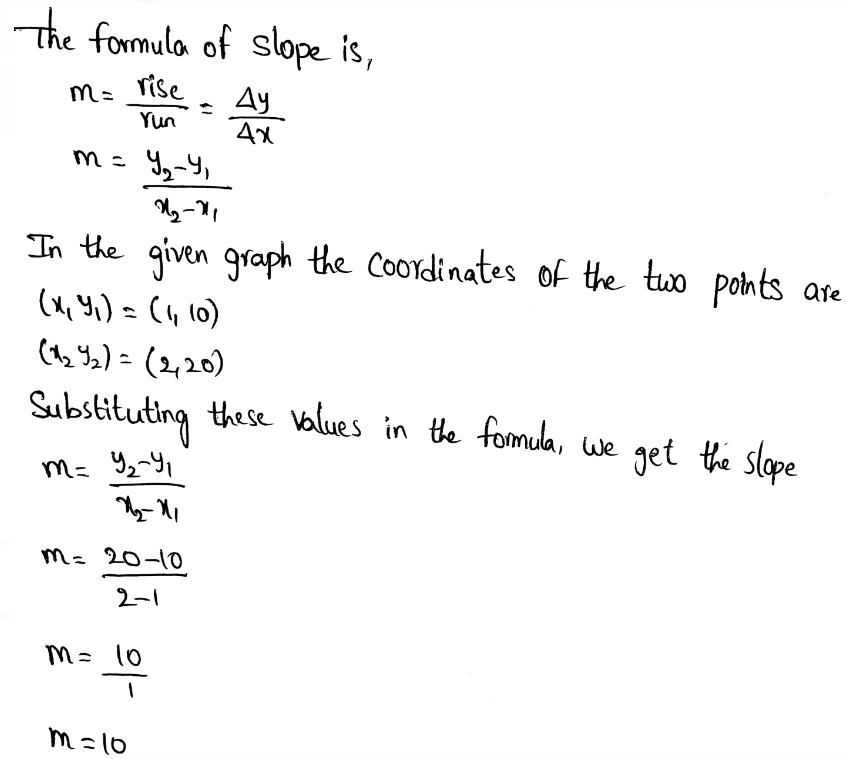
The slope of the given line is obtained as 10.
We have to find the slope of line on the given graph.
Slope is defined as the ratio of the change in the y-coordinate to the change in x-coordinate.
It is represented by the letter m.
In this problem situation, the slope obtained tells us that how many calories Natalia can burn in one minute.
The slope of the given line is obtained as 10, which tells us the amount of calories burned in one minute.
Envision Math Grade 8 Exercise 2.6 Practice Problems
Envision Math Grade 8 Volume 1 Student Edition Solutions Chapter 2 Analyze And Solve Linear Equations Exercise 2.6 Page 128 Exercise 12 Answer
We have to find the speed of the car from the graph given.
Slope is defined as the ratio of the change in the y-coordinate to the change in x-coordinate.
It is represented by the letter m.
We have to evaluate the speed of the car, for which we will consider the point (1,64) which is on the line.
As we know that if we divide the y-coordinate with the x-coordinate, we get the unit rate.
The speed of the car is obtained from the point as
\(\frac{64}{1}=64 \mathrm{miles} / \mathrm{hr}\)The speed of the car is obtained as 64miles/hr
We have to identify the error that Anna made.
The given graph tells us about the speed of the car which is the ratio of distance given in miles to the time which is in hours.
Anna took Time on the x-axis and Distance over the y-axis, which is not appropriate and hence the error he made.
He must take Distance on the x-axis while Time on the y-axis.
Anna took Time on the x-axis and Distance over the y-axis, which is the error he made.
Page 128 Exercise 13 Answer
We have to find the slope of the line passing through the given points (0,0) and (2,4).
The given data tells us that the water level rises 11 centimetres every 5 minutes, which means the slope is 11/5.
In order to find the slope, we will have to divide the difference between the y coordinates to the difference in c-coordinates, which is nothing but slope.
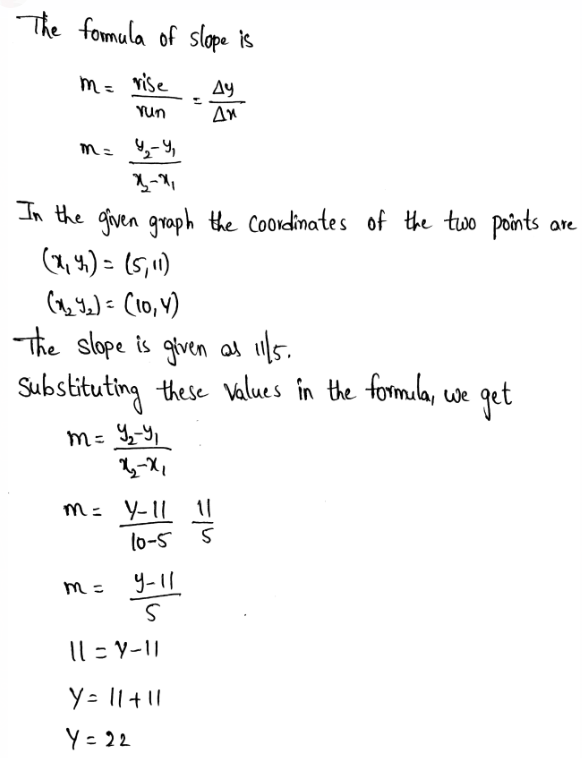
The value of y is obtained as 22.
Envision Math Exercise 2.6 Linear Equations Detailed Answers
Envision Math Grade 8 Volume 1 Student Edition Solutions Chapter 2 Analyze And Solve Linear Equations Exercise 2.6 Page 128 Exercise 14 Answer
We have to find the slope of the line passing through the given points (15,21) and (25,35).
In order to find the slope, we will have to divide the difference between the y coordinates to the difference in c-coordinates, which is nothing but slope.
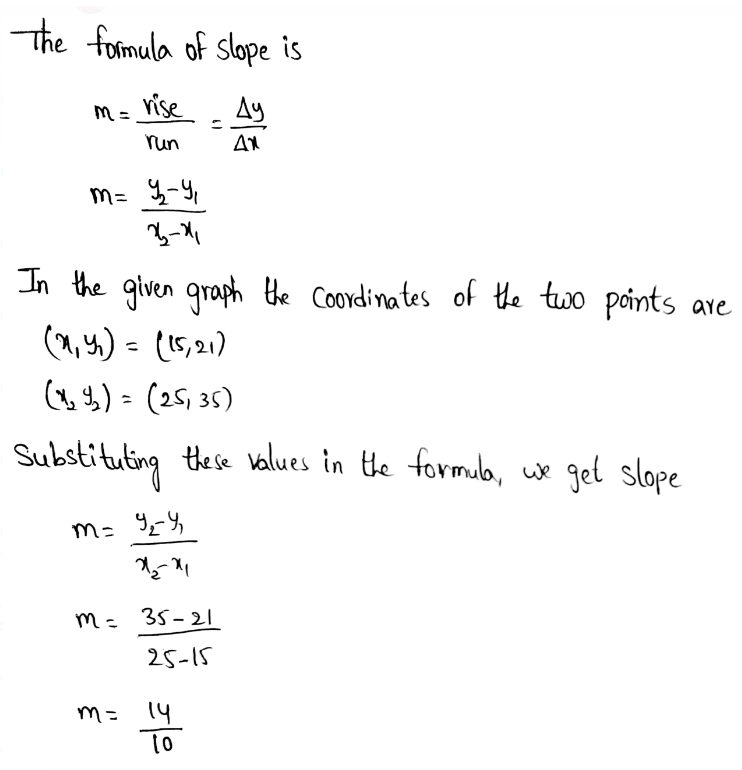
The slope of the line that passes through the points (15,21) and (25,35) is obtained as 1.4.
We have to find the slope of the line passing through the given points (15,21) and (25,35).
When there is a relationship between two variables, and the ratio of the two variables are equivalent, then it is known as proportional relationship.
We know that the line would definitely pass through the origin.
As the line in graph A does contradicts the statement, hence it is wrong.
The points we have are (15,21) and (25,35).
From the x and y coordinates of both the points, we can observe that the y-coordinate is greater than the x-coordinate.
This is seen in the graph B and not in graph C.
Thus, graph B is correct.
The graph B represents the given relationship between the two points.