
Envision Math Grade 8 Volume 1 Student Edition Solutions Chapter 4 Investigate Bivariate Data Topic 4
Page 206 Question 1 Answer
We have to tell the method to represent the relationship between paired data.
Using the same representation, predictions are to be made.
Two sets of data are said to be paired if there exists a one-to-one relationship among them.
The relationship among the paired data is represented by a method of drawing scatter plot.
Scatter plot is a mathematical diagram on which points or coordinated of the data are plotted.
The scatter plot has various uses, one of which is to make predictions regarding the data.
For which a best fit line is drawn and based on the location of points around the best fit, predictions are drawn whether the data is strong or not.
Scatter plot is used to represent the relationship between paired data and best fit line helps to make predictions in this method.
Envision Math Grade 8 Volume 1 Chapter 4 Topic 4 Bivariate Data Solutions
Page 209 Exercise 1 Answer
We are required to complete the given definition with appropriate word.
Slope is defined as the ratio of the change in the y-coordinate to the change in x-coordinate.
It is represented by the letter m.
The formula of slope is
m = \(\frac{\Delta y}{\Delta x}\)
m = \(\frac{y_2-y_1}{x_2-x_1}\)
Therefore,
Slope is the change in y divided by the change in x.
Slope is the change in y divided by the change in x.
Envision Math Grade 8 Topic 4 Investigate Bivariate Data
Page 209 Exercise 2 Answer
We are required to complete the given definition with appropriate word.
In simple words, ratio is defined as the comparison of two quantities by dividing them.
A ratio of two quantities suppose p and q is represented p:q
Ratio is equivalent to fractions.
Therefore,
A relationship where for every x unit of one quantity there are y units of another quantity is a ratio.
A relationship where for every x unit of one quantity there are y units of another quantity is a ratio.
Envision Math Grade 8 Volume 1 Student Edition Solutions Chapter 4 Investigate Bivariate Data Topic 4 Page 209 Exercise 3 Answer
We are required to complete the given definition with appropriate word.
A two-dimensional plane which consists of two axis, one horizontal and the other vertical intersecting each other is known as a coordinate plane.
The horizontal axis is called as the x-axis, while the vertical axis is termed as the y-axis.
The intersecting point of both the axis is origin.
Therefore,
The x-axis is the horizontal line in a coordinate plane.
The x-axis is the horizontal line in a coordinate plane.
Page 209 Exercise 4 Answer
We are required to complete the given definition with appropriate word.
A two-dimensional plane which consists of two axis, one horizontal and the other vertical intersecting each other is known as a coordinate plane.
The horizontal axis is called as the x-axis, while the vertical axis is termed as the y-axis.
The intersecting point of both the axis is origin.
Therefore,
The y-axis is the vertical line in a coordinate plane.
The y-axis is the vertical line in a coordinate plane.
Page 209 Exercise 5 Answer
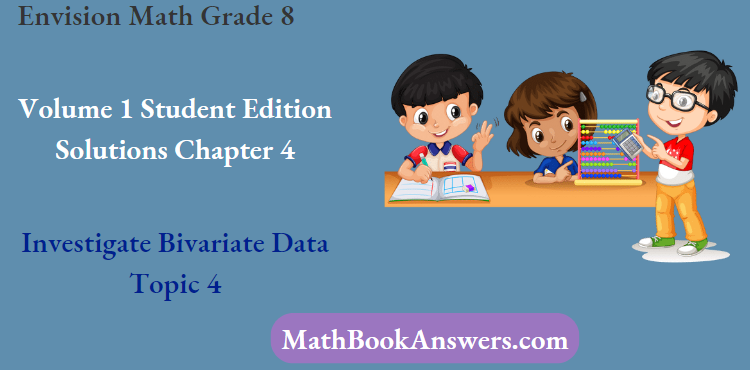
We have to mark the given point (-2,4) on coordinate plane.
A two-dimensional plane which consists of two axis, one horizontal and the other vertical intersecting each other is known as a coordinate plane.
Any point on the coordinate plane has two coordinates, one is the x-coordinate and the other is y-coordinate.
If a point is expressed as an ordered pair, then the first digit will be the x-coordinate and the second is y-coordinate.
In the given point (-2,4) the x-coordinate is -2 and the y-coordinate is 4.
We mark the point as below:
The point (-2,4) is labelled on coordinate plane as below:
Investigating Bivariate Data Grade 8 Topic 4 Envision Math
Envision Math Grade 8 Volume 1 Student Edition Solutions Chapter 4 Investigate Bivariate Data Topic 4 Page 209 Exercise 6 Answer
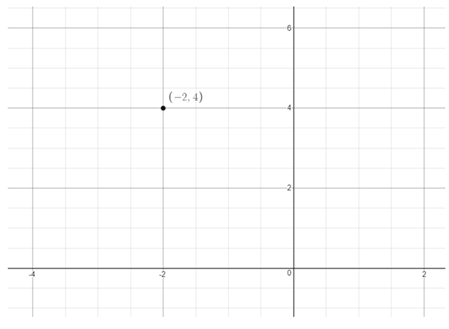
We have to mark the given point (0,3) on coordinate plane.
A two-dimensional plane which consists of two axis, one horizontal and the other vertical intersecting each other is known as a coordinate plane.
Any point on the coordinate plane has two coordinates, one is the x-coordinate and the other is y-coordinate.
If a point is expressed as an ordered pair, then the first digit will be the x-coordinate and the second is y-coordinate.
In the given point (0,3) the x-coordinate is 0 and the y-coordinate is 3.
We mark the point as below:
The point (0,3) is labelled on coordinate plane as below:
Envision Math Grade 8 Chapter 4 Topic 4 Solutions
Page 209 Exercise 7 Answer
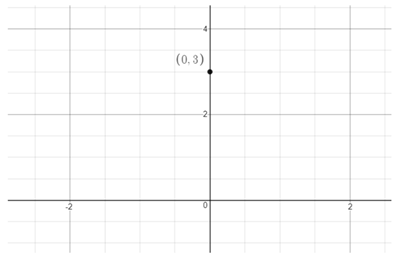
We have to mark the given point (3,-1) on coordinate plane.
A two-dimensional plane which consists of two axis, one horizontal and the other vertical intersecting each other is known as a coordinate plane.
Any point on the coordinate plane has two coordinates, one is the x-coordinate and the other is y-coordinate.
If a point is expressed as an ordered pair, then the first digit will be the x-coordinate and the second is y-coordinate.
In the given point (3,-1) the x-coordinate is 3 and the y-coordinate is -1.
We mark the point as below:
The point (3,-1) is labelled on coordinate plane as below:
Envision Math Grade 8 Volume 1 Student Edition Solutions Chapter 4 Investigate Bivariate Data Topic 4 Page 209 Exercise 8 Answer
We have to mark the given point (−4,−3) on the coordinate plane.
A two-dimensional plane that consists of two axes, one horizontal and the other vertical intersecting each other is known as a coordinate plane.
Any point on the coordinate plane has two coordinates, one is the x-coordinate and the other is the y-coordinate.
If a point is expressed as an ordered pair, then the first digit will be the x-coordinate and the second is the y-coordinate.
In the given point (−4,−3) the x-coordinate is −4 and the y-coordinate is −3.
We mark the point as below:
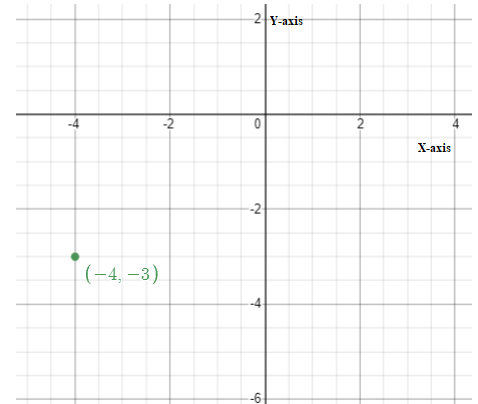
The point −4,−3 is labeled on the coordinate plane as below:
Page 209 Exercise 9 Answer
We have to find slope among the given points (4,6) and (-2,8).
Slope is defined as the ratio of the change in the y-coordinate to the change in x-coordinate.
It is represented by the letter m.
The formula of slope is
m = \(\frac{\Delta y}{\Delta x}\)
m = \(\frac{y_2-y_1}{x_2-x_1}\)
Slope is the change in y divided by the change in x.
Here we have the two points as (4,6) and (-2,8).
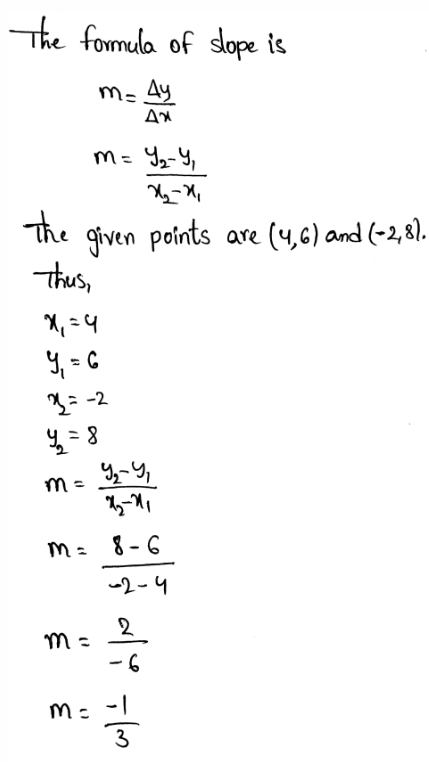
Slope between the pair of points (4,6) and (-2,8) is obtained as m = \(-\frac{1}{3}\)
Envision Math 8th Grade Topic 4 Step-By-Step Bivariate Data Solutions
Envision Math Grade 8 Volume 1 Student Edition Solutions Chapter 4 Investigate Bivariate Data Topic 4 Page 209 Exercise 11 Answer
We have to find slope among the given points (5,-1) and (-3,-7).
Slope is defined as the ratio of the change in the y-coordinate to the change in x-coordinate.
It is represented by the letter m.
The formula of slope is
m = \(\frac{\Delta y}{\Delta x}\)
m = \(\frac{y_2-y_1}{x_2-x_1}\)
Slope is the change in y divided by the change in x.
Here we have the two points as (5,-1) and (-3,-7).
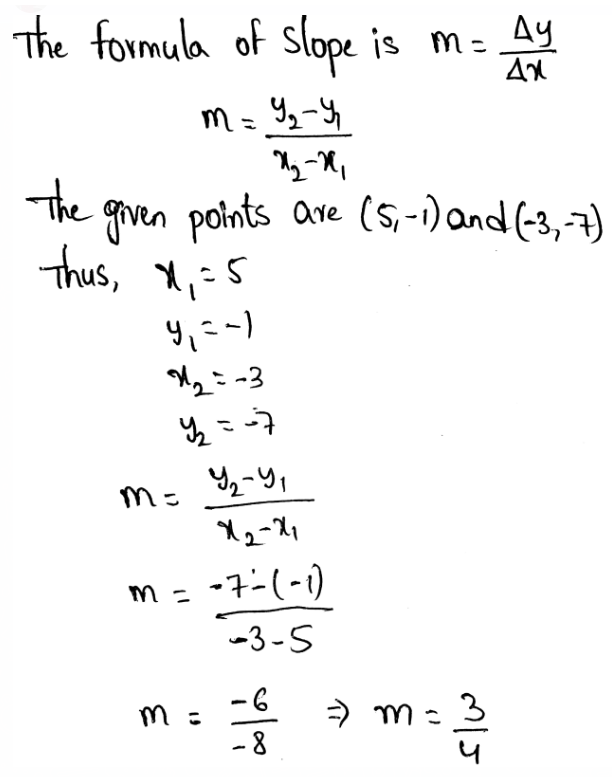
Slope between the pair of points (5,-1) and (-3,-7) is obtained as m = 3/4.
Page 209 Exercise 12 Answer
We have to express the fraction \(\frac{36}{60}\) as percent.
A per cent is a one part among 100 quantities.
In order to express the fraction as percent, first we divide and get the fraction as decimal.
\(\frac{36}{60}=0.6\)Now, the percent is obtained by multiplying the decimal obtained with 100.
0.6 × 100 = 60
Thus, the fraction is expressed as 60%.
The fraction \(\frac{36}{60}\) is obtained as 60%.
How To Solve Bivariate Data In Topic 4 Envision Math Grade 8
Page 210 Exercise 1 Answer
The given vocabulary terms are,
Measurement data
Scatter plot
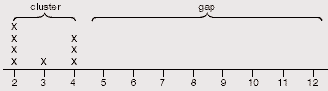
Cluster
Gap
Outlier
Trend line
Categorical data
Relative frequency table
We need to state their definitions and examples.
Measurement data
Definition – the type of data provided by figures
Examples – Length, Speed, height, distance.
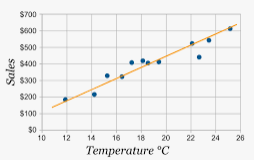
Scatter plot
Definition – A mathematical diagram that displays values for correlated variables into a set of information using Cartesian coordinates.
Examples –

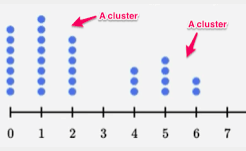
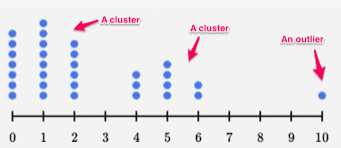
Cluster
Definition – A group of data that are very close to each other.
Examples –
Gap
Definition – The missed out points or information in a datasheet.
Examples –
Outlier
Definition -A value that seems to be separate or lies outside the given range.
Examples –
Trend line
Definition – A line drawn to show the direction in which the data prevails.
Example
Categorical data
Definition – A data that can be split down into groups.
Examples – Age, sex, etc.
Relative frequency table
Definition – The popularity or mode of data based on the samples obtained.
Examples – I ate 10 donuts out of 15: the frequency of eating is 10. the relative frequency of winning is \(\frac{10}{15}=\frac{2}{3} \times 100=66.6^{\%}\).
Measurement data – the type of data provided by figures.
Scatter plot – A mathematical diagram that displays values for correlated variables into a set of information using Cartesian coordinates.
Cluster – A group of data that are very close to each other.
Gap – The missed out points or information in a datasheet.
Outlier -A value that seems to be separate or lies outside the given range.
Trend line – A line drawn to show the direction in which the data prevails.
Categorical data – Data that can be split down into groups.
Relative frequency table – The popularity or mode of data based on the samples obtained.