
Envision Math Grade 8 Volume 1 Student Edition Solutions Chapter 4 Investigate Bivariate Data Exercise 4.5
Page 237 Exercise 1 Answer
Given:
The total number of users using a small screen is 66.
The number of students using a small screen is 48.
The number of adults using the small screen is 18.
To find- How can you use the data to compare the percent of students who chose the small screen to the percent of adults who chose the small screen?
The data from the table can be used to analyse the usage of small screen between adults and students.
It can also help to understand the interested crowd and help in future business propositions.
Envision Math Grade 8 Volume 1 Chapter 4 Exercise 4.5 Bivariate Data Solutions
Page 237 Exercise 1 Answer
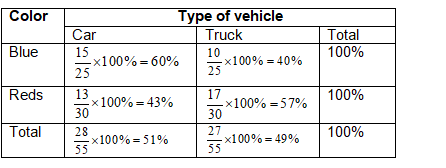
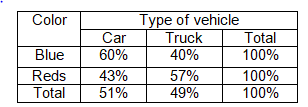
When categorized data is put into a two-way frequency tables, one category is represented by the rows and other is represented by columns.
Percentage of the given data gives a clear idea of the population surveyed.
Percentage also makes it easier to understand the given data in a two-way relative frequency table.
Percentage changes the way of interpretation of data because it makes it easier to understand the result of the surveyed population.
Envision Math Grade 8 Volume 1 Student Edition Solutions Chapter 4 Investigate Bivariate Data Exercise 4.5 Page 238 Question 1 Answer
Two-way frequency tables are used to analyse survey results.
The data in the relative frequency table is always in the form of decimals, percentage or fractions.
Two-way relative frequency tables show percentages rather than counts.
Two-way relative frequencies are good for seeing if there is an association between two variables.
Two-way relative frequency tables show percentages rather than counts. This gives a visual representation of possible relationships between two sets of categorical data. This gives a better advantage for showing relationships between sets of paired data.
Envision Math Grade 8 Volume 1 Chapter 4 Exercise 4.5 Bivariate Data Solutions
Page 238 Exercise 1 Answer
Both the frequency tables are used to represent the categorical data.
On both the tables one category is represented by rows and other category is represented by column.
Both of the two-way tables show the relationship between paired categorical data. Both of the tables help in interpretation of data in the tables to draw conclusions.
Two-way relative frequency table is similar to a two-way frequency tables as both the tables are used to represent the categorical data, they show the relationship between paired categorical data, and they both help in interpretation of data in the tables to draw conclusions.
Envision Math Grade 8 Volume 1 Student Edition Solutions Chapter 4 Investigate Bivariate Data Exercise 4.5 Page 238 Exercise 1 Answer
Given that, Asha asked 82 classmates whether they play sports on the weekend. The results are shown in the two-way frequency table below.
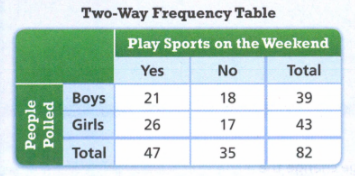
We need to use Asha’s two-way frequency table to complete the two-way relative frequency table.
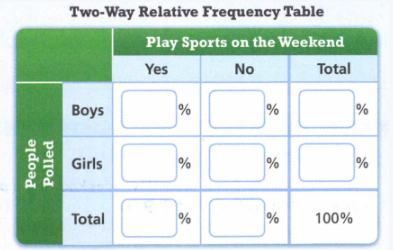
For finding the percentage to complete the two-way relative frequency table, we need to divide each value in the cell by the total number of boys and girls polled together.
Here, the total count is 82
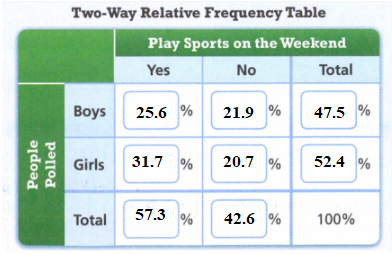
Thus, finding the percentage of each of them, we get,
\(\frac{21}{82} \times 100\) = 25.6
\(\frac{18}{82} \times 100\) = 21.9
\(\frac{39}{82} \times 100\) = 47.5
\(\frac{26}{82} \times 100\) = 31.7
\(\frac{17}{82} \times 100\) = 20.7
\(\frac{43}{82} \times 100\) = 52.4
\(\frac{47}{82} \times 100\) = 57.3
\(\frac{35}{82} \times 100\) = 42.6
Thus, completing the two-way relative frequency table, we get,
Investigating Bivariate Data Grade 8 Exercise 4.5 Envision Math
Page 239 Exercise 2 Answer
The percentage of students who choose e-books is 52%
The percentage of students who choose audiobooks is 48%
We see that the percentage of students using e-books is greater than the percentage of students using audiobooks.
This means that students prefer e-books over audiobooks.
The percentage of students using e-books is greater than the percentage using audiobook. This shows that students prefer using e-books over audiobooks.
The percentage of students in 7th grade who choose e-books is 41.1%
The percentage of students in 7th grade who choose audiobooks is 58.9%
We see that the 7th graders have greater tendency to choose audiobooks over e-books.
From the given data, we observe that the percentage of 7th graders using audiobooks is greater than the percentage of e-book users.
Envision Math Grade 8 Chapter 4 Exercise 4.5 Solutions
Envision Math Grade 8 Volume 1 Student Edition Solutions Chapter 4 Investigate Bivariate Data Exercise 4.5 Page 238 Exercise 1 Answer
A frequency table is a chart that shows the popularity or mode of a certain type of data.
A relative frequency table is a chart that shows the popularity or mode of a certain type of data based on the population sampled.
The data presented by a relative frequency table is always represented by fractions, decimals or decimals.
The data in the two-way frequency table is in counts as in whole numbers.
The difference between a two-way frequency table and a two-way relative frequency table is that the data in the table is differently represented. The data in the relative table is represented by percentage, fractions and decimals. The data in frequency table is represented by a count that is whole numbers.
Page 240 Exercise 1 Answer
Two-way frequency tables are used to analyse survey results.
The data in the relative frequency table is always in the form of decimals, percentage or fractions.
Two-way relative frequency tables show percentages rather than counts.
Two-way relative frequencies are good for seeing if there is an association between two variables.
Two-way relative frequency tables show percentages rather than counts. This gives a visual representation of possible relationships between two sets of categorical data. This gives a better advantage for showing relationships between sets of paired data.
Page 240 Exercise 2 Answer
Two-way relative frequency table contains the data that is computed into percentage.
Also, this data is a relative data that is this data is not completely accurate.
Relative data doesn’t always add to 100%, proving that accuracy of the relative frequency table being almost correct.
Since the data in the two-way relative frequency table is not completely accurate, the percentage of the rows or columns percentages not total 100%.
Envision Math 8th Grade Exercise 4.5 Step-By-Step Bivariate Data Solutions
Envision Math Grade 8 Volume 1 Student Edition Solutions Chapter 4 Investigate Bivariate Data Exercise 4.5 Page 240 Exercise 5 Answer
Given:
The total number of left-handed people that have an artistic ability is 86.
The total numbers of people that have the artistic ability are 101.
We convert the counts into percentage to get the answer.
We consider:
The percentage of left-handed people with artistic ability =
\(\frac{86}{101} \times 100\) = 0.8514 x 100 = 85.14
There are 85.14% of left-handed people surveyed with artistic ability.
Page 241 Exercise 7 Answer
Given
We consider:
This is the required two-way frequency table.
How To Solve Exercise 4.5 Bivariate Data In Envision Math Grade 8
Envision Math Grade 8 Volume 1 Student Edition Solutions Chapter 4 Investigate Bivariate Data Exercise 4.5 Page 241 Exercise 8 Answer
Given:
We consider:
This is the required two-way frequency table.
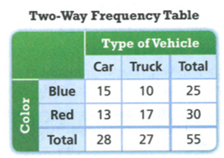
Page 241 Exercise 9 Answer
Given:
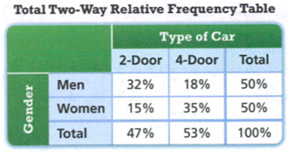
We observe that the percentage of the 4-door car is 53% that is greater than the percentage of 2-door cars.
Therefore, the 4-door car is more popular.
To Find: Which type of car is more popular
After observing the given data, we conclude that 4-door cars are more popular.
Envision Math Grade 8 Exercise 4.5 Practice Problems
Envision Math Grade 8 Volume 1 Student Edition Solutions Chapter 4 Investigate Bivariate Data Exercise 4.5 Page 242 Exercise 10 Answer
Given:
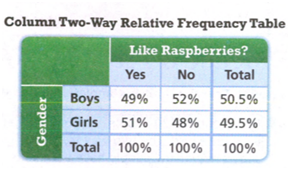
We observe that the percentage of girls who do not like raspberries is 48%.
Therefore, 48% percent of girls do not like raspberries.
After observing the given data, we conclude that 48% of girls do not like raspberries.
Given:
We observe that the gender and the responses are correlated.
The question is asked to both boys and girls.
Therefore, the data in the above table is evidence that gender and the responses are associated.
As the question is asked to both Girls and Boys, the data in the given table explains the association between the gender and the responses. Furthermore, these responses help in bifurcation of the data gender-wise.
Envision Math Exercise 4.5 Bivariate Data Detailed Answers
Page 242 Exercise 11 Answer
Given:
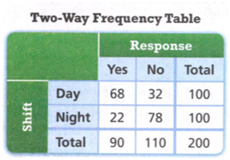
We consider:
This is the required two-way frequency table.
This is the required table.
Given:

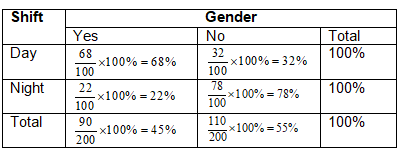
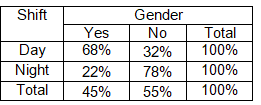
We understand that the responses help to categorize the employees into day or night shifts. The given table is evidence to the association of Shifts and the responses.
After observing the table, we realize that this table helps in categorization of employees in Day or night Shifts. Hence, the shifts and the responses are associated.
Envision Math Grade 8 Exercise 4.5 Solution Guide
Envision Math Grade 8 Volume 1 Student Edition Solutions Chapter 4 Investigate Bivariate Data Exercise 4.5 Page 242 Exercise 12 Answer
We simply have to look in the table and compare the percentage for positive improvements from each medicine.
AS we can see the medicine B has 74 of people had the improvement while only 26 of the people that were given medicine 26 showed some improvement.
A greater percent of people given Medicine B saw an improvement.
Yes, we can see in the given table, the percent of the people that took either medicine A or Bare shown in the table which is the evidence that the improvement was related to the type of medicine.
Yes there is evidence that the improvements are related to the type of the medicine.