
Envision Math Grade 8 Volume 1 Student Edition Solutions Chapter 4 Investigate Bivariate Data Exercise 4.3
Page 223 Exercise 1 Answer
Given
Trend line passing through (25,100) and (80, 550).
To find/solve
Would this indicate that more or fewer calories were burned per minute? Explain.
The Correlation coefficient is a statistical calculation that is used to examine the relationship between two sets of data.
First we have to plot the second trend line. After we have plotted the new trend line, we can see that new trend line is below the current trend line which means that fewer calories were burned per minute. Also the new trend line is ascending slower.
This would indicate that fewer calories were burned per minute.
This would indicate that fewer calories were burned per minute.
Envision Math Grade 8 Volume 1 Chapter 4 Exercise 4.3 Bivariate Data Solutions
Page 224 Question 1 Answer
Given
Statement
To find/solve
Linear models help you to make a prediction.
The Correlation coefficient is a statistical calculation that is used to examine the relationship between two sets of data.
On linear model we can draw a trend line, which will show us how the results will change in the future. We can read from the graph approximately the correct result.
Linear models can help us approximately find the value that we need with a trend line.
On linear model we can draw a trend line, which will show us how the results will change in the future. We can read from the graph approximately the correct result.
Linear models can help us approximately find the value that we need with a trend line.
Envision Math Grade 8 Volume 1 Student Edition Solutions Chapter 4 Investigate Bivariate Data Exercise 4.3 Page 224 Exercise 1 Answer
Given
To find/solve
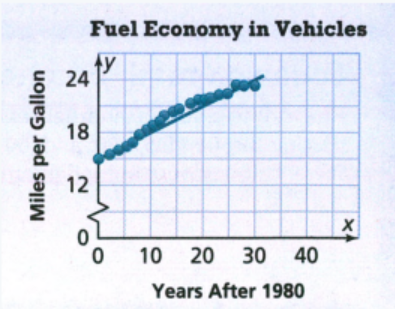
In 2025, the average fuel consumption is predicted to be about
First we are going to find the y-intercept. On the given graph the y-intercept is 15
Now we have to find the slope.
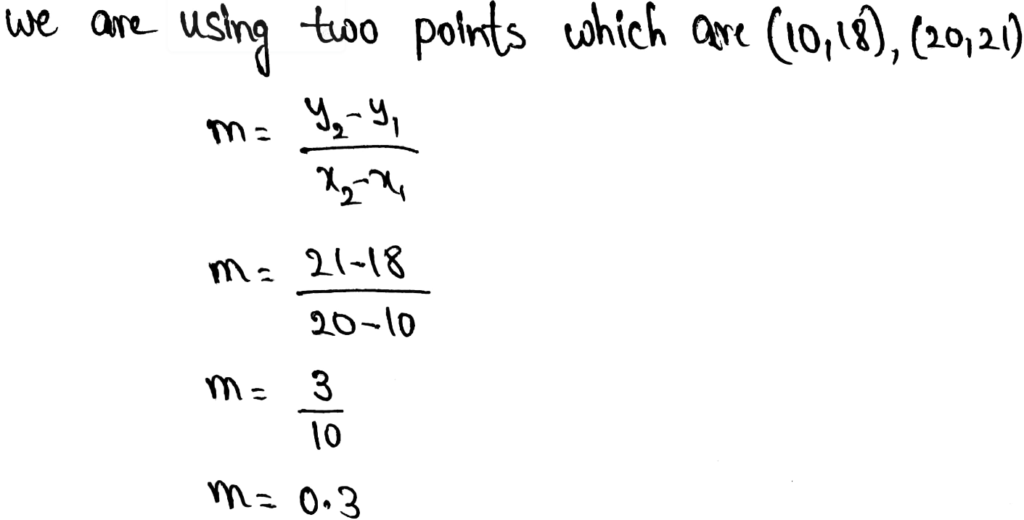
To find the slope we are going to use two points which are (10,18),(20,21)
Now that we know the equation of the trend line which is y = 0.3x − 15, we can simply find out the average fuel consumption in 2025.
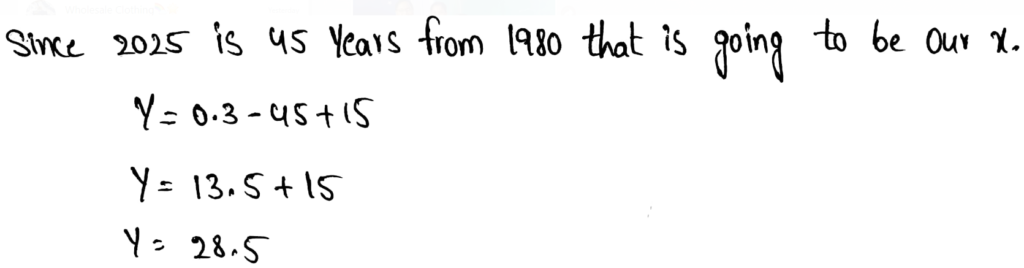
The average fuel consumption in 2025 is predicted to be about 28.5 mpg.
The average fuel consumption in 2025 is predicted to be about 28.5 mpg.
Envision Math Grade 8 Exercise 4.3 Investigate Bivariate Data
Envision Math Grade 8 Volume 1 Student Edition Solutions Chapter 4 Investigate Bivariate Data Exercise 4.3 Page 225 Exercise 2 Answer
Given
ingredients needed to make 50,000 smoothies on a day when the high temperature is expected to reach 90∘F
To find/solve
Employees expect to have enough ingredients for the day’s smoothie sales.
To find out whether the Smoothie cafe is going to have enough ingredients we are simply going to use the equation from the last task.
The x that we are going to use is 90 because that is the temperature.
y = \(\frac{3}{5} .90+8\)
y = 54 + 8
y = 62
The expected number of smoothies to be sold on that day is about 62 thousands which mean that the cafe is not going to have enough ingredients.
The cafe is not going to have enough ingredients.
The cafe is not going to have enough ingredients.
Page 224 Exercise 1 Answer
Given- linear model
To find- Why can you use a linear model to predict the y value for a given x value.
The Correlation coefficient is a statistical calculation that is used to examine the relationship between two sets of data.
On linear model we can draw a trend line, which will show us how the result will change in the future. We can read from the graph approximately the correct result.
Linear models can help us approximately find the value that we need with a trend line.
On linear model we can draw a trend line, which will show us how the result will change in the future. We can read from the graph approximately the correct result.
Linear models can help us approximately find the value that we need with a trend line.
Investigating Bivariate Data Grade 8 Exercise 4.3 Envision Math
Envision Math Grade 8 Volume 1 Student Edition Solutions Chapter 4 Investigate Bivariate Data Exercise 4.3 Page 226 Exercise 1 Answer
Given- linear model
To find/solve- Linear models help you to make a prediction.
The Correlation coefficient is a statistical calculation that is used to examine the relationship between two sets of data.
On linear model we can draw a trend line, which will show us how the results will change in the future. We can read from the graph approximately the correct result.
Linear models can help us approximately find the value that we need with a trend line.
On linear model we can draw a trend line, which will show us how the results will change in the future. We can read from the graph approximately the correct result.
Linear models can help us approximately find the value that we need with a trend line.
Page 226 Exercise 3 Answer
Given- linear model
To find- Prediction about any x-value.
The Correlation coefficient is a statistical calculation that is used to examine the relationship between two sets of data.
If we know the equation then we can find the prediction about any x-value.
If we do not know the equation for the given linear model that we simply first have to find that.
Yes, we can find the prediction about any x- value.
If we know the equation then we can find the prediction about any x-value.
If we do not know the equation for the given linear model that we simply first have to find that.
Yes, we can find the prediction about any x value.
Envision Math Grade 8 Chapter 4 Exercise 4.3 Solutions
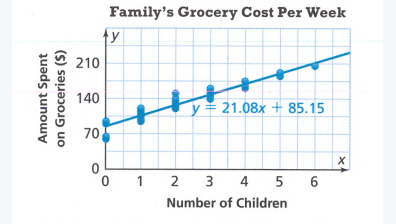
Page 226 Exercise 4 Answer
Given
To find/solve
a. Using the slope, predict the difference in the amount spent on groceries between a family with five children and a family with two children.
We simply have to use two different x values which are 2 and 5. After that we simply have to subtract the value so we know the difference.
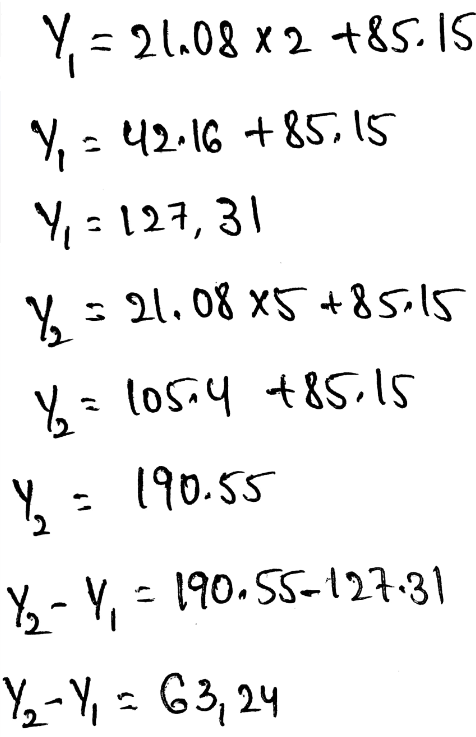
The difference is about $63,24.
The difference in amount spent on groceries between a family with five children and a family with two children is $63,24.
The difference is about $63,24.
The difference in amount spent on groceries between a family with five children and a family with two children is $63,24.
Given
To find/solve
b. How many children can you predict a family has if the amount spent on groceries per week in $169.47?
We are simply going to substitute the y, with 169.46 and calculate for x after that.
First we have to subtract 85.15 from both sides of the equation.
169.47 − 85.15 = 21.08x
84.32 = 21.08x
No we can simply divide both sides of the equation with 21.08
X = 4.
The family has 4 children.
The family has 4 children.
Envision Math 8th Grade Exercise 4.3 Step-By-Step Bivariate Data Solutions
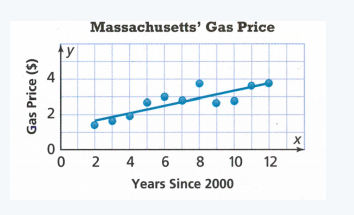
Envision Math Grade 8 Volume 1 Student Edition Solutions Chapter 4 Investigate Bivariate Data Exercise 4.3 Page 227 Exercise 6 Answer
Given
To find/solve
what the difference between the gas prices in 2013 and 2001 is
To find out what is the difference we simply have to find the equation for given graph.
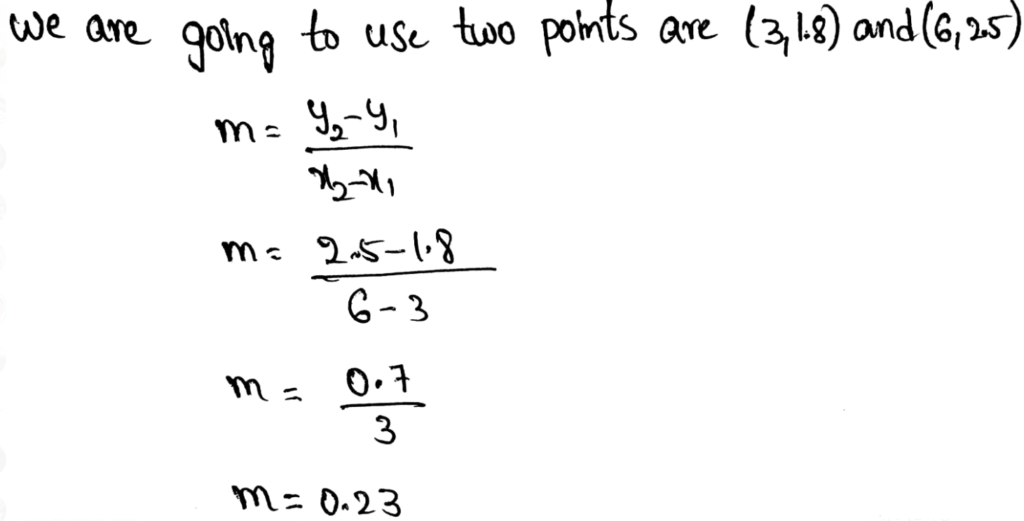
First, we are going to find the slope.
To do so we are going to use two points from the trend line (3,18) and (6,25)
Secondly, we have to draw the line to the y-axis so we can find the y-intercept.
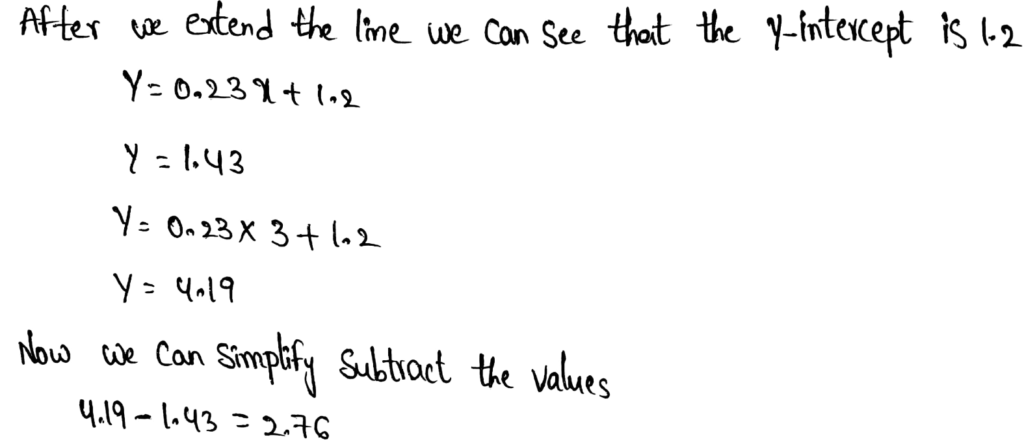
Now we can simply subtract the values
4.19 – 1.43 = 2.76
The difference between the gas prices in 2013 and 2001 is 2.76
The difference between the gas prices in 2013 and 2001 is 2.76.
How To Solve Exercise 4.3 Bivariate Data In Envision Math Grade 8
Page 228 Exercise 8 Answer
Given
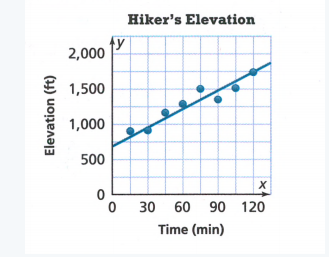
To find/solve
what the hiker’s elevation will be after 145 minutes.
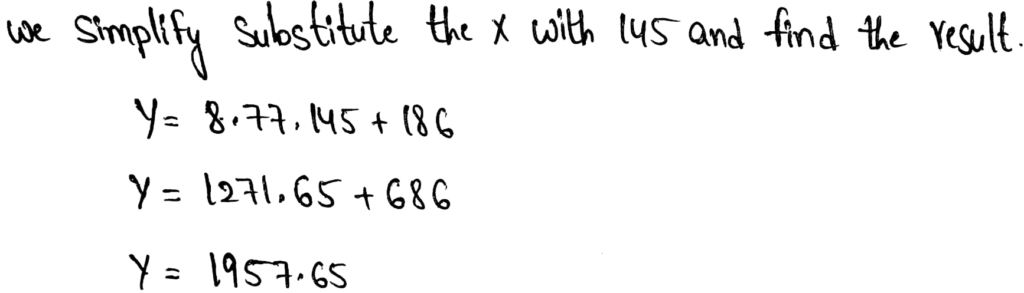
Finally we only have to round up the result to the nearest whole number.
y ≈ 1958
The biker’s elevation will be 1958ft after 145 minutes.
The biker’s elevation will be 1958ft after 145 minutes.
Page 228 Exercise 9 Answer
Given
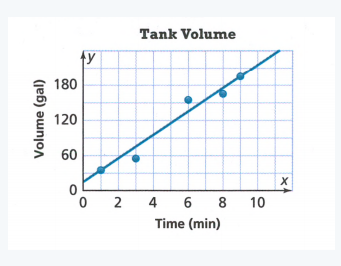
To find/solve
How long it will take to fill the tank with 375 gallons of water.
If we look closely at the graph we can see that one point is (9,190) which the about the half way to the point at which we have 375 gallons.
Since we have a straight line, we can simply multiply give x-coordinate with 2 to get the time needed to fill the tank with 375 gallons of water.
9.2 = 18
18 hours is going to be needed for 375 gallons to be in the tank.
18 hours is going to be needed for 375 gallons to be in the tank.
Envision Math Grade 8 Exercise 4.3 Practice Problems
Envision Math Grade 8 Volume 1 Student Edition Solutions Chapter 4 Investigate Bivariate Data Exercise 4.3 Page 228 Exercise 11 Answer
Given: two points (0,453) and (10,359)
First, we will find the slope from the given points and find out the y-intercept.
Points from which trend line passes: (0,453) and (10,359)
From (0,453)it is clear that y-intercept is +453
Therefore, c = +453
Now, slope = \(\frac{y_2-y_1}{x_2-x_1}=\frac{359-453}{10-0}=-9.4\)
Therefore, m = -9.4
Now, substituting values of m and c in y = mx + c
We get, y = −9.4x + 453
Therefore, the trend line equation is y = −9.4x + 453
Option (D) is correct option.
The trend line equation is y = −9.4x + 453
Option (D) is correct option.
Envision Math Exercise 4.3 Bivariate Data Detailed Answers
Page 228 Exercise 12 Answer
Given: altitude = 415.4 feet
We will substitute the value y = 415.4 in y = -9.4x + 453 and solve it.
Given: altitude (y) = 415.4
Substituting value of y = 415.4 in y = −9.4x + 453
We get,
415.4 = −9.4x + 453
x = \(\frac{-37.6}{-9.4}=4\)
It will take 4 minutes to be at an altitude of 415.4 feet.
It will take 4 minutes.