
Envision Math Grade 8 Volume 1 Student Edition Solutions Chapter 4 Investigate Bivariate Data Exercise 4.2
Page 217 Exercise 1 Answer
It is given that Angus has a big test coming up.
We have to make a general statement about which option leads to a better result.
The data regarding Angus is given, where it is given that in different test at what time he sleeps and when he gets up.
On observing the given data, we can observe that in the test 6, Angus goes to bed at 9pm which is early and, in that test, he scores the highest marks and the best result.
Therefore, the better option which will lead to a better result is that he should go to bed early for the best results in the test.
The better option which will lead to a better result is that he should go to bed early for the best results in the test.
Envision Math Grade 8 Volume 1 Chapter 4 Exercise 4.2 Bivariate Data Solutions
Page 217 Exercise 1 Answer
We need to find the other factors should Angus take into consideration to make a decision.
The Correlation coefficient is a statistical calculation that is used to examine the relationship between two sets of data.
If we look closely at the test and their result, we can see that when he goes to bed early then Angus has the best results. The results differ by only a little but still the results are better when he goes to bed early.
The results are better when he goes to bed early.
The results are better when he goes to bed early.
Page 218 Question 1 Answer
We need to explain how we can describe the association of two data sets.
The Correlation coefficient is a statistical calculation that is used to examine the relationship between two sets of data.
We describe the relationship between the two sets of data with associations.
We can use the scatter plot for given relationship to determine whether there is strong, weak or no association.
We describe it with association.
We describe the relationship between the two sets of data with associations.
We can use the scatter plot for given relationship to determine whether there is strong, weak or no association.
Envision Math Grade 8 Volume 1 Student Edition Solutions Chapter 4 Investigate Bivariate Data Exercise 4.2 Page 218 Exercise 1 Answer
To find – The relationship might there be between the two measurements
Correlation coefficient values can range between +1.00 to -1.00.
The Correlation coefficient is a statistical calculation that is used to examine the relationship between two sets of data.
The value of the correlation coefficient tells us about the strength and the nature of the relationship.
Correlation coefficient values can range between +1.00 to -1.00.
Statistical measures which show a relationship between two or more variable or two or more sets of data. For example, generally there is a high relationship or correlation between parent’s education and academic achievement.
Statistical measures which show a relationship between two or more variable or two or more sets of data. For example, generally there is a high relationship or correlation between parent’s education and academic achievement.
Envision Math Grade 8 Exercise 4.2 Investigate Bivariate Data
Page 218 Exercise 1 Answer
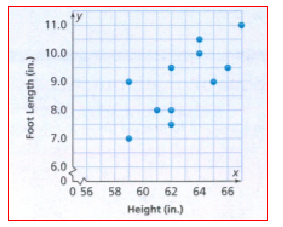
Given that, Georgia and her classmates also measure their foot length. Use a pencil to find the trend line. We need to sketch the trend line for the scatter plot.
The Correlation coefficient is a statistical calculation that is used to examine the relationship between two sets of data.
Simply place the pencil on the scatter plot so it goes right through the middle of all point and then sketch line.
Place the pencil on the scatter plot so it goes right through the middle of all points and then sketch that line.
Place the pencil on the scatter plot so it goes right through the middle of all points and then sketch that line.
Page 219 Exercise 2 Answer
To find the association between the data.
The Correlation coefficient is a statistical calculation that is used to examine the relationship between two sets of data.
Place the pencil on the scatter plot so it goes right through the middle of all points.
If the points are all close to the pencil, than the association is strong.
If the points are all scattered around and not close to the pencil, that the association is weak.
If the points are not close to the pencil, and do not have any pattern, than there is no association.
Given graph has strong association.
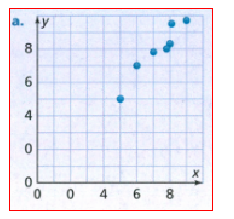
To find the association between the data.
The Correlation coefficient is a statistical calculation that is used to examine the relationship between two sets of data.
Place the pencil on the scatter plot so it goes right through the middle of all points.
If the points are all close to the pencil, than the association is strong.
If the points are all scattered around and not close to the pencil, that the association is weak.
If the points are not close to the pencil, and do not have any pattern, than there is no association.
Given graph has weak association.
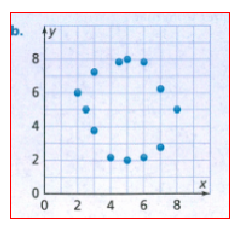
To find the association between the data.
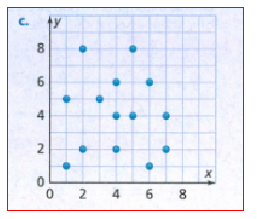
The Correlation coefficient is a statistical calculation that is used to examine the relationship between two sets of data.
Place the pencil on the scatter plot so it goes right through the middle of all points.
If the points are all close to the pencil, than the association is strong.
If the points are all scattered around and not close to the pencil, that the association is weak.
If the points are not close to the pencil, and do not have any pattern, than there is no association.
Given graph has no association.
Investigating Bivariate Data Grade 8 Exercise 4.2 Envision Math
Envision Math Grade 8 Volume 1 Student Edition Solutions Chapter 4 Investigate Bivariate Data Exercise 4.2 Page 220 Exercise 1 Answer
We need to explain how we can describe the relationship between the two sets of data.
The Correlation coefficient is a statistical calculation that is used to examine the relationship between two sets of data.
The value of the correlation coefficient tells us about the strength and the nature of the relationship.
Correlation coefficient values can range between +1.00 to -1.00.
The relationship between the two sets of data is described using associations.
We can determine whether the two sets of data are having strong, weak, or have no associations between them.
Associations describe the relationship between the two sets of data.
Using a scatter plot, we can determine whether the given two sets of data is having strong, weak, or no association.
Page 220 Exercise 2 Answer
Given- a trend line
To find- How does a trend line describe the strength of the association?
If the points are close to the trend line then the association is strong
The Correlation coefficient is a statistical calculation that is used to examine the relationship between two sets of data.
Place the pencil on the scatter plot so it goes right through the middle of all points.
If the points are all close to the pencil, than the association is strong.
If the points are all scattered around and not close to the pencil, that the association is weak.
If the points are not close to the pencil, and do not have any pattern, than there is no association
We use the pencil to find the trend line. If the points are close to the trend line then the association is strong, if they are scattered around but not so close to the pencil, then the association is weak and if the points are scattered all around the graph, then there is no association.
We use the pencil to find the trend line. If the points are close to the trend line then the association is strong, if they are scattered around but not so close to the pencil, then the association is weak and if the points are scattered all around the graph, then there is no association.
Envision Math Grade 8 Chapter 4 Exercise 4.2 Solutions
Envision Math Grade 8 Volume 1 Student Edition Solutions Chapter 4 Investigate Bivariate Data Exercise 4.2 Page 220 Exercise 5 Answer
To find- The association between the data.
The value of the correlation coefficient tells us about the strength and the nature of the relationship.
The Correlation coefficient is a statistical calculation that is used to examine the relationship between two sets of data.
Place the pencil on the scatter plot so it goes right through the middle of all points.
If the points are all close to the pencil then the association is strong.
If the points are all scattered around and not close to the pencil, that the association is weak.
If the points are not close to the pencil and do not have any pattern then there is no association.
Given graph has no association.
Page 221 Exercise 6 Answer
Given
To find/solve
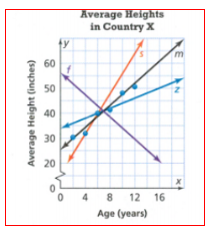
Best model of the data
The Correlation coefficient is a statistical calculation that is used to examine the relationship between two sets of data.
If we look closely at the lines on the graph, then we can see that the line that we need is m.
All of the points are more close to line m than any other line.
Hence the best model is the line m.
All of the points are more close to line m than any other line.
Hence the best model is the line m.
Page 221 Exercise 8 Answer
To find- Positive or negative linear association.
A positive correlation is a relationship between two variables that move in tandem—that is, in the same direction.
The Correlation coefficient is a statistical calculation that is used to examine the relationship between two sets of data.
Since we have the time working and the amount of money earned, then we know that the graph is going to be positive meaning that the more time working we have, the more money we are going to earn.
This is going to be a positive association.
This is going to be a positive association.
Envision Math 8th Grade Exercise 4.2 Step-By-Step Bivariate Data Solutions
Envision Math Grade 8 Volume 1 Student Edition Solutions Chapter 4 Investigate Bivariate Data Exercise 4.2Page 221 Exercise 9 Answer
Given
To find/solve
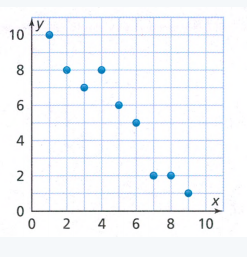
Relationship between the data .
The Correlation coefficient is a statistical calculation that is used to examine the relationship between two sets of data.
As we can see on the graph the trend line is going to be descending which means that the association is going to be negative.
If we draw the trend line with pencil, then we can see the association is strong negative.
On the given graph we can see strong negative association.
If we draw the trend line with pencil, then we can see the association is strong negative.
On the given graph we can see strong negative association.
How To Solve Exercise 4.2 Bivariate Data In Envision Math Grade 8
Page 222 Exercise 13 Answer
Given- scatter plot showing a linear relationship.
To find- if a scatter plot shows a linear relationship
The Correlation coefficient is a statistical calculation that is used to examine the relationship between two sets of data.
The y-values change with respect to the x-values at a constant rate. This means that the points are going to be forming a line.
The y-values change with respect to the x-values at a constant rate.
The y-vales change with respect to thex-values at a constant rate. This means that the points are going to be forming a line.
The y-values change with respect to the x-values at a constant rate.