
Envision Math Grade 8 Volume 1 Student Edition Solutions Chapter 3 Use Functions To Model Relationships Topic 3 Review Essential Question
Page 201 Question 1 Answer
We have to explain how we can use functions to model linear relationships.
To use functions to model linear relationships, we need to use linear functions.
The graph of those functions will be in the form of a straight line.
We can write the equation in the form of slope-intercept form such as y = mx + b
where m is the slope, b is the initial value of the dependent variable, x is the input and y is the output.
We can determine these values from the given values or from the given description of the relationship.
We need to construct a linear function to model linear relationships between any two quantities.
Envision Math Grade 8 Volume 1 Chapter 3 Topic 3 Review Essential Question
Page 201 Exercise 1 Answer
A function whose graph is not a straight line is a nonlinear function.
Nonlinear functions have a slope that varies between points.
A function whose graph is not a straight line is a nonlinear function.
Page 201 Exercise 2 Answer
m = \(\frac{y_2-y_1}{x_2-x_1}\)
Where m is the slope of the line
The slope of a line is also called a constant rate of change.
The slope of a line is also called a constant rate of change.
Envision Math Grade 8 Volume 1 Student Edition Solutions Chapter 3 Use Functions To Model Relationships Topic 3 Review Essential Question Page 201 Exercise 3 Answer
A relation in which each input has exactly one output is a function.
A relation in which each input has exactly one output is a function.
Page 201 Exercise 4 Answer
The value of the output when the input is 0, or the y-intercept of the graph line is called a initial value.
It is the y-value of the point at which the line crosses the y-axis.
The value of the output when the input is 0, or the y-intercept of the graph line is called a initial value.
Envision Math Grade 8 Topic 3 Functions Review Essential Question
Page 201 Exercise 5 Answer
A period of time between two points of time or events is called an interval.
An open interval does not include its endpoints.
Open interval indicated with parenthesis. For example (0,2)
A closed interval include its endpoints.
A period of time between two points of time or events is called an interval.
Page 201 Exercise 1 Answer
Given
(0,−2),(2,6)
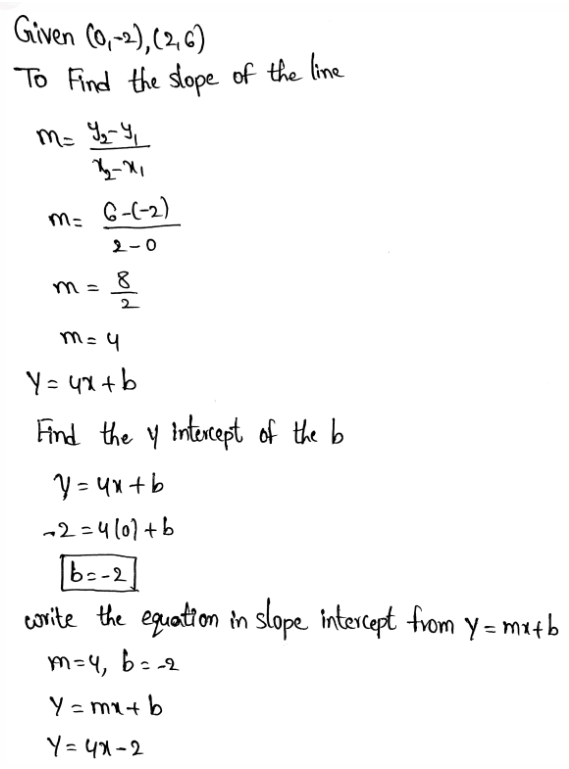
Therefore, the linear function in the slope-intercept form is y = 4x − 2
Page 202 Exercise 2 Answer
Given
{(−5,−3),(7,2),(3,8),(3,−8),(5,10)}
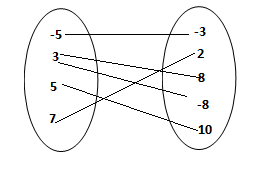
Since the input 3 corresponds to outputs of -8 and 8.
The relation is not a function. Because it has an input that corresponds to more than one output.
The relation is not a function since the input 3 corresponds to more than one output.
Envision Math Grade 8 Volume 1 Student Edition Solutions Chapter 3 Use Functions To Model Relationships Topic 3 Review Essential Question Page 202 Exercise 1 Answer
If he buys one app each week that means that he spends $4.99
every week.
This means that on the right side of the equation we are going to have 4.99x
On the left side we are simply going to have y, which is the going to be the amount left on the card
We get this by adding to the right side and we have to subtract 4.99x
y = 100 − 4.99x
Hence, the equation is y = 100 − 4.99x
Essential Question Review For Functions Modeling Grade 8 Envision Math
Page 202 Exercise 2 Answer
Given:
The function is y = 100 − 4.99x
The initial value is going to be 100. After that each week he spends 4.99$
The required graph is:
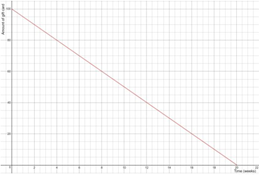
Therefore the required graph is:
Envision Math Grade 8 Chapter 3 Topic 3 Solutions And Essential Question
Page 203 Exercise 1 Answer
For the function A we can see that the initial value is going to be 2.
For function B we do not see that and we must find the Initial value.
Since, we can see that the y is increasing by 2 for each increase of 1 in x that means that we get the initial value if we simply subtract 2 from the first value of y.
−1 − 2 = −3
The initial value of the function B is -3.
This means that function A has greater initial value.
Therefore the function A has greater initial value.
Page 203 Exercise 2 Answer
Given:
We can see the function A has -3x as variable which means that the rate of change is going to be -3.
For the function B we can see that the rate of change is 2 because for every change in x the y is greater by 2.
Function B has greater rate of change.
Therefore the function B has greater rate of change.
Envision Math 8th Grade Topic 3 Functions Essential Question
Envision Math Grade 8 Volume 1 Student Edition Solutions Chapter 3 Use Functions To Model Relationships Topic 3 Review Essential Question Page 203 Exercise 1 Answer
Given:
y-intercept is -0.5.
The points given are (0.5, 4.25) and (2, 18.5)
We first find the slope:
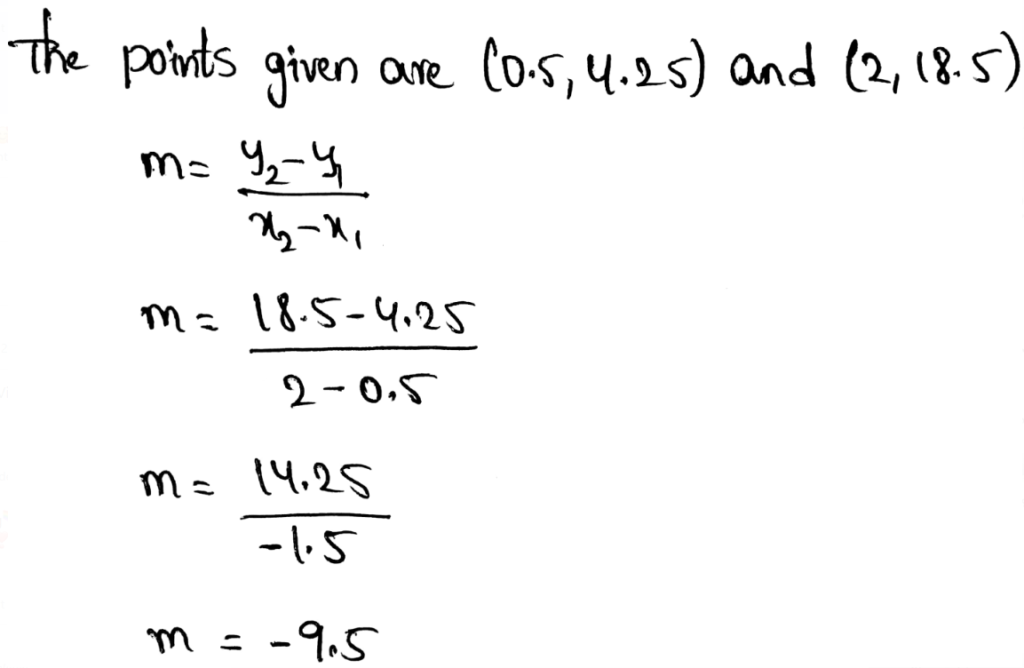
Now we write the equation of the line:
y = −9.5x − 0.5
Therefore the required equation of the line is y = −9.5x − 0.5
Page 203 Exercise 2 Answer
Given:
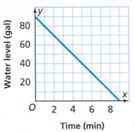
The initial value from the graph is 90.
We find the slope:
\(m=\frac{0-90}{9-0}\) \(m=\frac{-90}{9}\)m = -10
Now we write the function:
y = −10x + 90
Therefore the required function is y = 10x + 90.
Page 204 Exercise 1 Answer
The graph of the function is a constant when the y-coordinate does not change when the x-coordinate does.
This means that the graph of the function is a constant in intervals 2, 4, 6.
Therefore the given graph is constant in the intervals 2, 4, 6.
Page 204 Exercise 2 Answer
The graph of the function is decreasing when the y-coordinates are decreasing as the x-coordinates are increasing.
The graph of the given function is decreasing in intervals 5, 7.
Therefore the given graph of the function is decreasing in intervals 5, 7.
How To Answer Essential Questions In Topic 3 Envision Math Grade 8
Envision Math Grade 8 Volume 1 Student Edition Solutions Chapter 3 Use Functions To Model Relationships Topic 3 Review Essential Question Page 204 Exercise 1 Answer
As we can see the graph is going to be a constant at first when there is maximum number of carrots. Then we are going to have a decrease until half the carrots are gone. In the last part there is simply a constant because the number of carrots is going to stay the same.
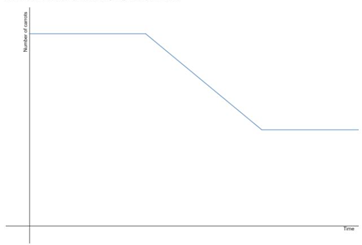
From the task we see that the graph of the function is first going to be a constant, after that it is going to decrease until half the carrots are left and in the end the graph is going to be constant.
Envision Math Grade 8 Topic 3 Review Practice Problems
Page 205 Exercise 1 Answer
We find the solution to the linear equation and then compare these solutions, choose the solution that is greater to find the letter of the row.
We consider:
3x + 8 − 8 = 12 − 8
3x = 4
x = \(\frac{4}{3}\)
5x − 4 + 4 = 5 + 4
5x = 9
x = \(\frac{9}{5}\)
As we can see \(\frac{4}{3}<\frac{9}{5}\) therefore the correct solution is N.
2n + 15 – 15 = 57 – 15
2n = 42
n = 21
3d – 7 + 7 = 53 + 7
3d = 60
d = 20
As we can see 21 > 20 therefore the correct solution is I.
We consider:
8x − 12 + 12 = 14 + 12
8x = 26
x = \(\frac{13}{4}\)
6p + 12 − 12 = 36 − 12
6p = 24
p = 4
As we can see \(\frac{13}{4}<4\) therefore the correct solution is C.
We consider:
54 − 14 = 8c + 14 − 14
8c = 40
c = 50
8m − 14 + 14 = 50 + 14
8m = 64
m = 8
As we can see 5 < 8 therefore the correct solution is E.
We consider:
12x + 16 − 16 = 100 − 16
12x = 84
x = 12
6z − 24 + 24 = 12 + 24
6z = 36
z = 6
As we can see 12 > 6 therefore the correct solution is B.
We consider:
59 + 81w − 59 = 68 − 59
81w = 9
w = \(\frac{1}{9}\)
40r + 67 − 67 = 71 − 67
40r = 4
r = \(\frac{1}{10}\)
As we can see \(\frac{1}{9}>\frac{1}{10}\) therefore the correct solution is E.
We consider:
31g − 15 + 15 = 47 + 15
31g = 62
g = 2
99 − 22 = 22 + 35y − 22
77 = 35y
y = \(\frac{77}{35}\)
As we can see \(2<\frac{77}{35}\) therefore the correct solution is L.
We consider:
14r − 7 + 7 = 14 + 7
14r = 21
r = \(\frac{3}{2}\)
13 + 8 = 12t − 8 + 8
21 = 12t
t = \(\frac{21}{12}\)
As we can see \(\frac{3}{2}<\frac{21}{12}\) therefore the correct solution is T.