
Envision Math Grade 8 Volume 1 Student Edition Solutions Chapter 3 Use Functions To Model Relationships Exercise 3.6
Page 195 Exercise 1 Answer
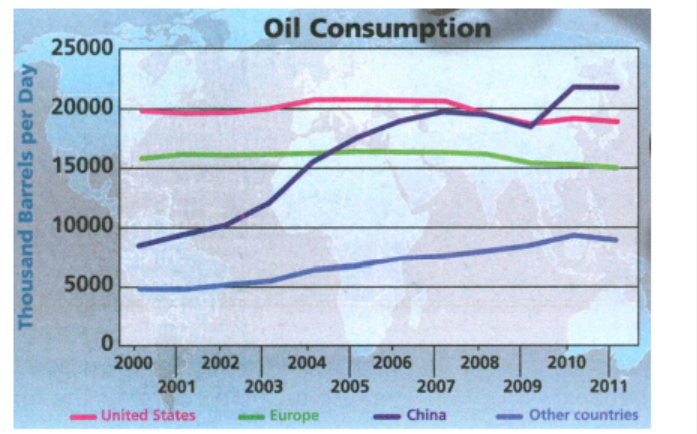
We do not agree with jack’s statement because we can see that United States has not dropped a lot. The graph that represents the United States does not have a big decrease.
We do not agree with jack.
We do agree with Ashley’s statement because this means that china’s has had a huge increase.
As we can see on the graph the line that represents china had a huge increase.
We agree with Ashley’s statement.
Envision Math Grade 8 Volume 1 Chapter 3 Exercise 3.6 Functions Solutions
Page 195 Exercise 1 Answer
For Europe and United States we can see that their line on the graph is decreasing by a little bit.
This means that they have dropped the oil consumption over the given time.
They have dropped the oil consumption over the given time.
Envision Math Grade 8 Volume 1 Student Edition Solutions Chapter 3 Use Functions To Model Relationships Exercise 3.6 Page 196 Question 1 Answer
If we sketch a graph of a function, than we can see the behavior of given function.
This way we do not have to read the data every time.
We can simply see the behavior on the sketch.
Page 196 Exercise 1 Answer
The input of given function is going to be the depth, because the water pressure is going to increase for each feet of the depth.
The output of given function is going to be the water pressure.
To sketch the given graph we can simply mark given points which are (10,19.1) and (14,20.9)
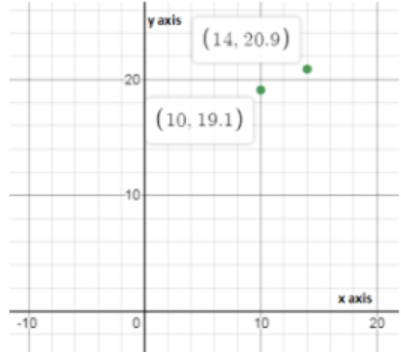
The depth is going to be the input and the water pressure is going to be the output of given function.
Page 196 Exercise 1 Answer
We need to explain how are the sketches of the two functions similar and different from each other.
The input of the given function is going to be the depth because the water pressure is going to increase for each foot of the depth.
The output of the given function is going to be the water pressure.
To sketch the given graph we can simply mark given points that are (10,19.1) and (14,20.9)

The unit rate is,
\(\frac{19.1}{10}=1.91\) \(\frac{20.9}{14}=1.5\)Therefore, the water pressure decreases with the increase in depth.
The decrease is not constant.
The sketch of the time and the oxygen level of the scuba diver is,

The decrease of the oxygen level in the tank is constant since she breathes at a constant rate.
The sketches of the two functions are similar in the way that these two functions are decreasing.
They are different because the decrease in the water pressure with respect to the depth is not constant while the decrease in the oxygen level in the tank is constant.
Envision Math Grade 8 Exercise 3.6 Use Functions To Model Relationships
Envision Math Grade 8 Volume 1 Student Edition Solutions Chapter 3 Use Functions To Model Relationships Exercise 3.6 Page 198 Exercise 1 Answer
We need to explain how does the sketch of a graph of a function help describe its behavior.
If we sketch a graph of a function, then we can see the behavior of the given function.
This way we do not have to read the data every time.
We can simply see the behavior on the sketch.
Page 198 Exercise 2 Answer
We need to describe how we know which variable goes with which axis when you graph.
When we need to determine which variable will go with which axis when we graph the output will always be the variable that will change depending on the input.
The input is always the variable that is changing independently.
Input is mostly going to be the time.
The output is the variables that change depending on the input which is mostly the time.
Envision Math Exercise 3.6 Functions Detailed Answers
Page 198 Exercise 4 Answer
Given that, a class plants a tree. We need to sketch the graph of the height of the tree over time.
Also, we need to identify the two variables.
To sketch the graph we have to identify the variables which are the height of the tree and the other variable is the time for how long was the tree planted.
The first variable is the height of the tree and second is the time.
Given that, A class plants a tree. We need to sketch the graph of the height of the tree over time.
Also, we have to describe the relationship between the two variables.
The height of the tree is going to be the output of a given function because it depends on the time which is going to be the input of the given function.
The height is the output and the time is the input.
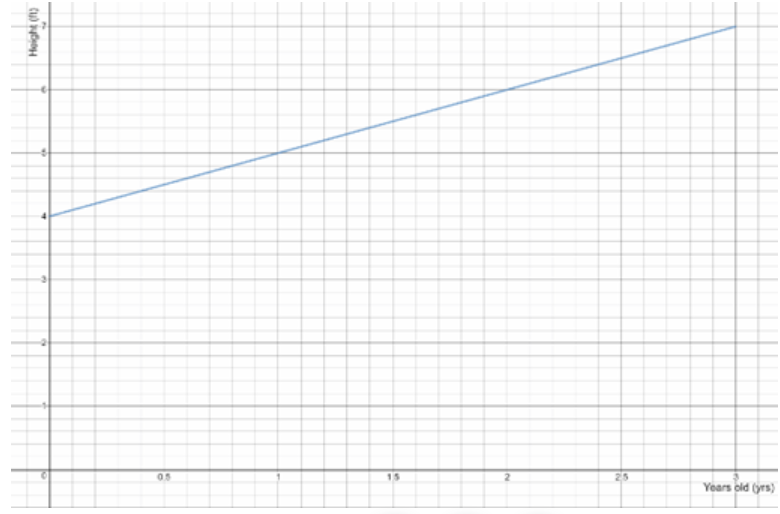
When time increases by 1 year, the height of the tree increases by \(\frac{7}{3}\)feet.
Given that, A class plants a tree. We need to sketch the graph of the height of the tree over time.
Since now we know that the variables are going to be the height of the tree and the time, we can simply sketch the graph.
Keep in mind that the graph is going to start at 3 ft.
The graph is
Functions And Modeling Relationships Grade 8 Exercise 3.6 Envision Math
Envision Math Grade 8 Volume 1 Student Edition Solutions Chapter 3 Use Functions To Model Relationships Exercise 3.6 Page 198 Exercise 5 Answer
Given that, an airplane takes 15 minutes to reach its cruising altitude. The plane cruises at that altitude for 90 minutes, and then descend for 20 minutes before it lands. We need to sketch the graph of the height of the plane over time.
First we need to find the variables. Variables are the time and altitude.
We can see that it states the plane takes 15minutes to reach full altitude which means the function is going to be increasing.
If the plane is cruising that means that the plane is flying at the same altitude the same time which means that the function is going to be a constant during those 90 minutes.
In the last part when plane is descending the graph is also going to be descending.
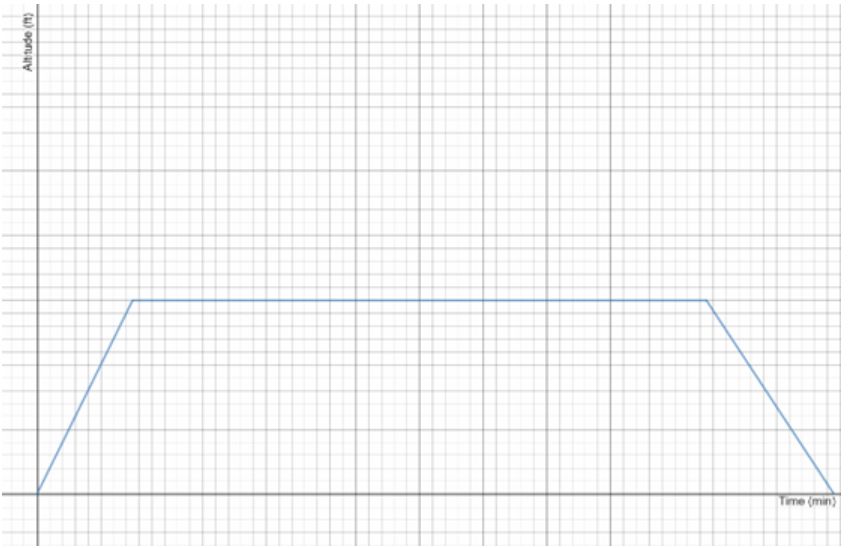
In the first part the function is increasing, in the second it is a constant and in the last part the function is decreasing.
Page 199 Exercise 6 Answer
We need to determine what relationship between money (in dollars) and time (in months) does this graph shows. Also, we need to write a description of the given graph.
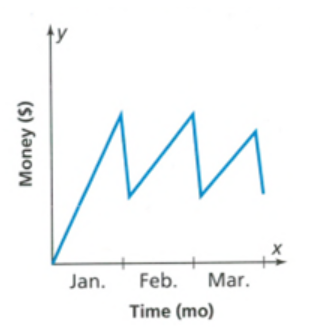
If we look at the graph we can see that the money is increasing from the start of January till the end of January. After that, we can a big drop in the money
If we look at the graph we can see that the money is increasing from the start of the January till the end of the January. After that we can a big drop in the money .
Envision Math Grade 8 Chapter 3 Exercise 3.6 Solutions
Envision Math Grade 8 Volume 1 Student Edition Solutions Chapter 3 Use Functions To Model Relationships Exercise 3.6 Page 199 Exercise 9 Answer
Given that, Melody starts at her house and rides her bike for 10 minutes to a friend’s house. She stays at her friend’s house for 60 minutes. We need to sketch a graph that represents this description.
From the question that we have in the task, we can see that the function is first going to increase and after that, it is going to be a constant because she will be at the same distance for 60 minutes.
After that, she goes back home and the graph is going to be decreasing

The graph is first going to increase than it is going to be constant and lastly it is going to decrease.
Page 199 Exercise 10 Answer
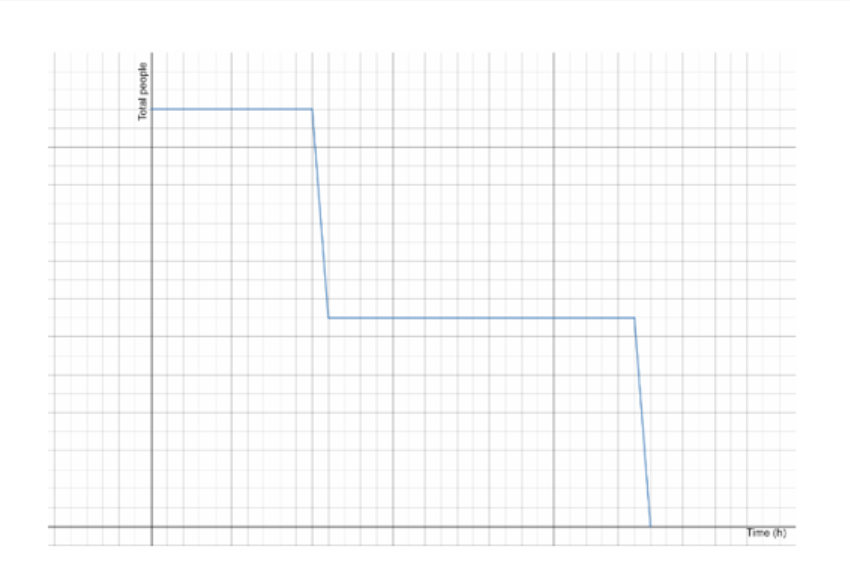
We need to find which among the below-given description best represents the graph shown.
(A) People are waiting for a train. A train comes and some people get on. The other people wait for the next train. As time goes by, people gradually leave the station.
(B) One train arrives and some people get off the train and wait in the station.
(C) People are waiting for a train. Everyone gets on the first train that comes.
(D) People are waiting for a train. A train comes and some people get on the train. The other people wait for the next train. Another train arrives and all of the remaining people get on.
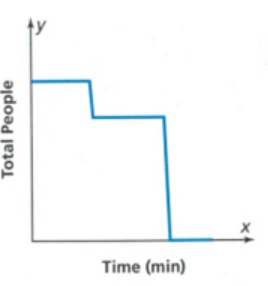
We can see the given graph first we have a constant of people which means that the people are waiting for the train.
After that we can see that part of the people got on that train and there are fewer people now remaining at the station.
Now the second train arrives and the rest of the people leave the station.
Therefore, the correct answer is option D.
Envision Math 8th Grade Exercise 3.6 Step-By-Step Functions Solutions
Envision Math Grade 8 Volume 1 Student Edition Solutions Chapter 3 Use Functions To Model Relationships Exercise 3.6 Page 200 Exercise 12 Answer
The graph is going to rapidly increase at start, and after that is going to start to descend until a fan catches it.
Descend just has to lesser than the increase.
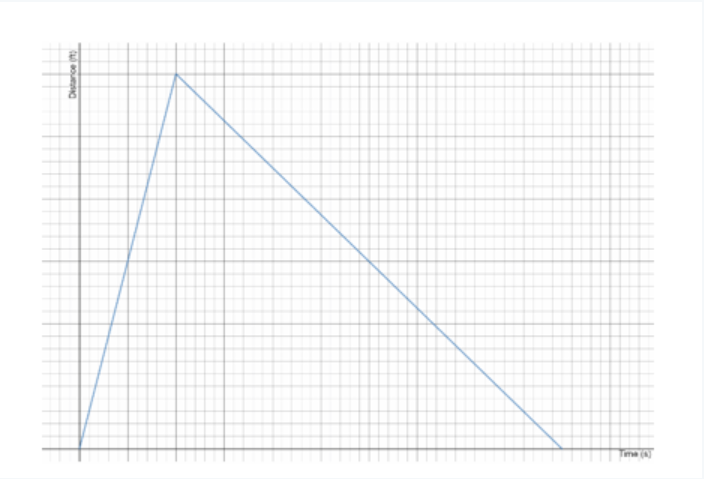
The graph is going to have a rapid increase at start and then it will start to decrease until it gets back to the ground.
How To Solve Exercise 3.6 Functions In Envision Math Grade 8
Page 200 Exercise 13 Answer
For the given variables we can make up a lot of descriptions.
Let’s say that the people are boarding a boat and there is a line in front of the boat. Each boat can carry only so many people, so there is going to be 2 boats that will pick up the people.
The first boat arrives after hour, and the second boat will arrive in 3 hours.
On the first boat only half the people boarded.
The rest of the people are waiting for the second boat.
After the second boat arrives the rest of the people board the boat.
There is some amount of people waiting to board a boat, after the first boat comes after an hour, half the people board the boat. The rest of the people wait for second boat which arrives two hours later and all of them board second boat.
Envision Math Grade 8 Chapter 3 Exercise 3.6 Practice Problems
Page 200 Exercise 14 Answer
The graph is going to have two constant parts and one decrease.
If at first they score same amount of runs in each of the first 4 innings than in this part the graph is a constant.
After that it will decrease to 0 and it will again be a constant

The graph is first going to have a constant. After that there will be a decrease to 0 and again the graph is going to become a constant.
The given graph would have more constant parts of the graph but there would also be an increase before each constant part and there is going to be a decrease after each constant.
There would be more constant parts which would have increase before them and the decrease after them.