
Envision Math Grade 8 Volume 1 Student Edition Solutions Chapter 3 Use Functions To Model Relationships Exercise 3.5
Page 189 Exercise 1 Answer
Given
Martin went aunt’s house , he has two route one is down hill and another one is edge hill
Find the relationship of speed and time?
Each route will have corresponding time needed to travel.
The difference is that the route that goes up and down the hill does not have a constant speed and the route that goes around the edge of the hill will most probably have a constant speed.
Time to pass each route will be roughly the same.
Route that goes up and down that hill does not have a constant speed while the route that goes around the edge of the hill will have constant speed.
Envision Math Grade 8 Volume 1 Chapter 3 Exercise 3.5 Functions Solutions
Page 189 Exercise 1 Answer
Given
Martin went aunt’s house , he has two route one is down hill and another one is edge hill.
Find the relationship of speed and time?
For the route that goes up and down the hill martin will have to put in more effort into going up the hill and his speed will decreases but after he gets to the peak he will not have to put so much effort into it because he will be going downhill.
For the second route that goes around the edge of the hill, the speed on this route will be constant which means that he will be travelling at roughly the same speed the whole route.
The time needed for both routes should be roughly the same.
The time needed for each route is the same, the only difference will be that the route that goes up and down the hill will require more effort going up and no effort going down the hill, and the other route requires the same amount of effort through the whole route.
Envision Math Grade 8 Volume 1 Student Edition Solutions Chapter 3 Use Functions To Model Relationships Exercise 3.5 Page 190 Question 1 Answer
Given
Describe the two quantities ?
Since the air conditioner is on, the temperature in the room is falling at a constant speed up to the point at which the temperature in the room will be the same as the temperature of the air that the air conditioner is blowing.
The temperature is falling at a constant speed up to the point at which the temperature will be the same as the temperature of the air coming from the air conditioner.
Page 190 Exercise 1 Answer
Given
Find the relationship of speed and time?
Each route will have corresponding time needed to travel.
The difference is that the route that express train does not have a constant speed and the route that express train will most probably have a constant speed.
Time to pass each route will be roughly the same.
Route that goes up express train does not have a constant speed while the route that goes around the express train will have constant speed.
Envision Math Grade 8 Exercise 3.5 Use Functions To Model Relationships
Envision Math Grade 8 Volume 1 Student Edition Solutions Chapter 3 Use Functions To Model Relationships Exercise 3.5 Page 190 Exercise 1 Answer
Given
Find the graph function changes the train speed increases?
As we can see from the graph, as the time passes the speed of the train is decreasing given function is linear.
The interval would best describe the process of train stopping.
At the time passes, the speed of the train is decreasing.
The function is linear.
Page 191 Exercise 3 Answer
Given
Write the graph scenario ?
The graph could represent a car trip somewhere, because first the distance is increasing at a constant speed which means someone is going somewhere.
The two constant intervals simply means that the car stopped, maybe for sightseeing.
Lastly, why this could be a car trip is because the function is decreasing in the interval 5 which means that we are coming back to the starting point.
The graph could be representing a car trip somewhere because we are going back to the starting point in the end.
Envision Math Grade 8 Volume 1 Student Edition Solutions Chapter 3 Use Functions To Model Relationships Exercise 3.5 Page 190 Exercise 1 Answer
Given
Whether the function increasing ?
From the slope of the linear function we know whether the function is increasing or decreasing because if the slope is positive value than the function will be increasing.
Positive slope of linear function means the function is increasing.
Page 192 Exercise 2 Answer
Given
Whether the function increasing or decreasing?
From the slope of the linear function we know whether the function is increasing or decreasing because if the slope is positive value than the function will be increasing but if the value is negative that the function is decreasing.
Positive slope of linear function means the function is increasing, and the negative slope of linear function means the function will be decreasing.
Functions And Modeling Relationships Grade 8 Exercise 3.5 Envision Math
Envision Math Grade 8 Volume 1 Student Edition Solutions Chapter 3 Use Functions To Model Relationships Exercise 3.5Page 192 Exercise 3 Answer
Given
What kind the graph function is shown at same output or y-values , for each input value or, x-value?
If the output of some function is always the same that means that the graph of the function is going to be a constant.
The graph of the function is a constant.
Page 192 Exercise 5 Answer
Given
Which intervals increasing , decreasing and constant?
We simply have to read the graph to get the information that we need.
In the first interval the function is constant.
In the second interval the function is a decreasing.
In the third interval the function is increasing.
In the fourth interval the function is increasing.
In the fifth interval the function is constant.
In the sixth interval the function is decreasing.
1 → constant
2 → decreasing
3 → increasing
4 → increasing
5 → constant
6 → decreasing
Page 193 Exercise 6 Answer
Given
Which intervals increasing , decreasing and constant?
We simply have to read the graph to get the information that we need.
In the 1, 3 and 6 interval the function is increasing.
In the 4 interval the function is constant.
In the 2 and 5 interval the function is decreasing.
The function is increasing in intervals 1,3 and 6.
The function is decreasing in intervals 2 and 5.
The function is constant in interval 4 .
Envision Math Grade 8 Chapter 3 Exercise 3.5 Solutions
Envision Math Grade 8 Volume 1 Student Edition Solutions Chapter 3 Use Functions To Model Relationships Exercise 3.5 Page 193 Exercise 8 Answer
Given
Which intervals increasing , decreasing and constant?
We simply have to read the graph to get the information that we need.
In interval a) is increasing.
In interval b) is constant.
In interval c) is decreasing.
In interval d) is constant.
a) → increasing
b) → constant
c) → decreasing
d) → constant
Page 193 Exercise 9 Answer
Given
Which intervals increasing , decreasing and constant?
There are 3 intervals in which the function is increasing.
We can see on the given graph that there are 3 peaks.
The function is increasing up to the point until we got to the peak.
So this means that 3 interval in which the function is increasing are right before the peaks of the function.
The greatest increase is the first interval of the function before the first peak.
3 intervals in which the function is increasing which are right before the peeks of the function.
The first interval, where the function starts has the greatest increase.
Envision Math 8th Grade Exercise 3.5 Step-By-Step Functions Solutions
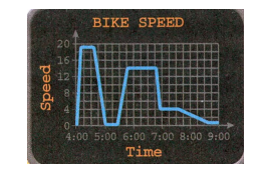
Envision Math Grade 8 Volume 1 Student Edition Solutions Chapter 3 Use Functions To Model Relationships Exercise 3.5 Page 193 Exercise 10 Answer
Given
What is the constant interval represent?
The constant intervals on the given graph represent either the car travelling at constant speed or the car stopping because there is one constant interval which has no speed.
The constant intervals on the graph are showing the constant speed of the car, and the car stopping the interval where the car is not moving because there is no speed.
Page 194 Exercise 11 Answer
Given
How many intervals function is decreasing?
We simply have to need from the graph the information that we need
There are 3 intervals in which the function is decreasing.
3 intervals.
Given
How are the decreasing intervals alike?
Every decreasing interval lasts about the same amount of time.
The first and third intervals are roughly the same frequency as well.
The decreasing intervals last about the same amount of time
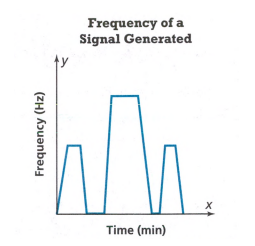
Second interval has the highest frequency while the first and the third have roughly the same frequency.
Second interval has higher frequency than the remaining two.
How To Solve Exercise 3.5 Functions In Envision Math Grade 8
Envision Math Grade 8 Volume 1 Student Edition Solutions Chapter 3 Use Functions To Model Relationships Exercise 3.5Page 194 Exercise 12 Answer
We can see that the function has intervals in which it is a constant which means the student is wrong.
There is one interval in which the speed is but it is still an interval in which the function is a constant.
Therefore, there are intervals in which the function is a constant.
The student forgot to include the interval in which the speed is 0.
This still counts as an interval of the function and in given interval the function is a constant.
The student forgot to include the interval in which the speed is 0.
Envision Math Grade 8 Chapter 3 Exercise 3.5 Practice Problems
Page 194 Exercise 14 Answer
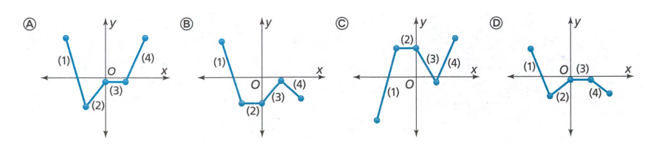
We have to check all the graphs whether they fit the description.
It states that the graph is in interval 1 which means that the graph C is not the graph that we are looking for because the first interval in graph C is increasing.
In the second interval the function is increasing which means that graph B is not the graph that we are looking for because the second interval in the graph B is a constant.
In the third interval the function has to be a constant which both graphs A and D have.
In the last interval they should be decreasing which means that the only graph that is corresponding to the description in the graph D.
Hence, the right graph is graph D.