Envision Math Grade 8 Volume 1 Student Edition Solutions Chapter 3 Use Functions To Model Relationships Exercise 3.2
Page 165 Exercise 1 Answer
Given
Day inputs 1,2,3,4,5,6,7
Distance 30,28,30,27,30,24,36
How long the whale cross the 3,100 miles?
To find out how long will it take for the whale to travel 3,100 miles to their breeding grounds first we have to find the average distance the whale travels in one day.
We do this by adding all the values and after that dividing by the number of values that we added.
30 + 28 + 30 + 27 + 30 + 24 + 36 = 205
Now simply divide the value with 7
205 ÷ 7 = 29.286
Now that we have found how much the whale travels daily we can simply divide the number of miles needed to cross with his daily momentum,
3,100 ÷ 29.286 = 105.85
Since the real life values can not be decimal numbers, the whale needs about 106 days to travel to breeding grounds.
The whale needs about 106 days to travel 3,100 miles.
Page 166 Question 1 Answer
Here we have to explain the different representations of a function.
Definition and Symbolic Representation
Quadratic functions can be represented symbolically by the equation, y(x) = ax2 + bx + c, where a, b, and care constants, and a ≠ 0.
This form is referred to as the standard form.
A function can be represented in three ways,
Graph
Table of data
Equation
The graph, table of data, or an equation are the three different representations of a function.
Envision Math Grade 8 Chapter 3.2 Solutions
Envision Math Grade 8 Volume 1 Student Edition Solutions Chapter 3 Use Functions To Model Relationships Exercise 3.2 Page 166 Exercise 1 Answer
Given that, the total volume of the swimming pool is 9000 gallons.
As the pump is pumping water, the amount of water in the pool decreases at a constant rate. We need to graph the function.
We need to find the amount of water remaining in the pool, the amount of water pumped each hour, and the corresponding linear equation.
The total volume of the swimming pool is 9000 gallons.
From the given graph, the pump is pumping water at 750 gallons per hour.
The start of the graph is the y−intercept.
Thus, y−intercept = 9000
Here the equation corresponding to the given scenario is,
y = 9000 − 750x
where x is the number of hours and y is the number of water remaining after x hours.
The graph is,
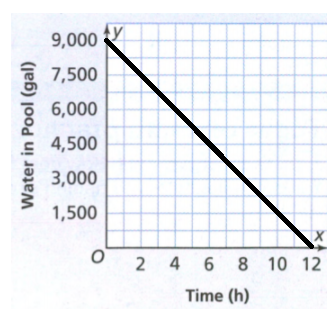
The amount of water remaining in the pool is 9000 gallons.
The amount of water pumped each hour is 750 gallons.
The equation is y = 9000 − 750x.
The graph is,
Envision Math Grade 8 Volume 1 Student Edition Solutions Chapter 3 Use Functions To Model Relationships Exercise 3.2Page 167 Exercise 2 Answer
We need to draw a graph that represents a linear function. Also, find an equation that represents the function.
When we graph linear functions, it is shown as a straight line in the graph.
The form of linear equations will be
y = mx + b
where m is the slope and b is the y-intercept.
Here, we can draw any linear function on the graph.
Let the linear function be y = 3x − 8
The graph will be,
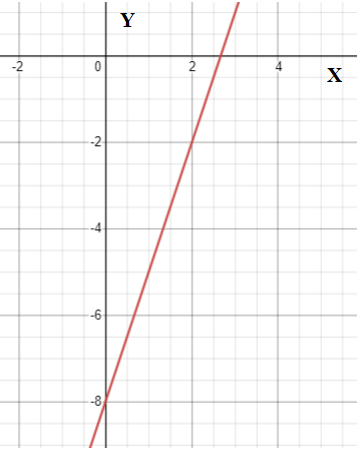
The graph of y = 3x – 8 will be,
Envision Math Grade 8 Functions Modeling Exercise 3.2 Answers
Envision Math Grade 8 Volume 1 Student Edition Solutions Chapter 3 Use Functions To Model Relationships Exercise 3.2 Page 168 Exercise 1 Answer
Here we have to explain the different representations of a function.
Definition and Symbolic Representation
Quadratic functions can be represented symbolically by the equation,y(x) = ax2 + bx + c, where a,b, and c are constants, and a ≠ 0.
This form is referred to as standard form.
A function can be represented in three ways,
Graph
Table of data
Equation
The graph, table of data, or an equation are the three different representations of a function.
Page 168 Exercise 3 Answer
We have to explain among the ordered pairs of a function which is to be connected by a straight line or a curve on a graph.
A function’s ordered pairs can be connected by either the straight line or by the curve depending upon the type of the function.
If the function is linear, then the graph must be connected by a straight line.
If the function is quadratic, then the graph must be connected by a curve.
Thus, we can use both depending upon the type of the function.
The ordered pairs of a function can be connected by either a straight line or a curve on a graph depending upon the type of function the ordered pairs represent.
Envision Math Grade 8 Volume 1 Student Edition Solutions Chapter 3 Use Functions To Model Relationships Exercise 3.2 Page 168 Exercise 4 Answer
Given that, Darlene tracks the number of party hats her company has in stock. The table shows the weekly stock. We need to find whether the relationship is a linear function or not using the table given.
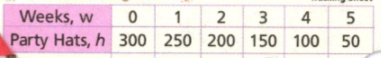
Plotting the values in the table in a graph, we get,
The graph obtained represents a straight line.
Hence, it is linear.
The given relationship is a linear function.
The graph obtained by plotting the given values is,
Page 169 Exercise 6 Answer
We need to determine whether the given graph represents a function or not.
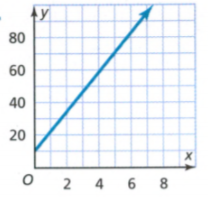
The given graph is,
The above graph represents a straight line.
Thus, it represents a linear function.
This is because the function represented by a straight line is a linear function.
The given graph represents a linear function.
Envision Math Grade 8 Volume 1 Student Edition Solutions Chapter 3 Use Functions To Model Relationships Exercise 3.2 Page 169 Exercise 7 Answer
We need to determine whether the given graph represents a function or not.
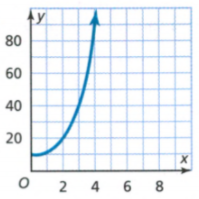
The graph is,
From the above graph, the line is not a straight line rather it is a curve.
Check if there are multiple x coordinates for every y coordinates given.
Here, there is only one i.e., an unique x coordinate for every y coordinate.
Thus, the given relationship is a function.
The given graph represents a function.
Solutions To Envision Math Chapter 3 Use Functions Exercise
Page 169 Exercise 9 Answer
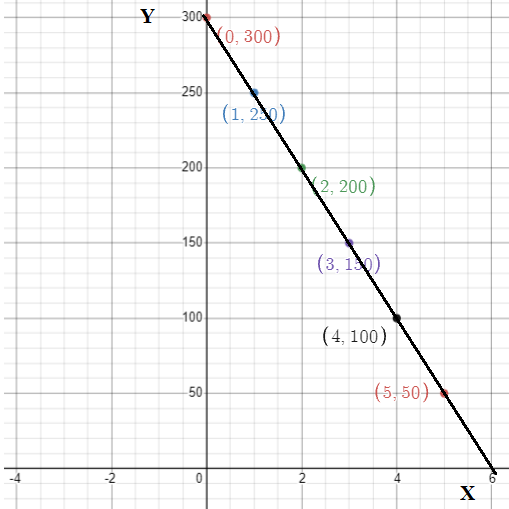
Given that, the relationship between the number of hexagons ,x and the perimeter of the figure they form ,y is shown in the graph. We need to find whether the perimeter of the figure a function of the number of hexagons. The graph is,
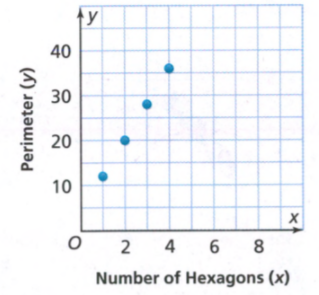
Connecting all the points together in the given graph, we get,
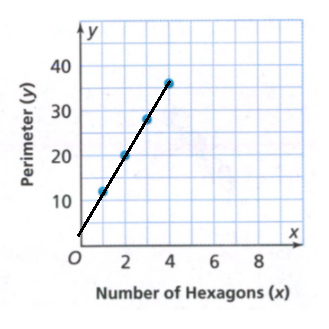
The above graph represents a straight line.
Thus, it represents a linear function.
This is because the function represented by a straight line is a linear function.
The perimeter of the figure is a function of the number of hexagons.
Envision Math Grade 8 Volume 1 Student Edition Solutions Chapter 3 Use Functions To Model Relationships Exercise 3.2 Page 169 Exercise 10 Answer
We need to determine whether the ordered pairs plotted in the graph below represent a function or not.
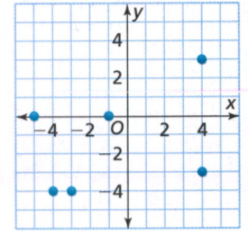
From the above graph, the line is not a straight line.
Therefore, check if there are multiple x coordinates for every y coordinates given.
Here, there are more than one x coordinate which corresponds to the same y coordinate.
From the above graph, each x value does not correspond to only one y value.
The graph does not represent a function.
The ordered pairs plotted in the graph don’t represent a function.
Envision Math Modeling Relationships Functions Worksheet
Page 170 Exercise 11 Answer
Given that, A train leaves the station at the time t=0. Traveling at a constant speed, the train travels 360 kilometers in 3 hours.
We need to write a function that relates the distance traveled, d to the timet.
Finding the distance travelled by the train in one hour, thus we get,
\(\frac{360}{3}=\frac{120 k m}{h r}\)This implies that the train travels at a constant rate of 120 km/hr.
Therefore, the equation corresponding to this will be,
d = 120t
where t is the number of hours and d is the distance travelled.
The function that relates the distance traveled d to the time t is d = 120t
Given that, A train leaves the station at time t = 0. Traveling at a constant speed, the train travels 360 kilometers in 3hours.
We need to graph the function and tell whether it is a linear function or a nonlinear function.
The function that relates the distance traveled d to the time t is given by
d = 120t
Graphing the obtained function, we get,
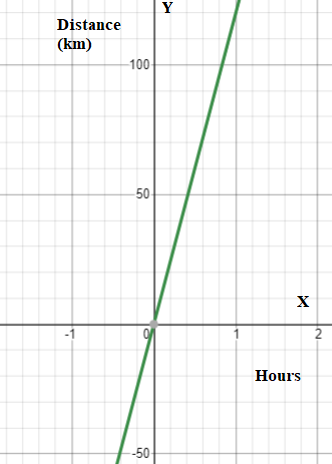
The above graph represents a straight line.
Thus, it represents a linear function.
This is because the function represented by a straight line is a linear function.
From, the graph, the distance is proportional to the time.
The given function is a linear function.
The graph of the given function is,
Envision Math Functions And Relationships Chapter 3.2 Key
Envision Math Grade 8 Volume 1 Student Edition Solutions Chapter 3 Use Functions To Model Relationships Exercise 3.2 Page 170 Exercise 12 Answer
We need to check and tell whether each graph is a function and justify your answer. Also, determine which graph is not a good representation of a real-world situation. The given graphs are,
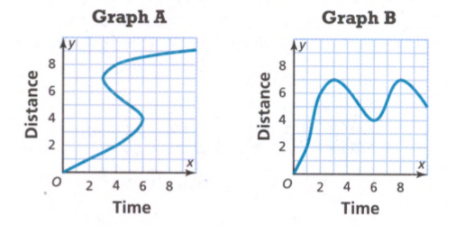
The given graph is,
The above graphs doesn’t represent a straight line.
Therefore, check if there are multiple x coordinates for every y coordinates given.
In both Graph A and Graph B’s, there are more than one x coordinate which corresponds to the same y coordinate.
Thus, both of them doesn’t represent a function.
Also, in Graph A, the graph rises to the left and coming back to the right again.
This refers that the time goes back downwards. This is not possible in real life.
The graphs do not represent a function and graph A does not represent the real-world situation.
Envision Math Chapter 3.2 Exercise Guide
Envision Math Grade 8 Volume 1 Student Edition Solutions Chapter 3 Use Functions To Model Relationships Exercise 3.2 Page 170 Exercise 13 Answer
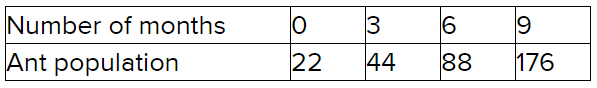
Given that, You have an ant farm with 22 ants. The population of ants on your farm doubles every 3 months. We need to complete the table. Also, find whether the relation is a function or not. If so, determine if it is a linear function or a nonlinear function.
Here, we have to determine the graph represents the function or not.
According to the question the ant farm with 22 ants. The population of the ants on the farm doubles every three months.
Thus, the table will become,
Plotting the ordered pairs obtained in a graph, we get,
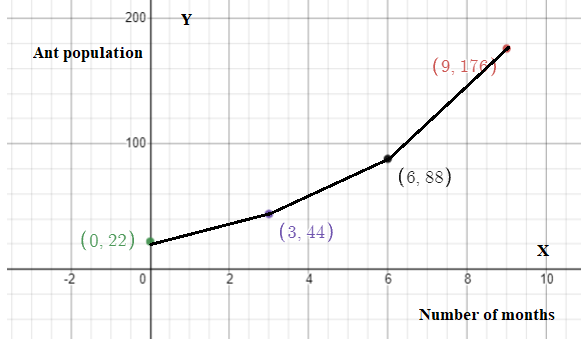
From the above graph, the line is not a straight line.
Therefore, check if there are multiple x coordinates for every y coordinates given.
Here, there is only one x coordinate which corresponds to one y coordinate.
Therefore, the function is non-linear.
The relation is a non-linear function.
Envision Math Grade 8 Use Functions Model Relationships Solutions
Envision Math Grade 8 Volume 1 Student Edition Solutions Chapter 3 Use Functions To Model Relationships Exercise 3.2 Page 170 Exercise 14 Answer
Given:
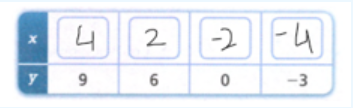
\(y=\frac{3}{2} x+3\)Find: fill the table
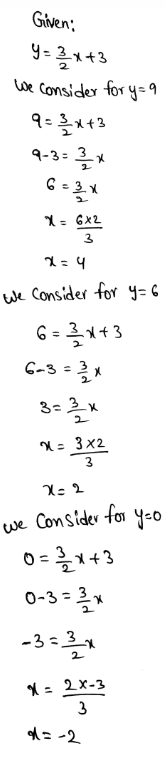
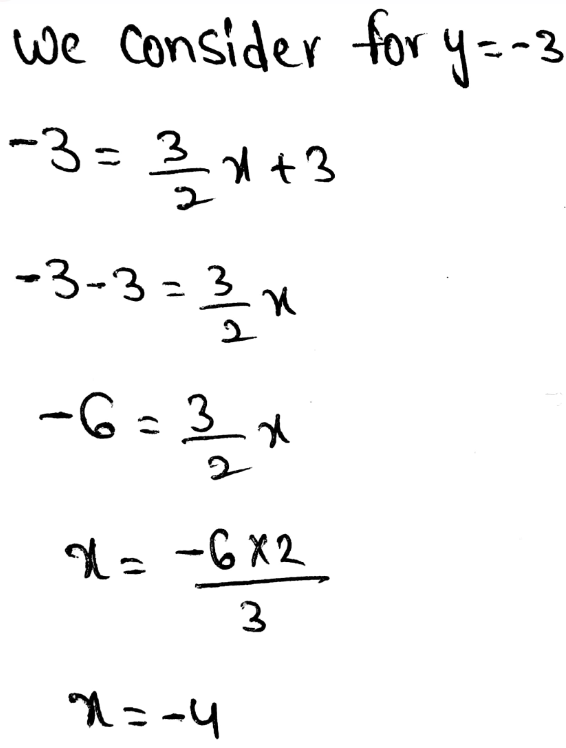
Therefore the required solution is: