
Cengage Financial Algebra 1st Edition Chapter 5 Exercise 5.3 Automobile Ownership
Page 232 Problem 1 Answer
Given ; $540 $550 $550 $550 $550 $600 $600 $600 $675 $700 $700 $700 $990 $990 $990 $990 $990 $1,000 $1,200 $1,200 $1,200
To find; Use the frequency distribution to find the number of car stereos selling for less than 800.
Jerry can set up a frequency distribution. A frequency distribution is a table that gives each price and the frequency—the number of stereos that are advertised at each price.
Jerry adds the numbers in the frequency column to find the total frequency—the total number of pieces of data in his data set.
He wants to make sure he did not accidentally leave out a price.
Because there are prices in the set, and the sum of the frequencies is19 when the stereos selling for less than 800 Jerry concludes his frequency distribution is correct
Hence the number of car stereos selling for less than 800 is 19 so frequency will be 19
Page 233 Problem 2 Answer
Given ; He is not interested in any of the car steroes priced below $ 650 because they are in poor condition
To find : Find the mean of the data set that remains after those prices are removed.
Jerry creates another column in his table for the product of the fi rst two column entries.
The sum of the entries in the third column, 4540 is used to find the mean.
This is the same sum you would find if you added the original 8 prices.
Divide by 8 to find the mean, and round to the nearest cent 4540/8
=$567.5
The mean of the prices is $567.5
Hence the mean price of the stereos is $567.5
Read and Learn More Cengage Financial Algebra 1st Edition Answers
Cengage Financial Algebra Chapter 5.3 Automobile Ownership Guide
Cengage Financial Algebra 1st Edition Chapter 5 Exercise 5.3 Automobile Ownership Page 233 Problem 3 Answer
Given; Rod was doing Internet research on the number of gasoline price changes per year in gas stations in his county.
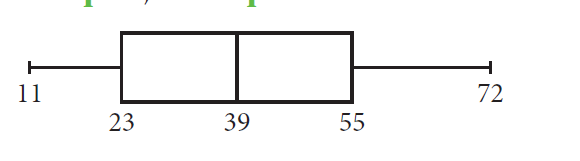
To find: Find the range and the upper and lower quartiles for the stem-and-leaf plot.
A stem-and-leaf plot displays data differently than a frequency table.
To read the stem-and-leaf plot, look at the fi rst row. In this plot, the numbers to the left of the vertical line represent the tens place digit, and are the stems.
The numbers to the right of the vertical line represent the digits in the ones place, in ascending order, and are the leaves.
The first row represents these numbers.
11,11,12,13,17,19
The second row represents these numbers.
20,23,26,26
The last row represents the number 72.
Here we see that lower quartile will be 23 and upper quartiles will be 55
Hence we conclude that the lower quartile will be 23 and upper quartiles will be 55
Page 234 Problem 4 Answer
Given ;
To find: what percent of the gas stations had 55 or fewer price changes?
The box part of the diagram helps you fi nd the interquartile range, because it displays Q1 and Q3.
Q3−Q1=55−23=32
The interquartile range is 32. That means 50 of all the gas prices are within this range.
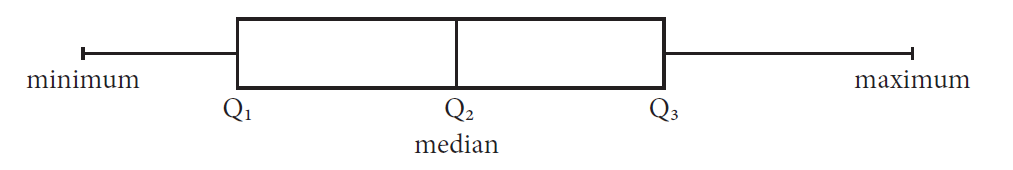
Hence we conclude that 50 % percent of the gas stations had 55 or fewer price changes
Cengage Financial Algebra 1st Edition Chapter 5 Exercise 5.3 Automobile Ownership Page 235 Problem 5 Answer
Given ;
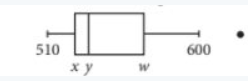
To find: Examine the modified boxplot. Is 400 an outlier.
Quartiles are shown on the boxplot, so you can fi nd the interquartile range.
The interquartile range is
IQR=Q3−Q1=w−x
Q1−1.5(IQR)=x−1.5(w−x)
There are no lower outliers.
The boundary for upper outliers is Q3+1.5(IQR)=w+1.5(w−x)
There is at least one upper outlier, the high price of 600. From this boxplot, you cannot tell if there are any others, because the boxplot does not give all the original data.
Boxplots are drawn to scale, so the long whisker on the right means that there could be more than one outlier.
Hence we conclude that 400 is not a outliner
Page 236 Problem 6 Answer
The Objective is to Interpret the quote in the context of what you learned
In order to create a theory, you need something to base your theory on (else it will be completely unfounded).
The basis for the theory is then data, as we can use data to show/indicate that some theory could be true.
If you do not base your theory on data, then it is possible that your theory is completely wrong and thus you then made a capital mistake.
Hence, If you do not base your theory on data, then it is possible that your theory is completely wrong and thus you then made a capital mistake.
Solutions For Exercise 5.3 Financial Algebra 1st Edition
Cengage Financial Algebra 1st Edition Chapter 5 Exercise 5.3 Automobile Ownership Page 236 Problem 7 Answer
Given that the frequency table
To find median By finding the middle value
The data set contains 33 prices, the median will be the 17th data value.
Add the first number of frequencies until obtain 17:
1+4+3+1+7+1=17
hence, The 17th number in the dataset is 750
The median of the dataset is 750
Page 236 Problem 8 Answer
Given that the frequency table
To find mode By finding the most appear number
From the given dataset, 700 appears most i.e 7 times
So, The mode is 700
Cengage Financial Algebra 1st Edition Chapter 5 Exercise 5.3 Automobile Ownership Page 236 Problem 9 Answer
Given that the frequency table
To find the range by using the basic calculation
From the given dataset:
Highest value: 1200
lowest value: 540
Range=1200−540=660
Therefore, Range=660
Page 236 Problem 10 Answer
Given that Martina found the mean of the data from Example 1 by adding the prices in the first column and dividing by the number of prices she added
To find why Martina got incorrect answer
By using mean definition
She didn’t consider that how many times that the price occur.
She have to first calculate sum of the multiplication of the price and the frequency of that price and then divide this sum with the number of prices
Page 236 Problem 11 Answer
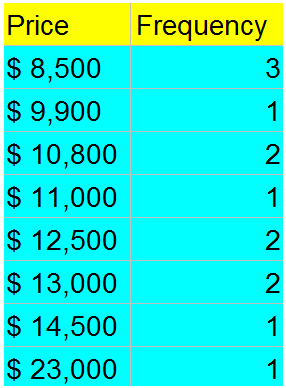
Given that the prices of the Chevrolet HHR retro trucks
To find frequency table for the given dataset
By using the frequency values
The frequency table is
Cengage Financial Algebra 1st Edition Chapter 5 Exercise 5.3 Automobile Ownership Page 236 Problem 12 Answer
Given that the prices of the Chevrolet HHR retro trucks
To find mean for the given dataset
By using the basic calculation
Mean =8500+8500+8500+9900+10800+10800+11000+12500+12500+13000+13000+14500+23000/13
=156500/13
=12038.46≈12038
Mean for the given dataset is 12038
Page 236 Problem 13 Answer
Given that the prices of the Chevrolet HHR retro trucks
To find median for the given dataset By using the basic calculation
The given dataset contains 13 values. So, 7thvalue is the middle value
The 7th value in the given dataset is 11000
The median value is $11000
Page 236 Problem 14 Answer
Given that the prices of the Chevrolet HHR retro trucks
To find mode for the given dataset
By using the basic calculation
From the given dataset, 8500 appears most number of times
So the mode is $8500
Cengage Financial Algebra 1st Edition Chapter 5 Exercise 5.3 Automobile Ownership Page 236 Problem 15 Answer
Given that the prices of the Chevrolet HHR retro trucks
To find range for the given dataset By using the basic calculation
From the given dataset:
Lowest value: 8500
highest value: 23000
Range=23000−8500
=$ 14500
Therefore, the range is$ 14500.
Page 236 Problem 16 Answer
Given that the prices of the Chevrolet HHR retro trucks
To find the four quartiles for the given dataset
By using the basic calculation
From 6(b), median=11000
First quartile is the middle number from smallest number to the median
Q1=8500+9900/2
=9200
Second quartile is the median value
Q2=11000
Third quartile is the middle value from median to the highest number
Q3=13000+13000/2
=13000
Fourth quartile is the highest value
Q4=23000
The four quartiles are 9200, 11000, 13000, 23000
Page 236 Problem 17 Answer
Given that the prices of the Chevrolet HHR retro trucks
To find the interquartile range for the given dataset
By using the basic calculation
From 6(f)
First quartile =9200
Third quartile=13000
Interquartile range=third quartile−first quartile
=13000−9200
=$ 3800
The interquartile range is $3800
Cengage Financial Algebra 1st Edition Chapter 5 Exercise 5.3 Automobile Ownership Page 236 Problem 18 Answer
Given that the prices of the Chevrolet HHR retro trucks
To find the boundary for upper outliers for the given dataset
By using the basic calculation
From 6(f), Third quartile Q3
=13000
From 6(g), Interquartile range IQR=3800
The boundary for the upper outliers=Q3+1.5IQR
=13000+1.5⋅3800
=$18700
The boundary for the upper outliers is $18700
Page 236 Problem 19 Answer
Given that the prices of the Chevrolet HHR retro trucks
To find the boundary for lower outliers for the given dataset
By using the basic calculation
From 6(f), The first quartileQ1
=9200
From 6(g), The interquartile range IQR=3800
The boundary for lower outliers=Q1−1.5IQR
=9200−1.5⋅3800
=3500
The boundary for lower outliers $3500
Cengage Financial Algebra 1st Edition Chapter 5 Exercise 5.3 Automobile Ownership Page 236 Problem 20 Answer
Given that the prices of the chervrolet HHR retro trucks
To find number of outliers for the given dataset
By using the basic calculation
From 6(h), The upper outlier is $18700
From 6(i), The lower outlier is $3500
From the given dataset $23000 is above the upper outlier. All remaining values are between the lower and upper outlier.
So, There is only one outlier
Page 236 Problem 21 Answer
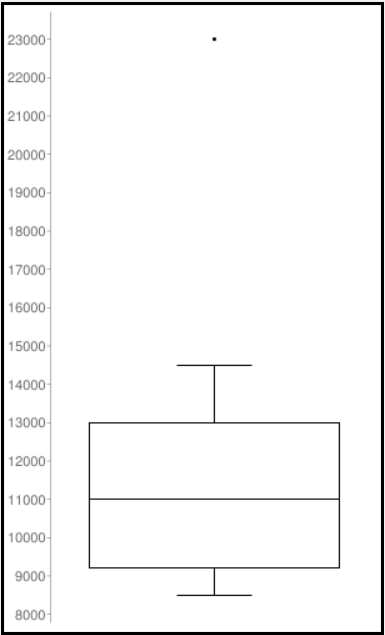
Given that the prices of the Chevrolet HHR retro trucks
To draw a modified box-and-whisker plot for the given dataset
By using the basic calculation
The box-and-whisker plot for the given data is
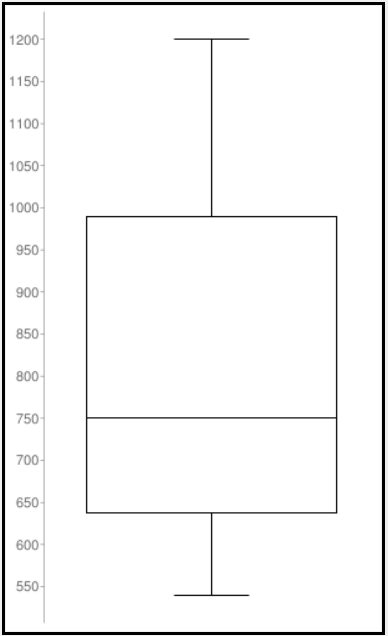
Page 236 Exercise 1 Answer
Given that the dataset of 33 values
To draw a modified box-and-whisker plot for the given dataset
By using the given data
The data in ascending order is
540,550,550,550,550,600,600,600,675,700,700,700,700,700,700,700,750,775,775,800,870,900,900,990,990,990,990,990,990,1000,1200,1200,1200
The five number summery is minimum, first quartile, median, third quartile, maximum values
Minimum value is 540
Median is the middle value in that sorted data.
Median=750
First quartile is the median of the data below the median value
Q1=675+600/2
=637.5
Third quartile is the median of the data above the median value
Q3=990+990/2
=990
maximum value is 1200
The box-and-whisker plot is

The box-and-whisker plot for the given data is
Chapter 5 Exercise 5.3 Automobile Ownership Walkthrough Cengage
Cengage Financial Algebra 1st Edition Chapter 5 Exercise 5.3 Automobile Ownership Page 236 Exercise 2 Answer
Given that the dataset of 33 values
To find that how can we determine if it would be appropriate to create a modified boxplot for this data
By using the given data
If the given dataset contains the outliers, then we can create a modified boxplot for the given data.
But for this problem, there are no outliers(From 7(a))
Page 236 Exercise 3 Answer
Given that the dataset of 33 values
To find outliers By using the given data
The data in ascending order is
540,550,550,550,550,600,600,600,675,700,700,700,700,700,700,700,750,775,775,800,870,900,900,990,990,990,990,990,990,1000,1200,1200,1200
From 7(a)
The first quartile Q1
=637.5
The third quartile Q3
=990
The interquartile range is IQR=Q3−Q1
=990−637.5
=352.5
The upper outlier is Q3+1.5IQR=990+1.5⋅352.5
=1518.75
The lower outlier is Q1−1.5IQR=637.5−1.5⋅352.5
=108.75
All the values from the dataset are in between the lower and upper outlier.
So, there are no outliers for the given distribution of data
There are no outliers for the given distribution
Page 237 Exercise 4 Answer
Given that the stem-and-leaf plot of the cold spring high school students poll data
To find number of students polled
By using the count
By counting the number of values on the right side, We get 27 students were polled
Page 237 Exercise 5 Answer
Given that the stem-and-leaf plot of the cold spring high school students poll data
To find the mean to the nearest cent By using the count
The values from the stem-and-leaf plot are
17,41,41,42,49,47,53,53,53,53,53,61,63,64,66,67,68,69,71,73,75,75,77,82,82,83,84
Mean=17+41+41+42+49+47+53+53+53+53+53+61+63+64+66+67+68+69+71+73+75+75+77+82+82+83+84/27
=1662/27
=61.56
≈62
The mean of the given dataset is 62
Cengage Financial Algebra 1st Edition Chapter 5 Exercise 5.3 Automobile Ownership Page 237 Exercise 6 Answer
Given that the stem-and-leaf plot of the cold spring high school students poll data
To find the median.
By using the count
The values from the stem-and-leaf plot are
17,41,41,42,49,47,53,53,53,53,53,61,63,64,66,67,68,69,71,73,75,75,77,82,83,84
The data in ascending order are
17,41,41,42,47,49,53,53,53,53,53,61,63,64,66,67,68,69,71,73,75,75,77,82,82,83,84
There are 27 values in the data. So, 14th value is the middle value
The median is 64
The median of the given dataset is 64
Page 237 Exercise 7 Answer
Given that the stem-and-leaf plot of the cold spring high school students poll data
To find the mode By using the count
The values from the stem-and-leaf plot are
17,41,41,42,49,47,53,53,53,53,53,61,63,64,66,67,68,69,71,73,75,75,77,82,82,83,84
The mode is the number that occur most
In the given dataset 53 occur 5 times
The mode is 53
The mode for the given dataset is 53
Cengage Financial Algebra 1st Edition Chapter 5 Exercise 5.3 Automobile Ownership Page 237 Exercise 8 Answer
Given that the stem-and-leaf plot of the cold spring high school students poll data
To find the range By using the count
The values from the stem-and-leaf plot are
17,41,41,42,49,47,53,53,53,53,53,61,63,64,66,67,68,69,71,73,75,75,77,82,82,83,84
Range is the difference between the highest and lowest values of the data
Highest value: 84
Lowest value: 17
Range=84−17=67
The range for the given dataset is 67
Page 236 Exercise 9 Answer
Given that the stem-and-leaf plot of the cold spring high school students poll data
To find the four quartiles.
By using the count
The values from the stem-and-leaf plot are
17,41,41,42,49,47,53,53,53,53,53,61,63,64,66,67,68,69,71,73,75,75,77,82,82,83,84
From 10(c), The median is 64
First quartile is the middle number from smallest number to the median
Q1=53
Second quartile is the median value
Q2=64
Third quartile is the middle value from median to the highest number
Q3=75
Fourth quartile is the highest value
Q4=84
The four quartiles for the given dataset are 53, 64, 75, 84
Cengage Financial Algebra 1st Edition Chapter 5 Exercise 5.3 Automobile Ownership Page 237 Exercise 10 Answer
Given that the stem-and-leaf plot of the cold spring high school students poll data
To find percent of the students spent $ 53 or more on gas
By using the count
The values from the stem-and-leaf plot are
17,41,41,42,49,47,53,53,53,53,53,61,63,64,66,67,68,69,71,73,75,75,77,82,82,83,84
From the data, Total number of students=27
Number of students spent $53 or more on gas=21
percentage of students spent $53 or more on gas=21/27∗100
=77.78
The values from the stem-and-leaf plot are
17,41,41,42,49,47,53,53,53,53,53,61,63,64,66,67,68,69,71,73,75,75,77,82,82,83,84
From the data,
Total number of students=27
Number of students spent $53 or more on gas=21
percentage of students spent $53or more on gas=21/27∗100
=77.78
Page 237 Exercise 11 Answer
Given that the stem-and-leaf plot of the cold spring high school students poll data
To find the interquartile range
By using the count
The values from the stem-and-leaf plot are
17,41,41,42,49,47,53,53,53,53,53,61,63,64,66,67,68,69,71,73,75,75,77,82,82,83,84
From 10(f),
Q1=53
Q3=75
The interquartile range=Q3−Q1
=75−53
=$ 22
The interquartile range is $22
Cengage Financial Algebra 1st Edition Chapter 5 Exercise 5.3 Automobile Ownership Page 237 Exercise 12 Answer
Given that the stem-and-leaf plot of the cold spring high school students poll data
To find the percent of the students spent from $ 53 to $ 75 on gas
By using the count
The values from the stem-and-leaf plot are
17,41,41,42,49,47,53,53,53,53,53,61,63,64,66,67,68,69,71,73,75,75,77,82,82,83,84
From the data,
Total number of students=27
Number of students spent from 53 to 75 on gas =16 percent of the students spent from $ 53 to $ 75 on gas=16/27∗100
=59.26
59.26% students spent from $53 to $75 on gas
Page 237 Exercise 13 Answer
Given: In earlier parts, the first and third quartiles were
Q1=$53
Q3=$75
IQR=$22.
To find: The boundary for the lower outliners.The lower outliners have aQ{1}−1.5 IQRboundary.
Q − 1.5 . 1 IQR = $53 − 1.5 × $22
= $20
The boundary for the lower outliners is $20.
Cengage Financial Algebra 1st Edition Chapter 5 Exercise 5.3 Automobile Ownership Page 237 Exercise 14 Answer
Given: In earlier parts, the first and third quartiles were
Q1=$53
Q3=$75
IQR=$22.
To find The boundary for the upper outliners.The upper outliners have aQ{3}+1.5IQR boundary.
Q3 + 1.5IQR = $75 + 1.5 × $22
= $108
The boundary for the upper outliners is $108.
Page 237 Exercise 15 Answer
Given: Outliner’s boundaries are$20,$108.
To find The number of outliners. The items in the dataset that are lower than$108
or higher than$20
are known as outliners. So, our one any only outliner is$17.
We have only one outliner.
Cengage Financial Algebra 1st Edition Chapter 5 Exercise 5.3 Automobile Ownership Page 236 Exercise 16 Answer
Given: Stem-and-leaf plot of data is provided.
To do: Draw a modified boxplot.
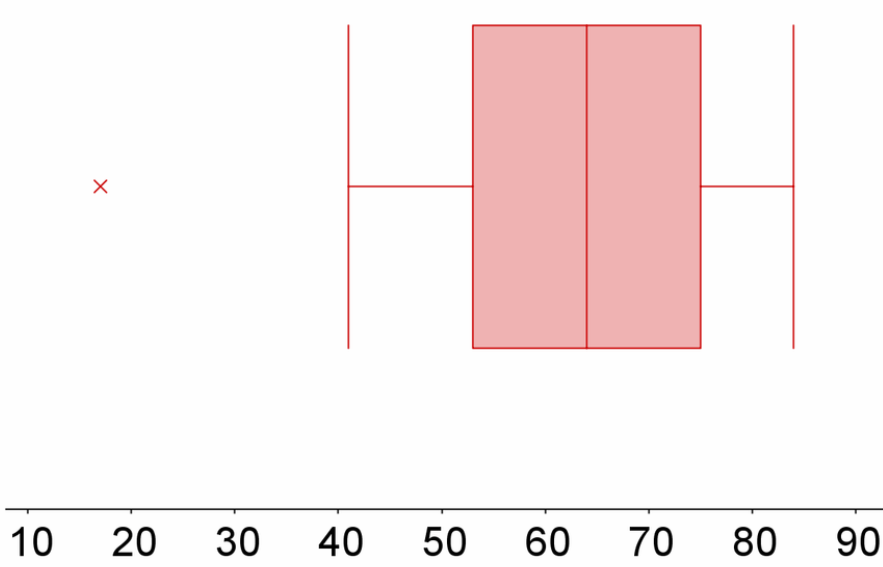
For doing so, we will refer to the fact that the boxplot’s whiskers are at their smallest and largest values (not including the outliers).
The boxplot’s whiskers are at their smallest and largest values (not including the outliers). The box has a vertical line at the median and starts at the first quartile and finishes at the third quartile.
The first quartile accounts for25% of the sorted data list, the median for50%, and the third quartile for75%.
An outlier is denoted by the letter “X”.
The modified boxplot is

Page 237 Exercise 17 Answer
Given: Stem-and-leaf plot of data is provided.
To find The total frequency.
Count how many leaves there are in the plot. i.e. the number of entries on the right side of the vertical line. So, the total frequency is 18.
The total frequency is 18.
Cengage Financial Algebra 1st Edition Chapter 5 Exercise 5.3 Automobile Ownership Page 237 Exercise 18 Answer
Given: Stem-and-leaf plot of data is provided.To find: The number of people with monthly payments between$210 and $219.
There is no element behind21 in the stem-and-leaf plot, indicating that there are no elements between$210 and $219.
Zero. None of the people had monthly payments between$210 and $219.
Cengage Financial Algebra Automobile Ownership Exercise 5.3 Solutions
Page 237 Exercise 19 Answer
Given: Stem-and-leaf plot of data is provided.
To find The mode monthly payment.
A value that appears the most in a data collection is known as the mode.226 occurs three times in this example, and no other element appears as frequently.
The mode monthly payment is 226.
Page 237 Exercise 20 Answer
Given: A stem-and-leaf plot of data is provided.
To find The median monthly payment.
The median is the sorted dataset’s middle element.
The median is the sorted dataset’s middle element.
Because there are18 items in the collection, the median is the average of the ninth and tenth elements.
$187+$192/2
=$189.50.
The median monthly payment is$189.50.
Page 237 Exercise 21 Answer
Given: Frequency table of a data set is provided.
To find The mean of the given data.
For doing so, we will usemean=price×frequency/total frequency
We know thatmean=price×frequency/total frequency
So, Mean =xy+5w+64+18v/9+y+v
Therefore, Mean =xy+5w+64+18v/9+y+v.