
Cengage Financial Algebra 1st Edition Chapter 1 Exercise 1.4 The Stock Market
Page 25 Problem 1 Answer
Given: The closing prices $28,$31,$37,$38, and $35
To find: 3-day SMA using subtraction and addition method
Solution: Find the average of the first three days Then using that average and using subtraction and addition find the next moving average.
Calculate average closing prices of days 1−3
28+31+37/3 =32
Use subtraction and addition to determine the averages for days 2−4
32−28/3+38/3
=32−9.33+12.67=35.34
Similarly, average for days3−5
35.34−31/3+35/3
=35.34−10.33+11.67/3
Read and Learn More Cengage Financial Algebra 1st Edition Answers
day SMA for the closing prices $28,$31,$37,$38,and $35 are $32,$35.34,$36.68
Page 26 Problem 2 Answer
Given: Spreadsheet showing closing prices
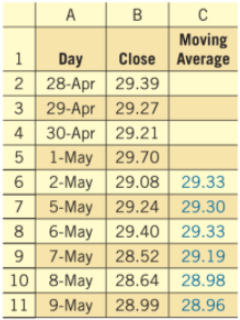
To find:
If we add column D to the spreadsheet to calculate the 3-day SMA., then the cell with which we will start and the formula we will use
Solution: We will write the first formula in row D4
We will use the formula of arithmetic mean. The formula in spreadsheet format will be=sum(B2:B4)/3
For the given spreadsheet, to find the 3-day SMA in column D
we will start the formula from the cel lD 4The formula will be=sum(B2:B4)/3
Cengage Financial Algebra 1st Edition Chapter 1 Exercise 1.4 The Stock Market Solutions
Cengage Financial Algebra 1st Edition Chapter 1 Exercise 1.4 The Stock Market Page 26 Problem 3 Answer
Crossovers signal that a stock trend reversal might be near. Some say an investor should consider buying when the fast-moving average graph overtakes (rises above) the slow-moving average graph.
Likewise, an investor might consider selling when the fast-moving average graph crosses below the slow-moving average graph.
In the given scenario on the 35th trading day, the 21-day SMA graph rises above the 7-day graph.
This means that the slow-moving average graph overtakes the fast-moving average graph, so the investor should consider selling.
If on the 35th trading day, the 21-day SMA graph rises above the 7-day graph, the slow-moving graph has overtaken the fast-moving graph, so the buyer might consider selling the stock.
Page 27 Problem 4 Answer
Given ;

To find : Why might the author be warning readers to be cautious of averages? How might these words apply to what you have learned?
Here the author want to say that if you borrow money, then this will cause you sorrow.
This means that borrowing money isn’t free and that in order to borrow the money, you will have pay some costs (the interest) in return for the borrowing of the money.
Moreover, in the long run, you will thus have to return the borrowed money plus some additional costs (the interest) and thus in the long run, borrowing money will cost you money.
Hence the author want to convey that in the long run, borrowing money will cost you money.
borrowing money isn’t free
Page 27 Problem 5 Answer
Given: The ten consecutive day closing prices for WalMart Stores Inc are$57.35,$58.61,$57.98,$58.07,$57.50,$56.97,$56.35,$56.83,$57.16,$57.18
To find: The 4-day SMA
Solution: We will find an average of the prices for each of the 4-day time spans: days 1−4, days2−5, days3−6, days4−7, days5−8, days6−9 and days 7−10
We will find the average of the closing prices in groups of four Days
1−4=57.35+58.61+57.98+58.07/4
=232.01/4
=58.00
Days2−5
=58.61+57.98+58.07+57.50/4
=232.16/4
=58.04
Days3−6
=57.98+58.07+57.50+56.97/4
=230.52/4
=57.63
Days 4−7
=58.07+57.50+56.97+56.35/4
=228.89/4
=57.22
Days 5−8
=57.50+56.97+56.35+56.83/4
=227.65/4
=56.91
Days 6−9
=56.97+56.35+56.83+57.16/4
=227.31/4
=56.83
Days7−10
=56.35+56.83+57.16+57.18/4
=227.52/4
=56.88
The 4-day SMA for the given ten consecutive day closing prices for WalMart Stores Inc are$58.00,$58.04,$57.63$57.22,$56.91,$56.83,$56.88
Cengage Financial Algebra Chapter 1 Exercise 1.4 Stock Market Answers
Cengage Financial Algebra 1st Edition Chapter 1 Exercise 1.4 The Stock Market Page 27 Problem 6 Answer
Given: The ten consecutive day closing prices for Procter & Gamble Co are$66.21,$65.90,$67.05,$67.03,$66.80,$66.65,$66.65,$65.80,$65.92,$65.21
To find: The 3-day SMA
Solution: We will use the Subtraction and Addition method to find the SMA
Find the average of closing prices in the groups of three
Days1−3=66.21+65.90+67.05/3=66.39
Days2−4=66.39−66.21/3+67.03/3=66.66
Days3−5=66.66−65.90/3+66.80/3 =66.96
Days4−6=66.96−67.05/3+66.65/3=66.83
Days5−7=66.83−67.03/3+66.65/3=66.70
Days6−8=66.70−66.80/3+65.80/3=66.37
Days7−9=66.37−66.65/3+65.92/3=66.12
Days8−10=66.12−66.65/3+65.21/3=65.64
The 3-day SMA for the given ten consecutive day closing prices for Procter & Gamble Co are $66.39,$66.66,$66.96,$66.83,$66.70,$66.37,$66.12,$65.64
Page 27 Problem 7 Answer
Given: The ten consecutive trading day closing prices for International Business Machines Corp are$121.69,$122.85,$120.70,$123.61,$123.18,$122.03,$122.82,$124.14,$124.92,$124.06
To find: The 4-day SMA
Solution: We will use the subtraction and addition method to find SMA
We will find the moving average in the group of four.
Days1−4=121.69+122.85+120.70+123.61/4=122.21
Days2−5=122.21−121.69/4+123.18/4 =122.58
Days3−6=122.58−122.85/4+122.03/4=122.38
Days4−7=122.38−120.70/4+122.82/4=122.91
Days5−8=122.91−123.61/4+124.14/4=123.04
Days6−9=123.04−123.18/4+124.92/4=123.48
Days7−10=123.48−122.03/4+124.06/4=123.99
The 4-day SMA for the given ten consecutive trading day closing prices for International Business Machines Corp are$122.21,$122.58,$122.38,$122.91,$123.04,$123.48,$123.99
Page 27 Problem 8 Answer
Given: The ten consecutive trading day closing prices for Rite Aid Corp are$2.65,$2.63,$2.70,$2.63,$2.50,$2.65,$2.66,$2.56,$2.52,$2.37
To find: The 6-day SMA
Solution: We will use subtraction and addition method to find the SMA
We will find the moving averages in the group of six
Days1−6=2.65+2.63+2.70+2.63+2.50+2.65/6=2.63
Days2−7=2.63−2.65/6+2.66/6=2.63
Days3−8=2.63−2.63/6+2.56/6=2.62
Days4−9=2.62−2.70/6+2.52/6=2.59
Days5−10=2.59−2.63/6+2.37/6=2.54
The 6-day SMA for the ten consecutive trading day closing prices for Rite Aid Corp are$2.63,$2.63,$2.62,$2.59,$2.54
Page 28 Problem 9 Answer
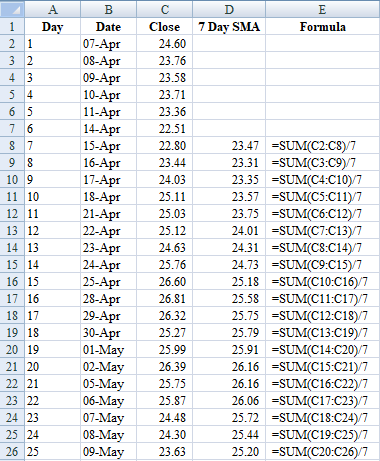
Given: The closing prices for Citigroup Inc are:
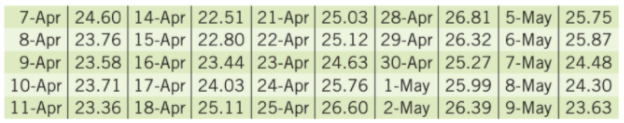
To find: The 7-day SMA
Solution: We will rite the data given in a spreadsheet.
Then use the formula for finding SMA from the seventh day.
The 7 day SMA for Citigroup Inc using excel are:

The7 -day SMA for Citigroup Inc for the given data using spreadsheet are:
Cengage Financial Algebra 1st Edition Chapter 1 Exercise 1.4 The Stock Market Page 28 Problem 10 Answer
Given: The closing prices for Dell Inc:

To find: The 10-day SMA
Solution: We will write the data in a spreadsheet Then find SMA by writing formula from tenth day onwards
10-Day SMA for Dell Inc using spreadsheet:

The10 -day SMA for the given data for Dell Inc using a spreadsheet are:

Solutions For Cengage Financial Algebra Chapter 1 Exercise 1.4 The Stock Market
Page 28 Problem 11 Answer
Given: Closing prices
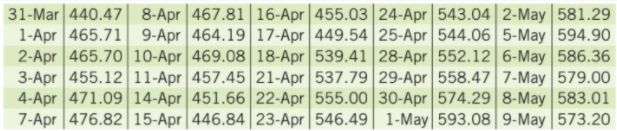
To find: 2-day, 3-day and 5-day
Solution: We will write the data in a spreadsheet then use average formula to find the required moving averages
The 2 day,3 day and 5 day SMA are:
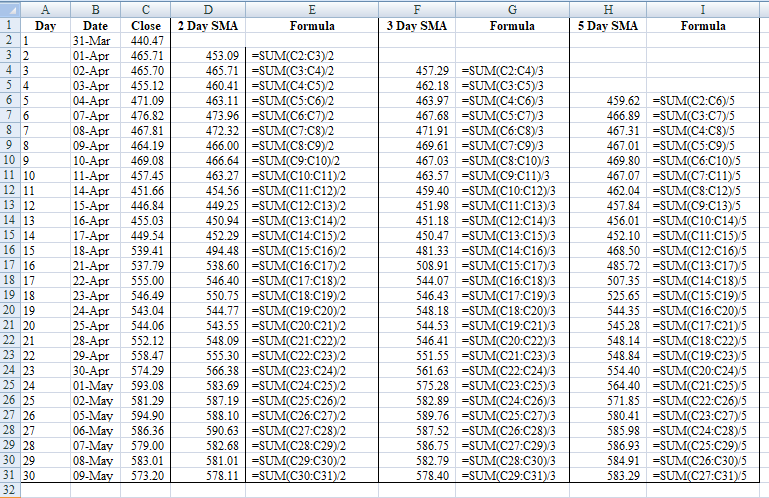
For the given closing prices, the 2 day,3 day and 5 day SMA using a spreadsheet are:

Cengage Financial Algebra 1st Edition Chapter 1 Exercise 1.4 The Stock Market Page 28 Problem 12 Answer
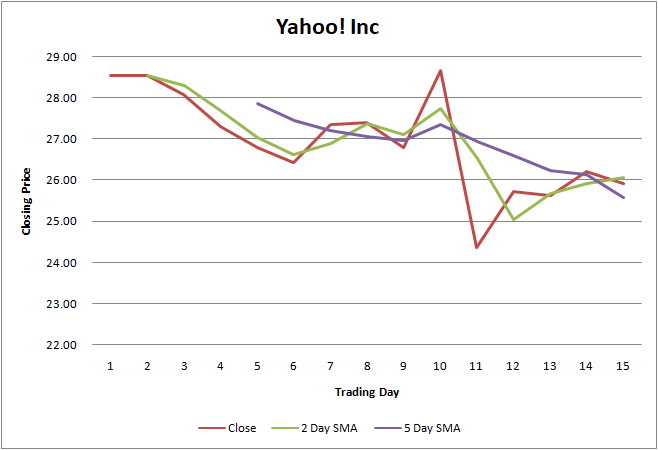
Given: The closing prices for ten consecutive of Yahoo! Inc are:
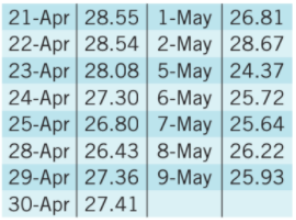
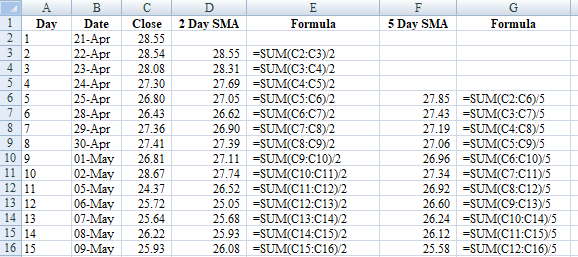
To find The 2 -day and 5 -day SMA using a spread sheet Graph the closing prices and averages.
The2−day and 5−day SMA are:

The graph showing the closing prices and the average is:

For the given closing prices of Yahoo Inc, The 2−days and 5−days SMA are:
The graph showing the closing price and averages is :
Cengage Financial Algebra Exercise 1.4 The Stock Market Key
Chapter 1 Solving Linear Equations
- Cengage Financial Algebra 1st Edition Chapter 1 Assessment The Stock Market
- Cengage Financial Algebra 1st Edition Chapter 1 Exercise 1.1 The Stock Market
- Cengage Financial Algebra 1st Edition Chapter 1 Exercise 1.2 The Stock Market
- Cengage Financial Algebra 1st Edition Chapter 1 Exercise 1.3 The Stock Market
- Cengage Financial Algebra 1st Edition Chapter 1 Exercise 1.5 The Stock Market
- Cengage Financial Algebra 1st Edition Chapter 1 Exercise 1.6 The Stock Market
- Cengage Financial Algebra 1st Edition Chapter 1 Exercise 1.7 The Stock Market
- Cengage Financial Algebra 1st Edition Chapter 1 Exercise 1.8 The Stock Market
- Cengage Financial Algebra 1st Edition Chapter 1 Exercise 1.9 The Stock Market