
Cengage Financial Algebra 1st Edition Chapter 1 Exercise 1.3 The Stock Market
Page 18 Problem 1 Answer
Given: The stock bar chart below presents trading information for the week of April 28 for Ford Motor Company.

To find: Using the stock bar to write a brief financial story of the trading action that occurred for Ford Motor Company on April 28 and April 29
Solution: We will describe for both days:
Opening price Closing price Daily High Daily Low
For April28,Opening price=$8.15
Closing price=$8.21
Daily High=$8.42
Daily Low=$8.10
Read and Learn More Cengage Financial Algebra 1st Edition Answers
For April29,
Opening price=$8.23
Closing price =$8.12
Daily High=$8.37
Daily Low=$8.07
For Ford Motor Company, On April 28, one share opened at$8.15. During the day, the shares reached a high of approximately $8.42 per share and a low of$8.10 per share.
Ford closed at approximately $8.21 per share.
On April 29, one share opened at approximately $8.23.
During the day, the shares reached a high of approximately$8.37 per share and a low of $8.07 per share. Ford closed at approximately $8.12 per share on that date.
The stock bar chart consists of two graphs. The top portion shows daily information about the day’s high, low, open, and close prices.
The bottom portion shows the daily volume for that stock. So, If trading is suspended, there are no prices to chart and no volume to report.
If trading is suspended, there are no prices to chart and no volume to report.
So, the chart could either show a blank space on that trading day, or a horizontal line (bar with no height) for each portion of the chart.
Cengage Financial Algebra 1st Edition Chapter 1 Exercise 1.3 The Stock Market Solutions
Cengage Financial Algebra 1st Edition Chapter 1 Exercise 1.3 The Stock Market Page 19 Problem 3 Answer
For a green candlestick that is shown as only a rectangle with no lines at the top or bottom, we can make two interpretations:
As the body is green we can say that the closing price is greater than the opening price.
The verticle lines show the highest and lowest price during the day.
But as there are no lines we can say that the closing price is the highest price and the opening price is the lowest price of the day.
As it’s a green candlestick we can say that the close was higher than the open.
No lines at the top or bottom in the graph indicate that the closing price was the highest for the day and the opening price was the lowest for the day.
Page 19 Problem 4 Answer
To find: The relation between the trading prices on September 8 and 11 as the lengths of the candlesticks on both of those days are approximately the same
Solution: As the length of the candlestick is the same, it will mean that the difference between the highest price and lowest price for both these days are approximately the same.
The lengths of the candlesticks for September 8 and 11 are approximately the same.
This means that the differences between each day’s high price and low price for both the days are equivalent.
Page 20 Problem 5 Answer
Peter Lynch has said, “Although it’s easy to forget sometimes, a share is not a lottery ticket . . . it’s part-ownership of a business.
“He means that investing in the share market is not similar to buying a lottery ticket.
It is not a mere source of earning income, it also gives us ownership of the corporation whose shares we purchase.
In a lottery ticket, you only have one chance of winning or losing, but in shares, you may sometimes get a return sometimes you may not, but it is not a one time event.
The value of shares continuously keeps on changing and it also makes us a member of the organization which has its own perks.
The writer Peter Lynch indicates that playing the market is not a game. It is not a quick way to make money like a lottery.
Rather, it is a way to invest in a corporation by becoming a part owner of the business.
Cengage Financial Algebra 1st Edition Chapter 1 Exercise 1.3 The Stock Market Page 20 Problem 6 Answer
Peter Lynch has said, “Although it’s easy to forget sometimes, a share is not a lottery ticket . . . it’s part-ownership of a business.
“He means that investing in the share market is not similar to buying a lottery ticket.
It is not a mere source of earning income, it also gives us ownership of the corporation whose shares we purchase.
In a lottery ticket, you only have one chance of winning or losing, but in shares, you may sometimes get a return sometimes you may not, but it is not a one time event.
The value of shares continuously keeps on changing and it also makes us a member of the organization which has its own perks.
The writer Peter Lynch indicates that playing the market is not a game. It is not a quick way to make money like a lottery.
Rather, it is a way to invest in a corporation by becoming a part owner of the business.
Page 20 Problem 7 Answer
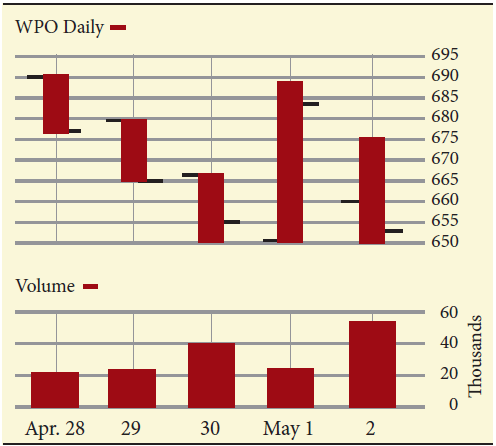
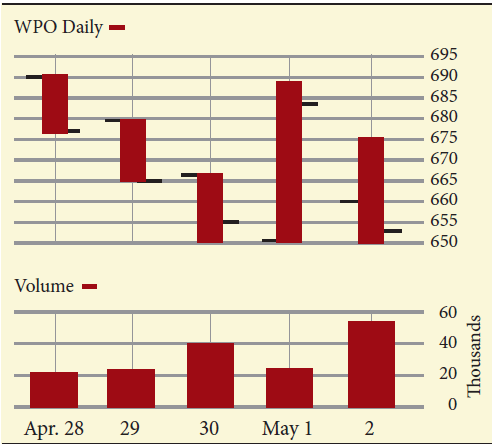
Given: Stock bar chart depicting the market action for The Washington Post Company during the week of April 28
To find: The day’s opening price on the following days:
April28
April29
April30
May1
May2
Solution: The line segment on the left of the bar shows the opening price. So, the approximate opening price on the given days are:
April28=690
April29=679
April30=667
May1=651
May2=660
For The Washington Post Company, the approximate opening prices are:
April 28=690
April 29=679
April 30=667
May 1=651
May 2=660
Cengage Financial Algebra Chapter 1 Exercise 1.3 Stock Market Answers
Cengage Financial Algebra 1st Edition Chapter 1 Exercise 1.3 The Stock Market Page 20 Problem 8 Answer
Given: The stock bar chart depicting the market action for The Washington Post Company during the week of April 28

To find: The day’s high price on April 29
Solution: From the graph, we can see that the bar on April 30 has the top line at 680.
So, the day’s high price is 680
For The Washington Post Company, the day’s high price on April 29 is 680.
Page 20 Problem 9 Answer
Given: The stock bar chart depicting the market action for The Washington Post Company during the week of April 28
To find: The day’s low price on May 1
Solution: From the graph, we can see that the bar on May 1 has the lower value of 650
Thus, day’s low price is 650
For The Washington Post Company the day’s low price on May 1 is 650.
Page 20 Problem 10 Answer
Given: From the graph given for The Washington Post Company,
Close on April29=$665
Close on April30=$655
To find : The net change in amount and percentage.
Solution: We will use the following formulas:
Net change (in amount)= Close on April30−Close on April29
Net change (in percent)=Change (in amount)
Close on April 29×100
Net change (in amount)=655−665
=−$10
Net change (in percent)=−10/665×100
=−1.5%
For The Washington Post Company the approximate net change from April 29 to April 30 is−$10 or we can say−1.5%
Solutions For Cengage Financial Algebra Chapter 1 Exercise 1.3 The Stock Market
Cengage Financial Algebra 1st Edition Chapter 1 Exercise 1.3 The Stock Market Page 21 Exercise 1 Answer
Given: The stock bar chart depicting the market action for The Washington Post Company during the week of April 28.

To find: The approximate number of shares that were traded on April 30
Solution: We can see from the bottom part of the graph that the volume that is shown on April 30 Is 40,000 shares.
For The Washington Post Company, approximately 40,000 shares were traded on April 30
Page 21 Exercise 2 Answer
Given: For The Washington Post Company, Volume on April28=20,000
Volume on May2=52,000
To find: The approximate number of shares that were traded less on April 28 than on May 2
Solution: Number of shares traded less=52,000−20,000
=32,000
For The Washington Post Company, approximately 32,000 shares were traded on April 28 than on May 2
Page 21 Exercise 3 Answer
Given: For The Washington Post Company, the volume of trading is given in thousands as0,20,40,60
To find: The volume numbers if they had been listed in hundreds on the table
Solution: The graph labels if the volume numbers are mentioned in hundreds are 0,200,400,600
For the graph given of The Washington Post Company, suppose that the volume numbers had been listed in hundreds on the table, the labels would be0,200,400,600
Page 21 Exercise 4 Answer
Given ;

To find: Use the following data to construct a stock bar chart for the 5-day period
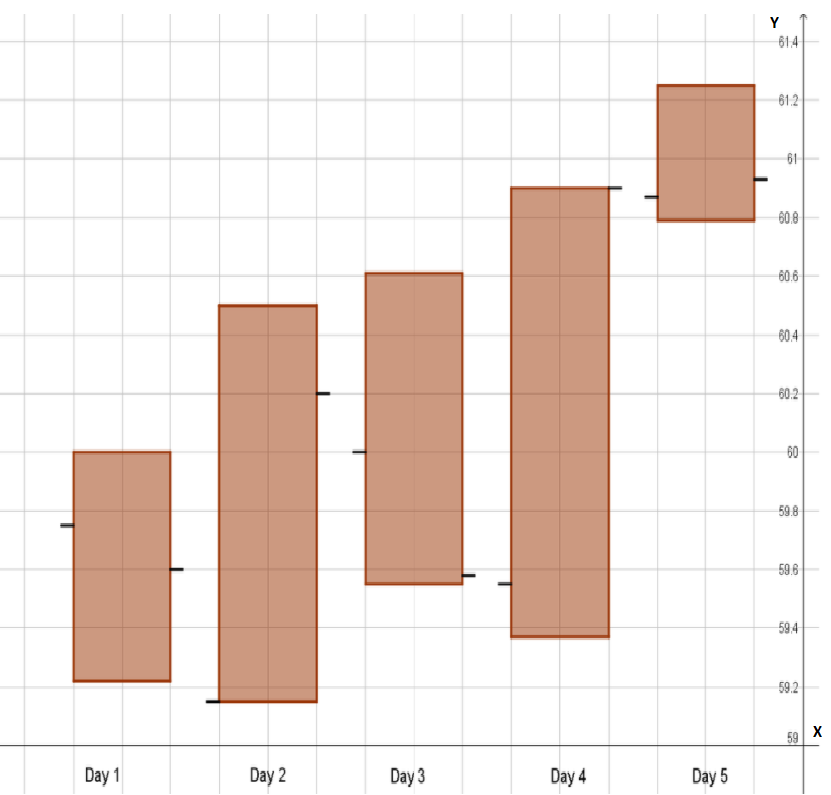
The top of the bar needs to lie at the “High”-value.
The bottom of the bar needs to lie at the “Low”-value.
The bars should have an equal width.
Draw a vertical black line to the left of the bar at a height of the “Open”-value
Draw a vertical black line to the right of the bar at a height of the “Close”-value

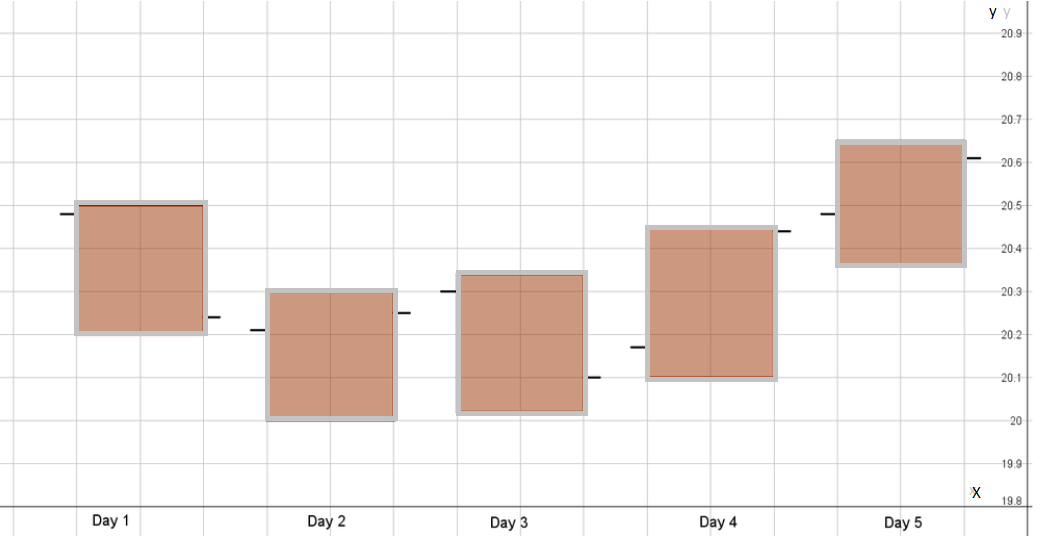
Hence we conclude that WPO Daily
The top of the bar needs to lie at the “High”-value.
The bottom of the bar needs to lie at the “Low”-value.
The bars should have an equal width.
Draw a vertical black line to the left of the bar at a height of the “Open”-value
Draw a vertical black line to the right of the bar at a height of the “Close”-value
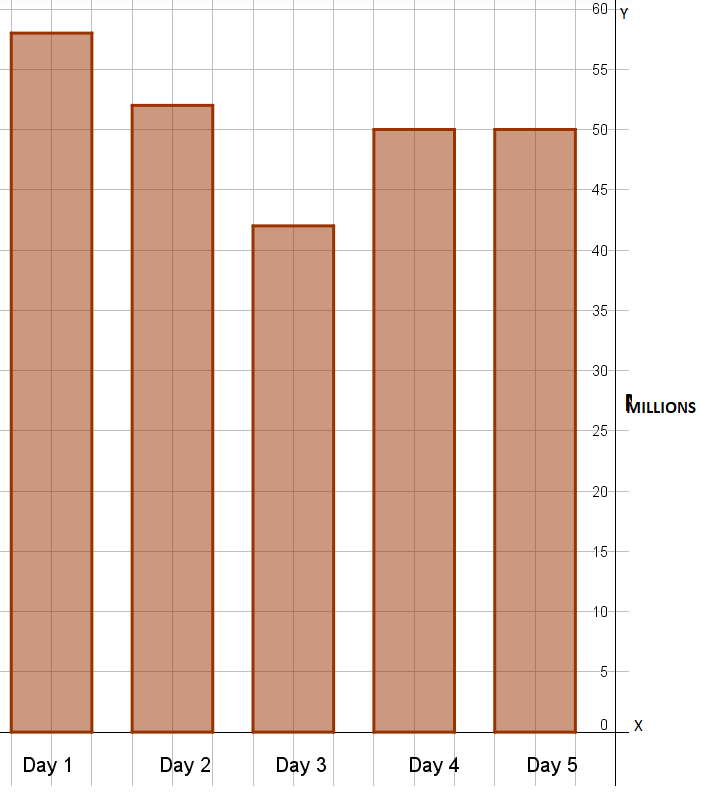
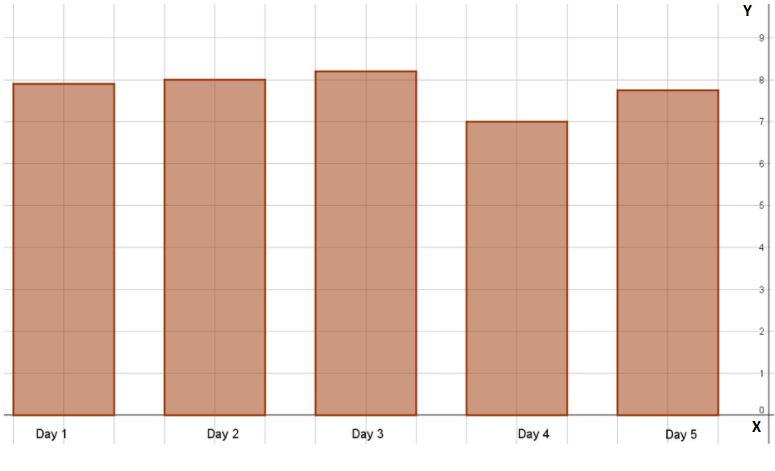
Volume
The bottom of the bars need to be at 0 and the bars need to have an equal width.
The top of the bars need to lie at the volume (in millions).
Cengage Financial Algebra Exercise 1.3 The Stock Market Key
Page 21 Exercise 5 Answer
Given ;
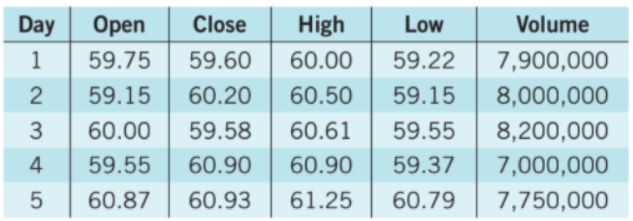
To find: Use the following data to construct a stock bar chart for the 5−day period.
The top of the bar needs to lie at the “High”-value.
The bottom of the bar needs to lie at the “Low”-value.
The bars should have an equal width.
Draw a vertical black line to the left of the bar at a height of the “Open”-value
Draw a vertical black line to the right of the bar at a height of the “Close”-value
Hence we conclude that The top of the bar needs to lie at the “High”-value.
The bottom of the bar needs to lie at the “Low”-value.
The bars should have an equal width.
Draw a vertical black line to the left of the bar at a height of the “Open”-value
Draw a vertical black line to the right of the bar at a height of the “Close”-value Volume
The bottom of the bars need to be at 0 and the bars need to have an equal width.
The top of the bars need to lie at the volume (in millions).

Chapter 1 Solving Linear Equations
- Cengage Financial Algebra 1st Edition Chapter 1 Assessment The Stock Market
- Cengage Financial Algebra 1st Edition Chapter 1 Exercise 1.1 The Stock Market
- Cengage Financial Algebra 1st Edition Chapter 1 Exercise 1.2 The Stock Market
- Cengage Financial Algebra 1st Edition Chapter 1 Exercise 1.4 The Stock Market
- Cengage Financial Algebra 1st Edition Chapter 1 Exercise 1.5 The Stock Market
- Cengage Financial Algebra 1st Edition Chapter 1 Exercise 1.6 The Stock Market
- Cengage Financial Algebra 1st Edition Chapter 1 Exercise 1.7 The Stock Market
- Cengage Financial Algebra 1st Edition Chapter 1 Exercise 1.8 The Stock Market
- Cengage Financial Algebra 1st Edition Chapter 1 Exercise 1.9 The Stock Market