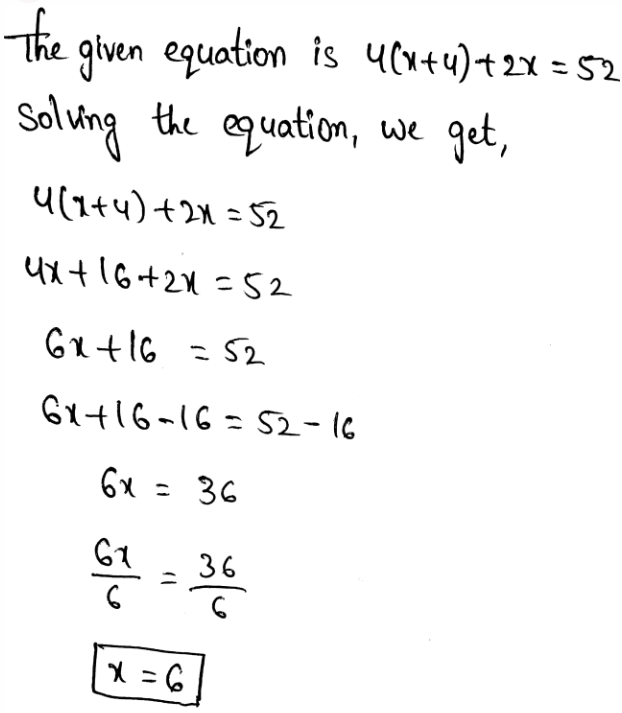
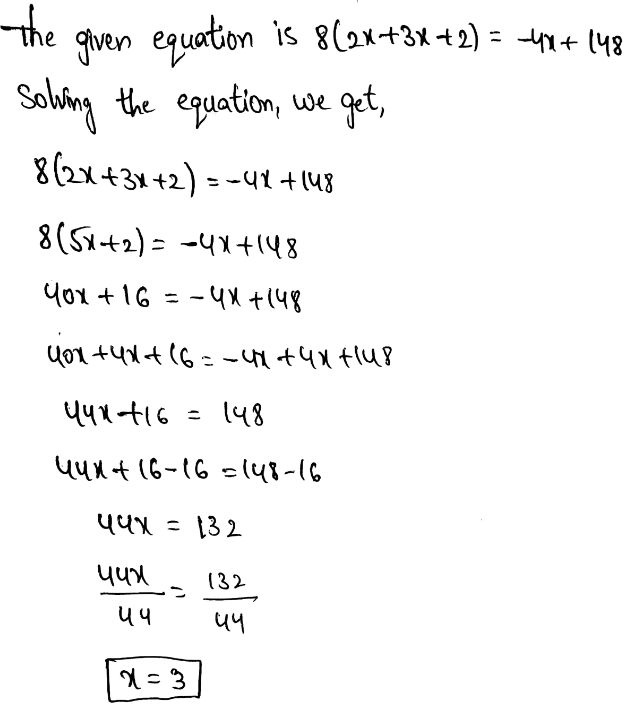
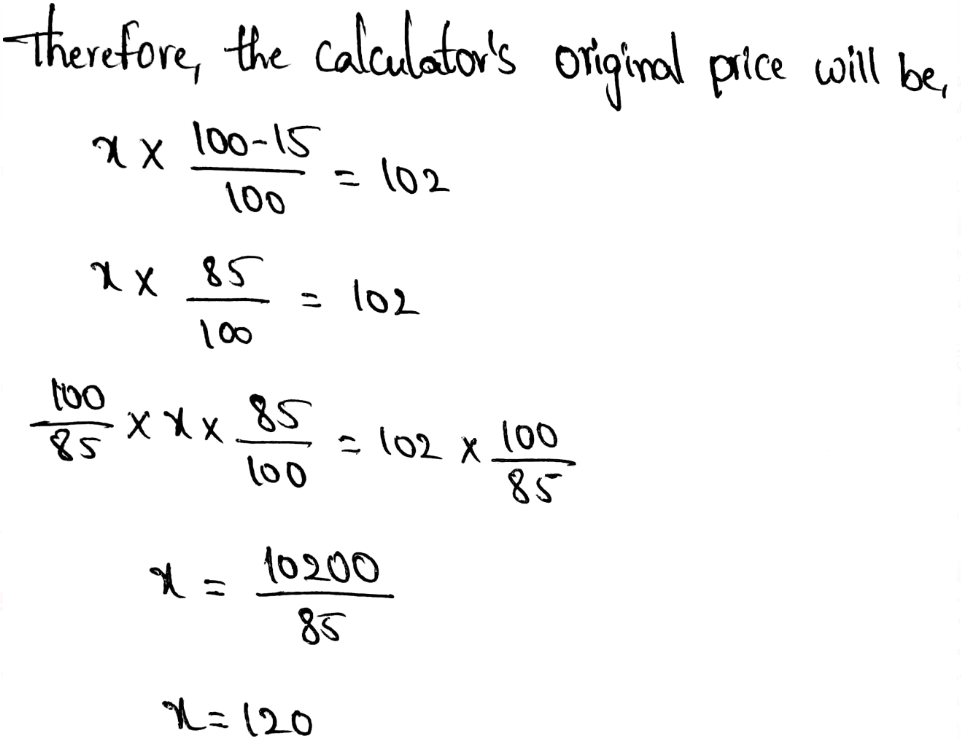
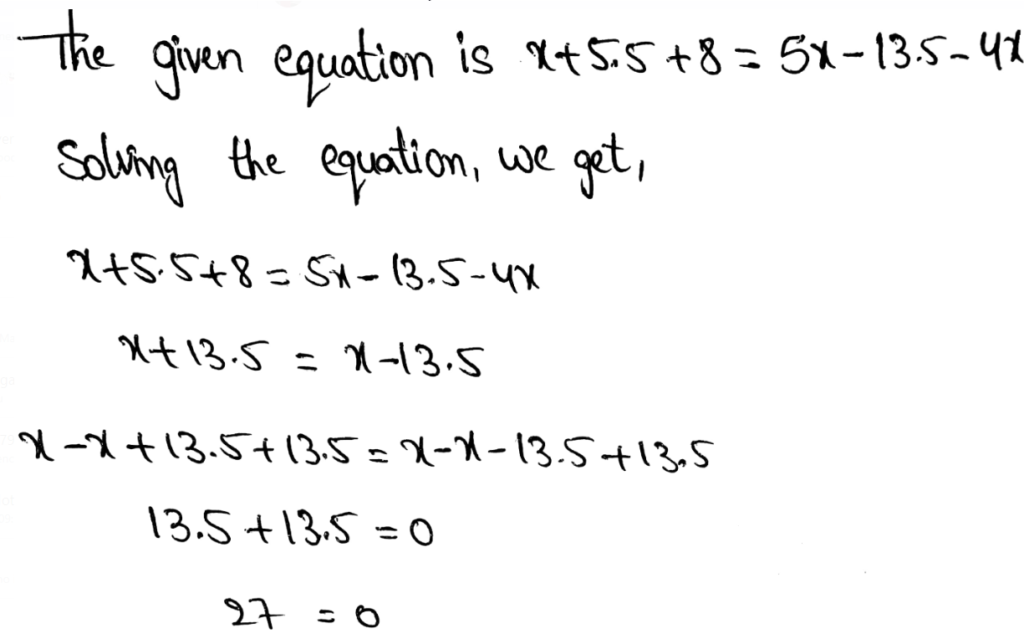
Envision Math Grade 8 Volume 1 Student Edition Solutions Chapter 3 Use Functions To Model Relationships Topic 3 Review Essential Question

Envision Math Grade 8 Volume 1 Student Edition Solutions Chapter 3 Use Functions To Model Relationships Topic 3 Review Essential Question

Page 201 Question 1 Answer

We have to explain how we can use functions to model linear relationships.

To use functions to model linear relationships, we need to use linear functions.

The graph of those functions will be in the form of a straight line.

We can write the equation in the form of slope-intercept form such as y = mx + b

where m is the slope, b is the initial value of the dependent variable, x is the input and y is the output.

We can determine these values from the given values or from the given description of the relationship.

We need to construct a linear function to model linear relationships between any two quantities.

Envision Math Grade 8 Volume 1 Chapter 3 Topic 3 Review Essential Question

Page 201 Exercise 1 Answer

A function whose graph is not a straight line is a nonlinear function.

Nonlinear functions have a slope that varies between points.

A function whose graph is not a straight line is a nonlinear function.
Envision Math Grade 8 Volume 1 Student Edition Solutions Chapter 3 Use Functions To Model Relationships Topic 3 Review Essential Questions

Page 201 Exercise 2 Answer

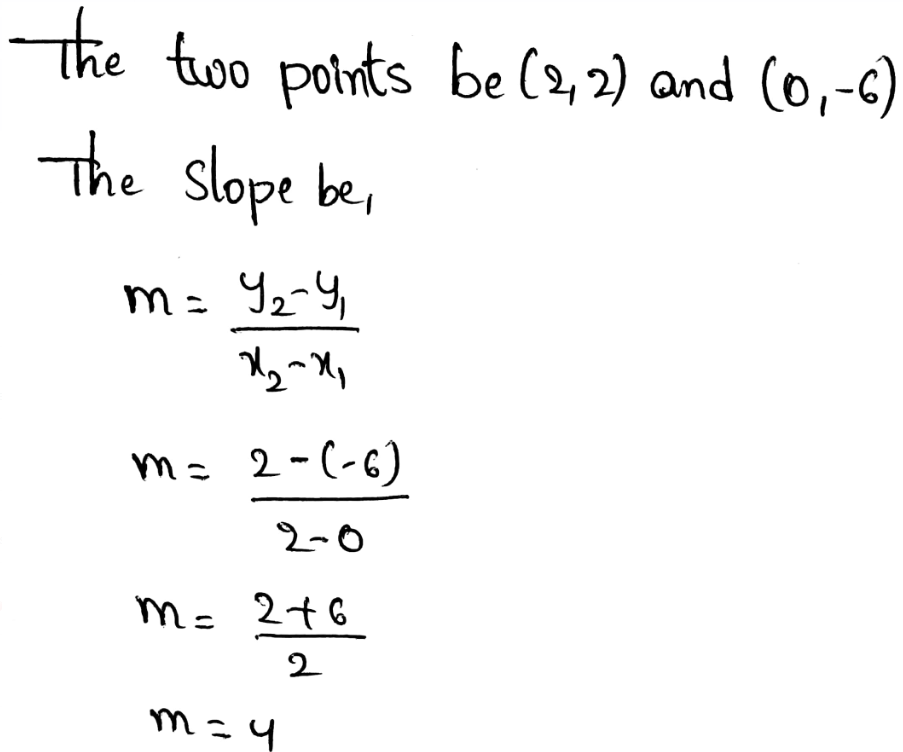
m = \(\frac{y_2-y_1}{x_2-x_1}\)

Where m is the slope of the line

The slope of a line is also called a constant rate of change.

The slope of a line is also called a constant rate of change.


Envision Math Grade 8 Volume 1 Student Edition Solutions Chapter 3 Use Functions To Model Relationships Topic 3 Review Essential Question Page 201 Exercise 3 Answer

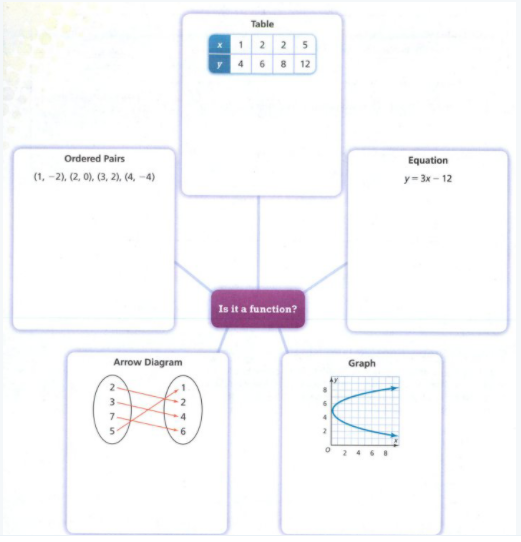
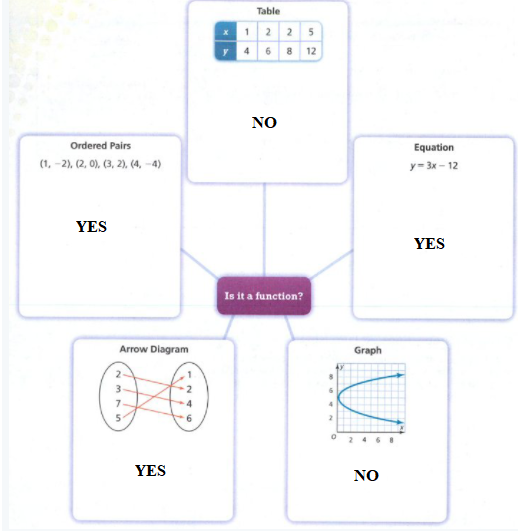
A relation in which each input has exactly one output is a function.

A relation in which each input has exactly one output is a function.


Page 201 Exercise 4 Answer

The value of the output when the input is 0, or the y-intercept of the graph line is called a initial value.

It is the y-value of the point at which the line crosses the y-axis.

The value of the output when the input is 0, or the y-intercept of the graph line is called a initial value.

Envision Math Grade 8 Topic 3 Functions Review Essential Question

Page 201 Exercise 5 Answer

A period of time between two points of time or events is called an interval.

An open interval does not include its endpoints.

Open interval indicated with parenthesis. For example (0,2)

A closed interval include its endpoints.

A period of time between two points of time or events is called an interval.


Page 201 Exercise 1 Answer

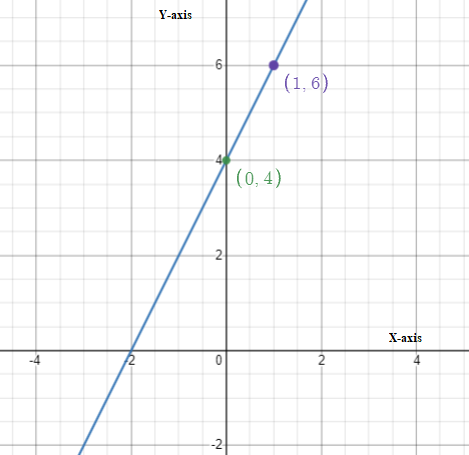
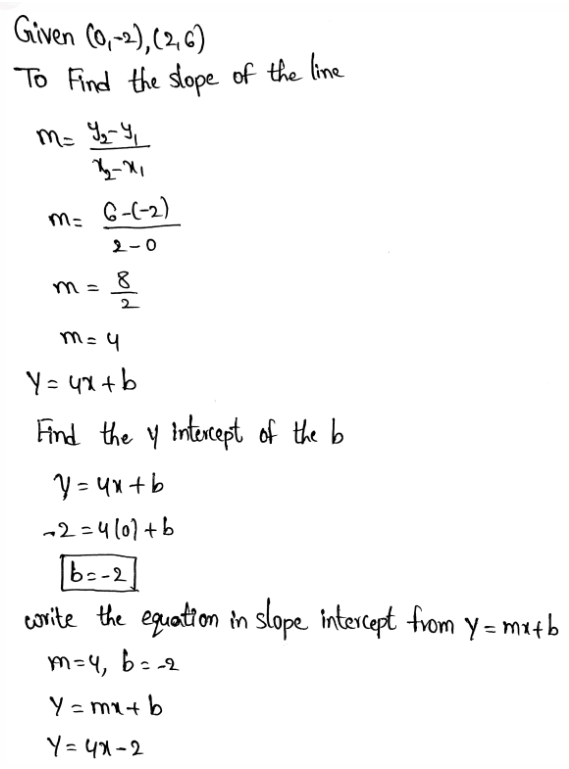
Given

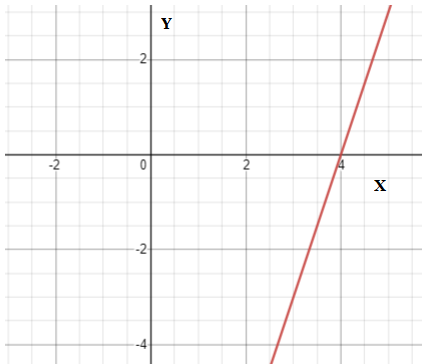
(0,−2),(2,6)
Use Functions To Model Relationships Page 201 Exercise 1 Answer
Therefore, the linear function in the slope-intercept form is y = 4x − 2


Page 202 Exercise 2 Answer

Given

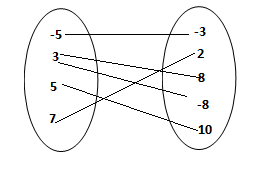
{(−5,−3),(7,2),(3,8),(3,−8),(5,10)}
Use Functions To Model Relationships Page 202 Exercise 2 Answer

Since the input 3 corresponds to outputs of -8 and 8.

The relation is not a function. Because it has an input that corresponds to more than one output.

The relation is not a function since the input 3 corresponds to more than one output.


Envision Math Grade 8 Volume 1 Student Edition Solutions Chapter 3 Use Functions To Model Relationships Topic 3 Review Essential Question Page 202 Exercise 1 Answer

If he buys one app each week that means that he spends $4.99
every week.

This means that on the right side of the equation we are going to have 4.99x

On the left side we are simply going to have y, which is the going to be the amount left on the card

We get this by adding to the right side and we have to subtract 4.99x

y = 100 − 4.99x

Hence, the equation is y = 100 − 4.99x

Essential Question Review For Functions Modeling Grade 8 Envision Math

Page 202 Exercise 2 Answer

Given:

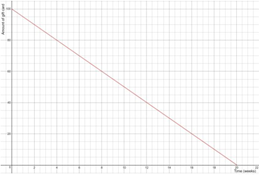
The function is y = 100 − 4.99x

The initial value is going to be 100. After that each week he spends 4.99$

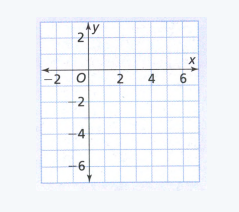
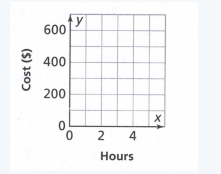
The required graph is:
Use Functions To Model Relationships Page 202 Exercise 2 Answer Image


Therefore the required graph is:

Use Functions To Model Relationships Page 202 Exercise 2 Answer Image

Envision Math Grade 8 Chapter 3 Topic 3 Solutions And Essential Question

Page 203 Exercise 1 Answer

For the function A we can see that the initial value is going to be 2.

For function B we do not see that and we must find the Initial value.

Since, we can see that the y is increasing by 2 for each increase of 1 in x that means that we get the initial value if we simply subtract 2 from the first value of y.

−1 − 2 = −3

The initial value of the function B is -3.

This means that function A has greater initial value.

Therefore the function A has greater initial value.


Page 203 Exercise 2 Answer

Given:

We can see the function A has -3x as variable which means that the rate of change is going to be -3.

For the function B we can see that the rate of change is 2 because for every change in x the y is greater by 2.

Function B has greater rate of change.

Therefore the function B has greater rate of change.

Envision Math 8th Grade Topic 3 Functions Essential Question

Envision Math Grade 8 Volume 1 Student Edition Solutions Chapter 3 Use Functions To Model Relationships Topic 3 Review Essential Question Page 203 Exercise 1 Answer

Given:

y-intercept is -0.5.

The points given are (0.5, 4.25) and (2, 18.5)

We first find the slope:
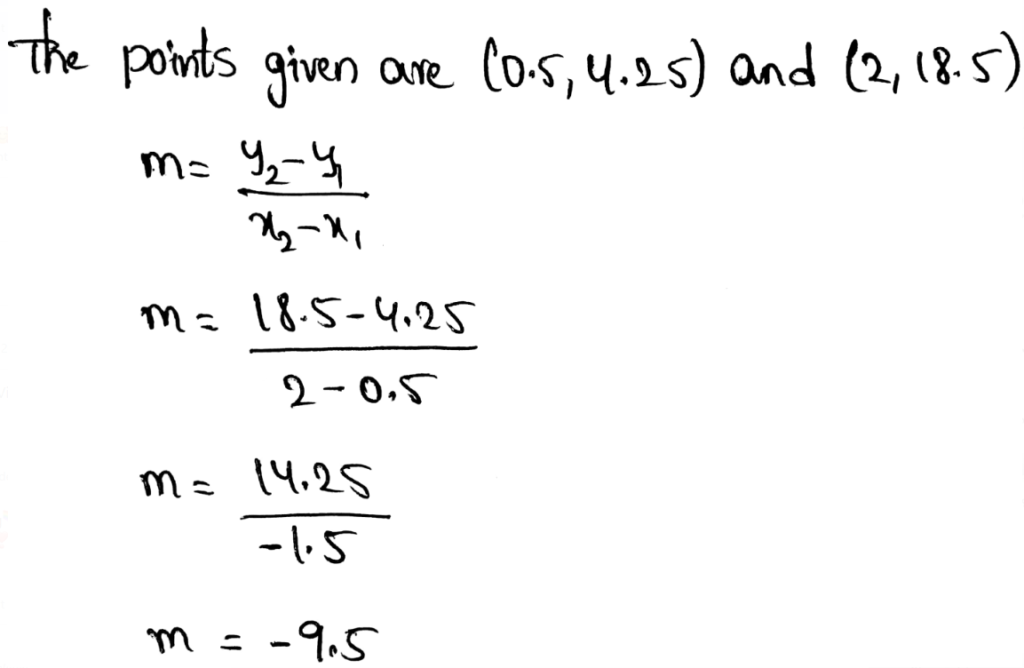
Use Functions To Model Relationships Page 203 Exercise 1 Answer


Now we write the equation of the line:

y = −9.5x − 0.5

Therefore the required equation of the line is y = −9.5x − 0.5


Page 203 Exercise 2 Answer

Given:
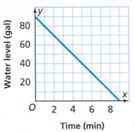
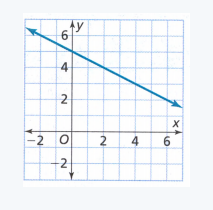
Use Functions To Model Relationships Page 203 Exercise 2 Answer

The initial value from the graph is 90.

We find the slope:

\(m=\frac{0-90}{9-0}\) \(m=\frac{-90}{9}\)

m = -10

Now we write the function:

y = −10x + 90

Therefore the required function is y = 10x + 90.


Page 204 Exercise 1 Answer

The graph of the function is a constant when the y-coordinate does not change when the x-coordinate does.

This means that the graph of the function is a constant in intervals 2, 4, 6.

Therefore the given graph is constant in the intervals 2, 4, 6.


Page 204 Exercise 2 Answer

The graph of the function is decreasing when the y-coordinates are decreasing as the x-coordinates are increasing.

The graph of the given function is decreasing in intervals 5, 7.

Therefore the given graph of the function is decreasing in intervals 5, 7.

How To Answer Essential Questions In Topic 3 Envision Math Grade 8

Envision Math Grade 8 Volume 1 Student Edition Solutions Chapter 3 Use Functions To Model Relationships Topic 3 Review Essential Question Page 204 Exercise 1 Answer

As we can see the graph is going to be a constant at first when there is maximum number of carrots. Then we are going to have a decrease until half the carrots are gone. In the last part there is simply a constant because the number of carrots is going to stay the same.
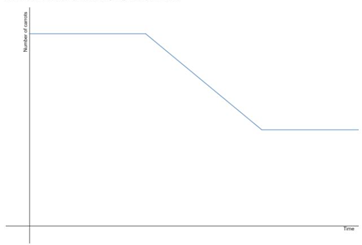
Use Functions To Model Relationships Page 204 Exercise 1 Answer

From the task we see that the graph of the function is first going to be a constant, after that it is going to decrease until half the carrots are left and in the end the graph is going to be constant.

Envision Math Grade 8 Topic 3 Review Practice Problems

Page 205 Exercise 1 Answer

We find the solution to the linear equation and then compare these solutions, choose the solution that is greater to find the letter of the row.

We consider:

3x + 8 − 8 = 12 − 8

3x = 4

x = \(\frac{4}{3}\)

5x − 4 + 4 = 5 + 4

5x = 9

x = \(\frac{9}{5}\)

As we can see \(\frac{4}{3}<\frac{9}{5}\) therefore the correct solution is N.

2n + 15 – 15 = 57 – 15

2n = 42

n = 21

3d – 7 + 7 = 53 + 7

3d = 60

d = 20

As we can see 21 > 20 therefore the correct solution is I.

We consider:

8x − 12 + 12 = 14 + 12

8x = 26

x = \(\frac{13}{4}\)

6p + 12 − 12 = 36 − 12

6p = 24

p = 4

As we can see \(\frac{13}{4}<4\) therefore the correct solution is C.

We consider:

54 − 14 = 8c + 14 − 14

8c = 40

c = 50

8m − 14 + 14 = 50 + 14

8m = 64

m = 8

As we can see 5 < 8 therefore the correct solution is E.

We consider:

12x + 16 − 16 = 100 − 16

12x = 84

x = 12

6z − 24 + 24 = 12 + 24

6z = 36

z = 6

As we can see 12 > 6 therefore the correct solution is B.

We consider:

59 + 81w − 59 = 68 − 59

81w = 9

w = \(\frac{1}{9}\)

​40r + 67 − 67 = 71 − 67

40r = 4

r = \(\frac{1}{10}\)

As we can see \(\frac{1}{9}>\frac{1}{10}\) therefore the correct solution is E.

We consider:

31g − 15 + 15 = 47 + 15

31g = 62

g = 2

99 − 22 = 22 + 35y − 22

77 = 35y

y = \(\frac{77}{35}\)

As we can see \(2<\frac{77}{35}\) therefore the correct solution is L.

We consider:

14r − 7 + 7 = 14 + 7

14r = 21

r = \(\frac{3}{2}\)

13 + 8 = 12t − 8 + 8

21 = 12t

t = \(\frac{21}{12}\)

As we can see \(\frac{3}{2}<\frac{21}{12}\) therefore the correct solution is T.

Envision Math Grade 8 Volume 1 Student Edition Solutions Chapter 3 Use Functions To Model Relationships Exercise 3.6

Envision Math Grade 8 Volume 1 Student Edition Solutions Chapter 3 Use Functions To Model Relationships Exercise 3.6

Page 195 Exercise 1 Answer

Use Functions To Model Relationships Page 195 Exercise 1 Answer

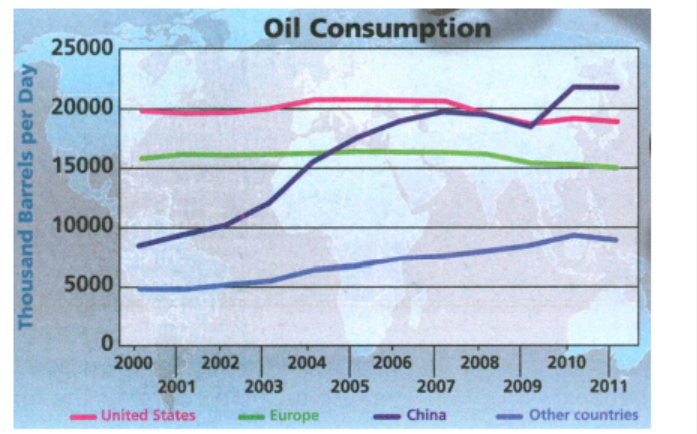
We do not agree with jack’s statement because we can see that United States has not dropped a lot. The graph that represents the United States does not have a big decrease.
We do not agree with jack.

Use Functions To Model Relationships Page 195 Exercise 1 Answer

We do agree with Ashley’s statement because this means that china’s has had a huge increase.

As we can see on the graph the line that represents china had a huge increase.

We agree with Ashley’s statement.

Envision Math Grade 8 Volume 1 Student Edition Solutions Chapter 3 Use Functions To Model Relationships Exercise 3.6

Envision Math Grade 8 Volume 1 Chapter 3 Exercise 3.6 Functions Solutions

Page 195 Exercise 1 Answer

Use Functions To Model Relationships Page 195 Exercise 1 Answer

For Europe and United States we can see that their line on the graph is decreasing by a little bit.

This means that they have dropped the oil consumption over the given time.

They have dropped the oil consumption over the given time.


Envision Math Grade 8 Volume 1 Student Edition Solutions Chapter 3 Use Functions To Model Relationships Exercise 3.6 Page 196 Question 1 Answer

If we sketch a graph of a function, than we can see the behavior of given function.

This way we do not have to read the data every time.

We can simply see the behavior on the sketch.


Page 196 Exercise 1 Answer

The input of given function is going to be the depth, because the water pressure is going to increase for each feet of the depth.

The output of given function is going to be the water pressure.

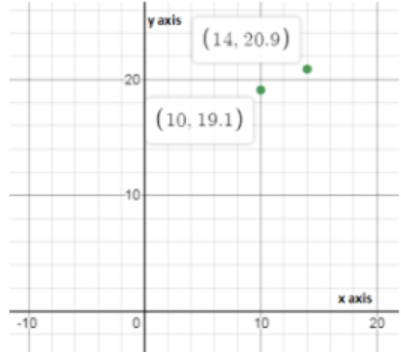
To sketch the given graph we can simply mark given points which are (10,19.1) and (14,20.9)

Use Functions To Model Relationships Page 196 Exercise 1 Answer Image 1

The depth is going to be the input and the water pressure is going to be the output of given function.


Page 196 Exercise 1 Answer

We need to explain how are the sketches of the two functions similar and different from each other.

The input of the given function is going to be the depth because the water pressure is going to increase for each foot of the depth.

The output of the given function is going to be the water pressure.

To sketch the given graph we can simply mark given points that are (10,19.1) and (14,20.9)

Use Functions To Model Relationships Page 196 Exercise 1 Answer Image 2

The unit rate is,

\(\frac{19.1}{10}=1.91\) \(\frac{20.9}{14}=1.5\)

Therefore, the water pressure decreases with the increase in depth.

The decrease is not constant.

The sketch of the time and the oxygen level of the scuba diver is,

Use Functions To Model Relationships Page 196 Exercise 1 Answer

The decrease of the oxygen level in the tank is constant since she breathes at a constant rate.

The sketches of the two functions are similar in the way that these two functions are decreasing.

They are different because the decrease in the water pressure with respect to the depth is not constant while the decrease in the oxygen level in the tank is constant.

Envision Math Grade 8 Exercise 3.6 Use Functions To Model Relationships

Envision Math Grade 8 Volume 1 Student Edition Solutions Chapter 3 Use Functions To Model Relationships Exercise 3.6 Page 198 Exercise 1 Answer

We need to explain how does the sketch of a graph of a function help describe its behavior.

If we sketch a graph of a function, then we can see the behavior of the given function.

This way we do not have to read the data every time.

We can simply see the behavior on the sketch.


Page 198 Exercise 2 Answer

We need to describe how we know which variable goes with which axis when you graph.

When we need to determine which variable will go with which axis when we graph the output will always be the variable that will change depending on the input.

The input is always the variable that is changing independently.

Input is mostly going to be the time.

The output is the variables that change depending on the input which is mostly the time.

Envision Math Exercise 3.6 Functions Detailed Answers

Page 198 Exercise 4 Answer

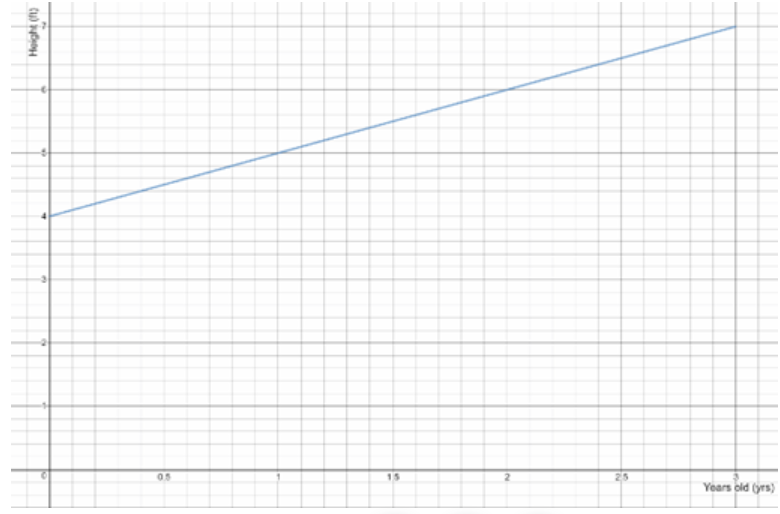
Given that, a class plants a tree. We need to sketch the graph of the height of the tree over time.

Also, we need to identify the two variables.

Use Functions To Model Relationships Page 198 Exercise 4 Answer

To sketch the graph we have to identify the variables which are the height of the tree and the other variable is the time for how long was the tree planted.

The first variable is the height of the tree and second is the time.

Given that, A class plants a tree. We need to sketch the graph of the height of the tree over time.

Also, we have to describe the relationship between the two variables.

Use Functions To Model Relationships Page 198 Exercise 4 Answer

The height of the tree is going to be the output of a given function because it depends on the time which is going to be the input of the given function.

The height is the output and the time is the input.

When time increases by 1 year, the height of the tree increases by \(\frac{7}{3}\)feet.

Given that, A class plants a tree. We need to sketch the graph of the height of the tree over time.

Since now we know that the variables are going to be the height of the tree and the time, we can simply sketch the graph.

Keep in mind that the graph is going to start at 3 ft.

Use Functions To Model Relationships Page 198 Exercise 4 Answer

The graph is

Use Functions To Model Relationships Page 198 Exercise 4 Answer

Functions And Modeling Relationships Grade 8 Exercise 3.6 Envision Math

Envision Math Grade 8 Volume 1 Student Edition Solutions Chapter 3 Use Functions To Model Relationships Exercise 3.6 Page 198 Exercise 5 Answer

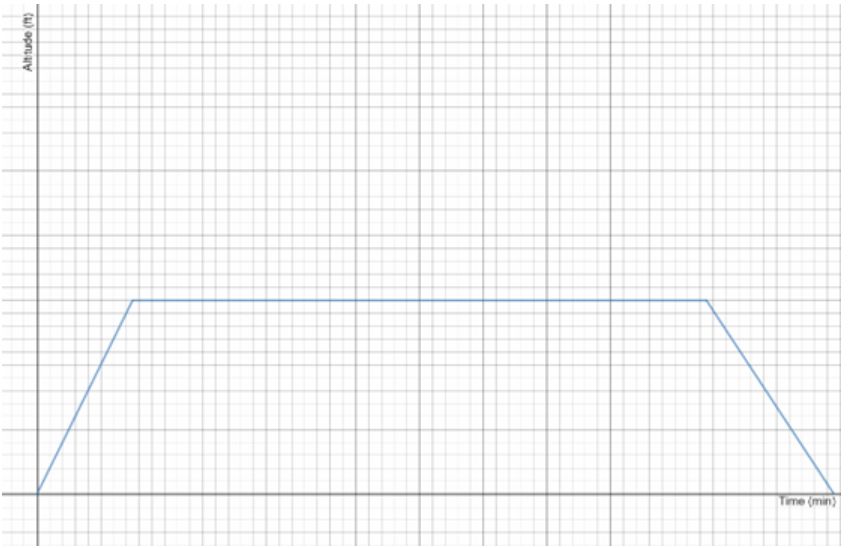
Given that, an airplane takes 15 minutes to reach its cruising altitude. The plane cruises at that altitude for 90 minutes, and then descend for 20 minutes before it lands. We need to sketch the graph of the height of the plane over time.

First we need to find the variables. Variables are the time and altitude.

We can see that it states the plane takes 15minutes to reach full altitude which means the function is going to be increasing.

If the plane is cruising that means that the plane is flying at the same altitude the same time which means that the function is going to be a constant during those 90 minutes.

In the last part when plane is descending the graph is also going to be descending.

Use Functions To Model Relationships Page 198 Exercise 5 Answer

In the first part the function is increasing, in the second it is a constant and in the last part the function is decreasing.

Use Functions To Model Relationships Page 198 Exercise 5 Answer


Page 199 Exercise 6 Answer

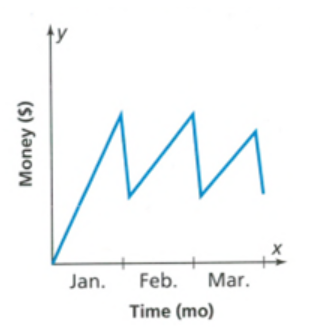
We need to determine what relationship between money (in dollars) and time (in months) does this graph shows. Also, we need to write a description of the given graph.

Use Functions To Model Relationships Page 199 Exercise 6 Answer

If we look at the graph we can see that the money is increasing from the start of January till the end of January. After that, we can a big drop in the money

If we look at the graph we can see that the money is increasing from the start of the January till the end of the January. After that we can a big drop in the money .

Envision Math Grade 8 Chapter 3 Exercise 3.6 Solutions

Envision Math Grade 8 Volume 1 Student Edition Solutions Chapter 3 Use Functions To Model Relationships Exercise 3.6 Page 199 Exercise 9 Answer

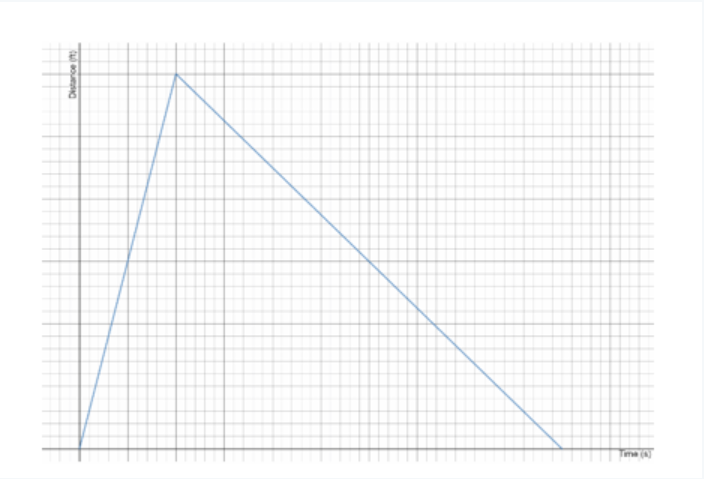
Given that, Melody starts at her house and rides her bike for 10 minutes to a friend’s house. She stays at her friend’s house for 60 minutes. We need to sketch a graph that represents this description.

From the question that we have in the task, we can see that the function is first going to increase and after that, it is going to be a constant because she will be at the same distance for 60 minutes.

After that, she goes back home and the graph is going to be decreasing

Use Functions To Model Relationships Page 199 Exercise 9 Answer

The graph is first going to increase than it is going to be constant and lastly it is going to decrease.

Use Functions To Model Relationships Page 199 Exercise 9 Answer


Page 199 Exercise 10 Answer

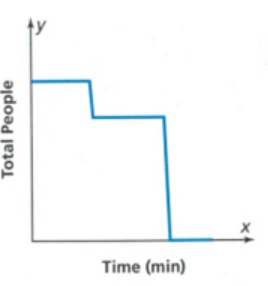
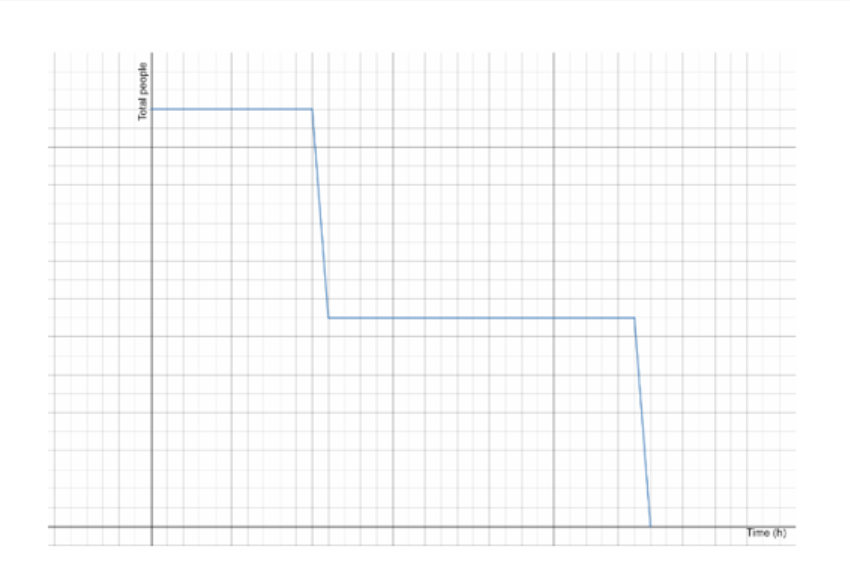
We need to find which among the below-given description best represents the graph shown.

(A) People are waiting for a train. A train comes and some people get on. The other people wait for the next train. As time goes by, people gradually leave the station.

(B) One train arrives and some people get off the train and wait in the station.

(C) People are waiting for a train. Everyone gets on the first train that comes.

(D) People are waiting for a train. A train comes and some people get on the train. The other people wait for the next train. Another train arrives and all of the remaining people get on.

Use Functions To Model Relationships Page 199 Exercise 10 Answer

We can see the given graph first we have a constant of people which means that the people are waiting for the train.

After that we can see that part of the people got on that train and there are fewer people now remaining at the station.

Now the second train arrives and the rest of the people leave the station.

Therefore, the correct answer is option D.

Envision Math 8th Grade Exercise 3.6 Step-By-Step Functions Solutions

Envision Math Grade 8 Volume 1 Student Edition Solutions Chapter 3 Use Functions To Model Relationships Exercise 3.6 Page 200 Exercise 12 Answer

The graph is going to rapidly increase at start, and after that is going to start to descend until a fan catches it.

Descend just has to lesser than the increase.

Use Functions To Model Relationships Page 200 Exercise 12 Answer

The graph is going to have a rapid increase at start and then it will start to decrease until it gets back to the ground.

Use Functions To Model Relationships Page 200 Exercise 12 Answer

How To Solve Exercise 3.6 Functions In Envision Math Grade 8

Page 200 Exercise 13 Answer

For the given variables we can make up a lot of descriptions.

Let’s say that the people are boarding a boat and there is a line in front of the boat. Each boat can carry only so many people, so there is going to be 2 boats that will pick up the people.

The first boat arrives after hour, and the second boat will arrive in 3 hours.

On the first boat only half the people boarded.

The rest of the people are waiting for the second boat.

After the second boat arrives the rest of the people board the boat.

Use Functions To Model Relationships Page 200 Exercise 13 Answer

There is some amount of people waiting to board a boat, after the first boat comes after an hour, half the people board the boat. The rest of the people wait for second boat which arrives two hours later and all of them board second boat.

Use Functions To Model Relationships Page 200 Exercise 13 Answer

Envision Math Grade 8 Chapter 3 Exercise 3.6 Practice Problems

Page 200 Exercise 14 Answer

The graph is going to have two constant parts and one decrease.

If at first they score same amount of runs in each of the first 4 innings than in this part the graph is a constant.

After that it will decrease to 0 and it will again be a constant

Use Functions To Model Relationships Page 200 Exercise 14 Answer

The graph is first going to have a constant. After that there will be a decrease to 0 and again the graph is going to become a constant.

Use Functions To Model Relationships Page 200 Exercise 14 Answer

The given graph would have more constant parts of the graph but there would also be an increase before each constant part and there is going to be a decrease after each constant.

Use Functions To Model Relationships Page 200 Exercise 14 Answer

There would be more constant parts which would have increase before them and the decrease after them.

Envision Math Grade 8 Volume 1 Student Edition Solutions Chapter 3 Use Functions To Model Relationships Exercise 3.5

Envision Math Grade 8 Volume 1 Student Edition Solutions Chapter 3 Use Functions To Model Relationships Exercise 3.5

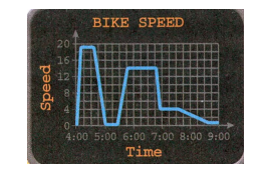
Page 189 Exercise 1 Answer

Given

Martin went aunt’s house , he has two route one is down hill and another one is edge hill

Find the relationship of speed and time?

Each route will have corresponding time needed to travel.

The difference is that the route that goes up and down the hill does not have a constant speed and the route that goes around the edge of the hill will most probably have a constant speed.

Time to pass each route will be roughly the same.

Route that goes up and down that hill does not have a constant speed while the route that goes around the edge of the hill will have constant speed.

Envision Math Grade 8 Volume 1 Chapter 3 Exercise 3.5 Functions Solutions

Page 189 Exercise 1 Answer

Given

Martin went aunt’s house , he has two route one is down hill and another one is edge hill.

Find the relationship of speed and time?

For the route that goes up and down the hill martin will have to put in more effort into going up the hill and his speed will decreases but after he gets to the peak he will not have to put so much effort into it because he will be going downhill.

For the second route that goes around the edge of the hill, the speed on this route will be constant which means that he will be travelling at roughly the same speed the whole route.

The time needed for both routes should be roughly the same.

The time needed for each route is the same, the only difference will be that the route that goes up and down the hill will require more effort going up and no effort going down the hill, and the other route requires the same amount of effort through the whole route.

Envision Math Grade 8 Volume 1 Student Edition Solutions Chapter 3 Use Functions To Model Relationships Exercise 3.5

Envision Math Grade 8 Volume 1 Student Edition Solutions Chapter 3 Use Functions To Model Relationships Exercise 3.5 Page 190 Question 1 Answer

Given

Describe the two quantities ?
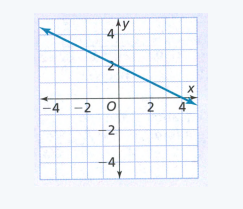
Since the air conditioner is on, the temperature in the room is falling at a constant speed up to the point at which the temperature in the room will be the same as the temperature of the air that the air conditioner is blowing.

The temperature is falling at a constant speed up to the point at which the temperature will be the same as the temperature of the air coming from the air conditioner.


Page 190 Exercise 1 Answer

Given

Find the relationship of speed and time?
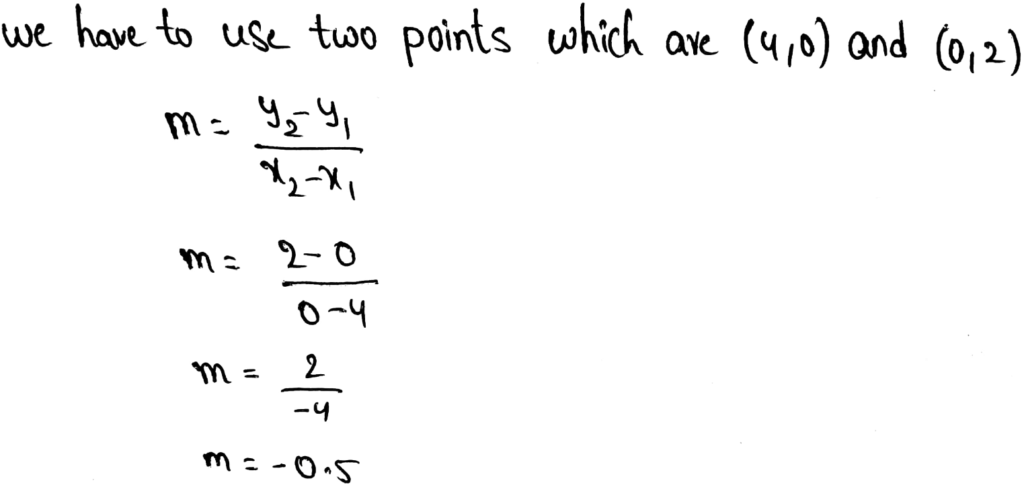
Each route will have corresponding time needed to travel.

The difference is that the route that express train does not have a constant speed and the route that express train will most probably have a constant speed.

Time to pass each route will be roughly the same.

Route that goes up express train does not have a constant speed while the route that goes around the express train will have constant speed.

Envision Math Grade 8 Exercise 3.5 Use Functions To Model Relationships

Envision Math Grade 8 Volume 1 Student Edition Solutions Chapter 3 Use Functions To Model Relationships Exercise 3.5 Page 190 Exercise 1 Answer

Given

Find the graph function changes the train speed increases?

As we can see from the graph, as the time passes the speed of the train is decreasing given function is linear.

The interval would best describe the process of train stopping.

At the time passes, the speed of the train is decreasing.

The function is linear.


Page 191 Exercise 3 Answer

Given

Write the graph scenario ?

The graph could represent a car trip somewhere, because first the distance is increasing at a constant speed which means someone is going somewhere.

The two constant intervals simply means that the car stopped, maybe for sightseeing.

Lastly, why this could be a car trip is because the function is decreasing in the interval 5 which means that we are coming back to the starting point.

The graph could be representing a car trip somewhere because we are going back to the starting point in the end.


Envision Math Grade 8 Volume 1 Student Edition Solutions Chapter 3 Use Functions To Model Relationships Exercise 3.5 Page 190 Exercise 1 Answer

Given

Whether the function increasing ?

From the slope of the linear function we know whether the function is increasing or decreasing because if the slope is positive value than the function will be increasing.

Positive slope of linear function means the function is increasing.


Page 192 Exercise 2 Answer

Given

Whether the function increasing or decreasing?

From the slope of the linear function we know whether the function is increasing or decreasing because if the slope is positive value than the function will be increasing but if the value is negative that the function is decreasing.

Positive slope of linear function means the function is increasing, and the negative slope of linear function means the function will be decreasing.

Functions And Modeling Relationships Grade 8 Exercise 3.5 Envision Math

Envision Math Grade 8 Volume 1 Student Edition Solutions Chapter 3 Use Functions To Model Relationships Exercise 3.5Page 192 Exercise 3 Answer

Given

What kind the graph function is shown at same output or y-values , for each input value or, x-value?

If the output of some function is always the same that means that the graph of the function is going to be a constant.

The graph of the function is a constant.


Page 192 Exercise 5 Answer

Given

Which intervals increasing , decreasing and constant?

We simply have to read the graph to get the information that we need.

In the first interval the function is constant.

In the second interval the function is a decreasing.

In the third interval the function is increasing.

In the fourth interval the function is increasing.

In the fifth interval the function is constant.

In the sixth interval the function is decreasing.

1 → constant

2 → decreasing

3 → increasing

4 → increasing

5 → constant

6 → decreasing


Page 193 Exercise 6 Answer

Given

Which intervals increasing , decreasing and constant?

We simply have to read the graph to get the information that we need.

In the 1, 3 and 6 interval the function is increasing.

In the 4 interval the function is constant.

In the 2 and 5 interval the function is decreasing.

The function is increasing in intervals 1,3 and 6.

The function is decreasing in intervals 2 and 5.

The function is constant in interval 4 .

Envision Math Grade 8 Chapter 3 Exercise 3.5 Solutions

Envision Math Grade 8 Volume 1 Student Edition Solutions Chapter 3 Use Functions To Model Relationships Exercise 3.5 Page 193 Exercise 8 Answer

Given

Which intervals increasing , decreasing and constant?

We simply have to read the graph to get the information that we need.

In interval a) is increasing.

In interval b) is constant.

In interval c) is decreasing.

In interval d) is constant.

a) → increasing

b) → constant

c) → decreasing

d) → constant


Page 193 Exercise 9 Answer

Given

Which intervals increasing , decreasing and constant?

There are 3 intervals in which the function is increasing.

We can see on the given graph that there are 3 peaks.

The function is increasing up to the point until we got to the peak.

So this means that 3 interval in which the function is increasing are right before the peaks of the function.

The greatest increase is the first interval of the function before the first peak.

3 intervals in which the function is increasing which are right before the peeks of the function.

The first interval, where the function starts has the greatest increase.

Envision Math 8th Grade Exercise 3.5 Step-By-Step Functions Solutions

Envision Math Grade 8 Volume 1 Student Edition Solutions Chapter 3 Use Functions To Model Relationships Exercise 3.5 Page 193 Exercise 10 Answer

Given

What is the constant interval represent?

The constant intervals on the given graph represent either the car travelling at constant speed or the car stopping because there is one constant interval which has no speed.

The constant intervals on the graph are showing the constant speed of the car, and the car stopping the interval where the car is not moving because there is no speed.


Page 194 Exercise 11 Answer

Given

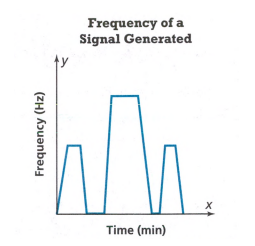
How many intervals function is decreasing?

We simply have to need from the graph the information that we need

There are 3 intervals in which the function is decreasing.

3 intervals.

Given

How are the decreasing intervals alike?

Every decreasing interval lasts about the same amount of time.

The first and third intervals are roughly the same frequency as well.

The decreasing intervals last about the same amount of time

Use Functions To Model Relationships Page 194 Exercise 11 Answer

Second interval has the highest frequency while the first and the third have roughly the same frequency.

Second interval has higher frequency than the remaining two.

How To Solve Exercise 3.5 Functions In Envision Math Grade 8


Envision Math Grade 8 Volume 1 Student Edition Solutions Chapter 3 Use Functions To Model Relationships Exercise 3.5Page 194 Exercise 12 Answer

Use Functions To Model Relationships Page 194 Exercise 12 Answer

We can see that the function has intervals in which it is a constant which means the student is wrong.

There is one interval in which the speed is but it is still an interval in which the function is a constant.

Therefore, there are intervals in which the function is a constant.

Use Functions To Model Relationships Page 194 Exercise 12 Answer

The student forgot to include the interval in which the speed is 0.

This still counts as an interval of the function and in given interval the function is a constant.

The student forgot to include the interval in which the speed is 0.

Envision Math Grade 8 Chapter 3 Exercise 3.5 Practice Problems

Page 194 Exercise 14 Answer

Use Functions To Model Relationships Page 194 Exercise 14 Answer

We have to check all the graphs whether they fit the description.

It states that the graph is in interval 1 which means that the graph C is not the graph that we are looking for because the first interval in graph C is increasing.

In the second interval the function is increasing which means that graph B is not the graph that we are looking for because the second interval in the graph B is a constant.

In the third interval the function has to be a constant which both graphs A and D have.

In the last interval they should be decreasing which means that the only graph that is corresponding to the description in the graph D.

Hence, the right graph is graph D.

Envision Math Grade 8 Volume 1 Student Edition Solutions Chapter 3 Use Functions To Model Relationships Exercise 3.4

Envision Math Grade 8 Volume 1 Student Edition Solutions Chapter 3 Use Functions To Model Relationships Exercise 3.4

Page 183 Exercise 1 Answer

We need to determine the properties of the function.

We can use more different representations to help us determine the properties of functions, and those representations are the graphs and table data.

When we use graph we can see more easier whether the function is linear or not but it is more difficult to determine what is the initial value when we have bigger numbers.

The table data should show the initial value much more clearly but at the same time it is more difficult to determine whether the function is linear or not.

Graph help us to determine whether the function is linear easier, but the table data will show us the initial value more clearly.

Envision Math Grade 8 Volume 1 Chapter 3 Exercise 3.4 Functions Solutions

Page 184 Question 1 Answer

Given

How can you use a function to represent a linear relationship?

When we use an equation of a function that looks like y = mx + b,

The m represents the slope or the constant rate of change

The b is the y-intercept or the initial value

Now we know that a function that is in the form y = mx + b represents a linear relationship between x and y.

A function that is written in form y = mx + b represents a linear relationship between x and y.

Envision Math Grade 8 Volume 1 Student Edition Solutions Chapter 3 Use Functions To Model Relationships Exercise 3.4

Envision Math Grade 8 Volume 1 Student Edition Solutions Chapter 3 Use Functions To Model Relationships Exercise 3.4 Page 184 Exercise 1 Answer

Given

Height 8 inches

Triangle base is 15 inches

Show the graph of the function?

First we have to graph the new function. The new slope is going to be \(\frac{3}{5}=\frac{1}{5}\)

Since we know that there is no initial value than we know that the equation of the function is \(y=\frac{1}{5} x\).

For the last part we simply have to substitute the x with 110 and calculate from the equation.

\(y=\frac{1}{5} x\)


\(y=\frac{1}{5} .110\)

y = 22

The height of the ramp is going to be 22 inches when the base length is 110 inches.

New slope \(\frac{1}{5}\)

New equation \(y=\frac{1}{5} x\)

The height of the ramp is going to be 22 inches when the base length is 110 inches


Page 185 Exercise 2 Answer

Given

After 2 weeks he feed to dog is \(8 \frac{1}{2}\)

After 5 weeks he feed to dog is \(21 \frac{1}{4}\)

Construct the function in the form of mx + c ?

We are simply going to subtract the amount he used after 3 weeks from the amount that her used after 5 weeks

d = 21.25 − 8.5

d = 12.75

Now we got the amount of food that he used in time period of 3 weeks.

Simply divide the result that we got with 3

d ÷ 3 = 12.75 ÷ 3 = 4.25.

Since we know the slope now, we need to find the initial value to be able to write the equation for the function.

To do this we can simply subtract 4.25 for every week that he fed the dogs from the value of food that he used after 2 weeks.

8.5 − 2.4.25 = 0

Now we know that the initial value is 0

Simply write equation

y = 4.25x

So, function is y = 4.25x

Envision Math Grade 8 Exercise 3.4 Use Functions To Model Relationships

Envision Math Grade 8 Volume 1 Student Edition Solutions Chapter 3 Use Functions To Model Relationships Exercise 3.4 Page 185 Exercise 3 Answer

Given

Construct the function in the form of mx + b ?

If we would want to write the function for given graph than we simply have to find what is the slope of the given function, and the initial value of the function.

The initial value of the function is 1.

This means that printer needs 1 minute to warm-up before each printing.

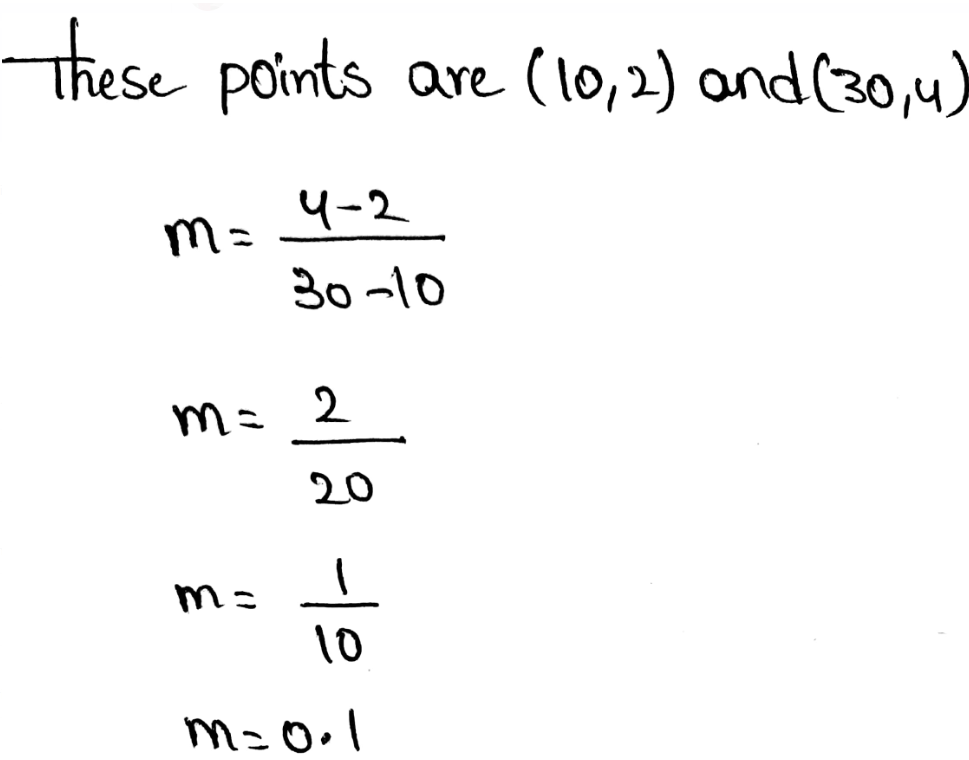
Now to find the slope we can use 2 points that are already marked on the graph. These points are (10,2) and (30,4)
Use Functions To Model Relationships Page 185 Exercise 3 Answer

Now that we know the slope and the initial value we can simply write equation for given function

y = 0.1x + 1

y = 0.1x + 1


Page 184 Exercise 1 Answer

Given

Find the initial function of all function and proportional relationship?

The initial value of all linear functions that show a proportional relationship. Proportional relationships always start in the origin.

When we calculate y-intercept then we substitute x = 0. Which is same as initial values.

The initial value is same as y-intercept.


Envision Math Grade 8 Volume 1 Student Edition Solutions Chapter 3 Use Functions To Model Relationships Exercise 3.4 Page 186 Exercise 1 Answer

Given

How can you use a function to represent a linear relationship?

When we use an equation of a function that looks like y = mx + b,

The m represents the slope or the constant rate of change

The b is the y-intercept or the initial value

Now we know that a function that is in the form y = mx + b represents a linear relationship between x and y.

A function that is written in form y = mx + b represents a linear relationship between x and y.


Page 186 Exercise 3 Answer

Given

Find the initial function of all function and proportional relationship?

The initial value of all linear functions that show a proportional relationship is 0.

Proportional relationships always start in the origin.

The initial value is 0.

Functions And Modeling Relationships Grade 8 Exercise 3.4 Envision Math

Envision Math Grade 8 Volume 1 Student Edition Solutions Chapter 3 Use Functions To Model Relationships Exercise 3.4 Page 186 Exercise 5 Answer

Given

Fill the missing data?

As we can see from the table both the x and y are increasing linearly. So we know that in the blank box in x row the missing number is 30 because the x is increasing by 10.

Same thing we can do for the y, we can see that y is increasing by 5. We simply need to add 5 to the third value in the y row and we get the last row.

20 + 5 = 25

The missing value of y is 25

The missing value of x is 30, and The missing value of y is 25.


Page 186 Exercise 6 Answer

Given

The data is 5

Find the equation form of y = mx + b ?

We can simply use two ordered pairs to find the equation that is described by the data in item 5.

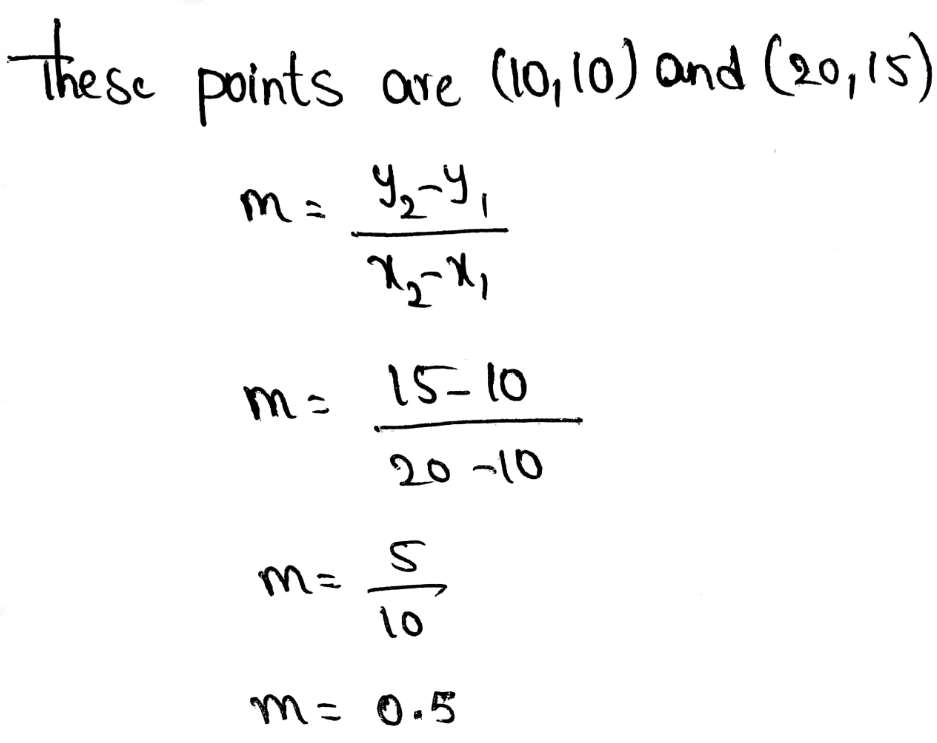
We are going to be using points (10,10) and (20,15)

The way we find the slope is by the formula:
Use Functions To Model Relationships Page 186 Exercise 6 Answer

Now we can use the slope that we just calculated to find the initial value. We do this by calculating either one of the points.

10 = 0.5.10 + b

10 = 5 + b

10 − 5 = b

b = 5

Now we have everything we need to write the function for given line.

y = 0.5x + 5

So, equation of linear function is y = 0.5x + 5

Envision Math 8th Grade Exercise 3.4 Step-By-Step Functions Solutions

Envision Math Grade 8 Volume 1 Student Edition Solutions Chapter 3 Use Functions To Model Relationships Exercise 3.4 Page 187 Exercise 7 Answer

Given

The points is (4,19) and (9,24)

Find the equation form of y = mx + b ?

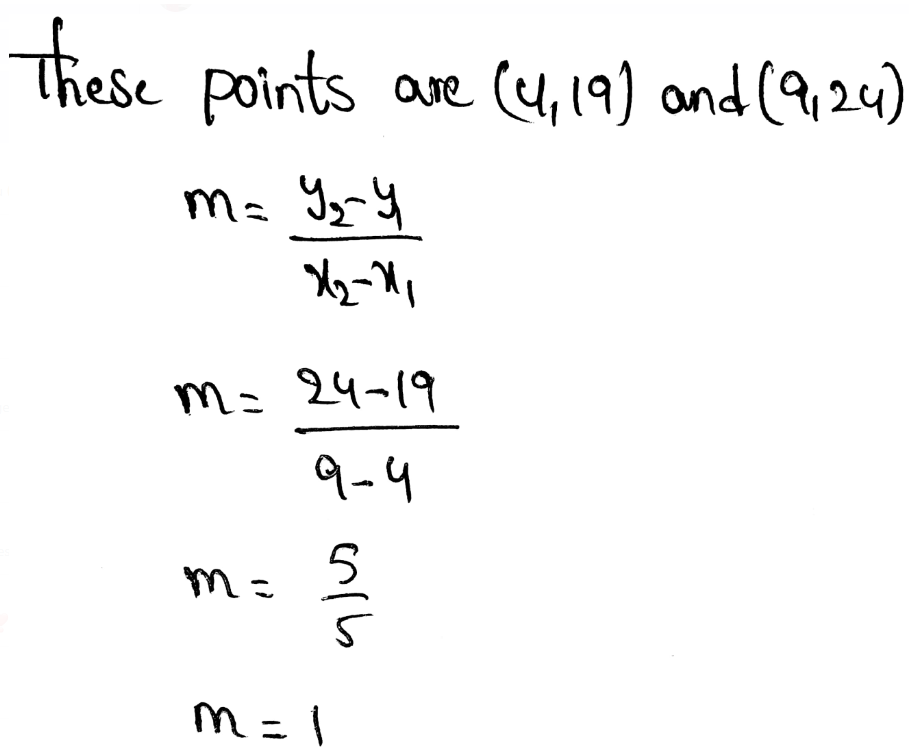
We are going to be using points (4,19) and (9,24)

The way we find the slope is by the formula:
Use Functions To Model Relationships Page 187 Exercise 7 Answer

Now we can use the slope that we just calculated to find the initial value. We do this by calculating either one of the points.

19 = 4 + b

19 − 4 = b

b = 15

Now we have everything we need to write the function for given line.

y = x + 15

So, function is y = x + 15


Page 187 Exercise 8 Answer

Given

The line passing through (4.5,4.25) with y-intercept 2.5

Find the equation form of y = mx + b ?

We are going to be using points (4.5,4.25) with y-intercept 2.5

Since we know b in given task we can simply use the points through which the line passes and put the values into the equation to get the slope

−4.25 = 4.5m + 2.5

Subtract 2.5 from both sides of the equation

−4.25 − 2.5 = 4.5m

−6.75 = 4.5m

Now simply divide both sides of the equation with 4.5.

m = −1.5

The linear function we are looking for is y = −1.5x + 2.5

So, equation is y = -1.5x + 2.5


Envision Math Grade 8 Volume 1 Student Edition Solutions Chapter 3 Use Functions To Model Relationships Exercise 3.4 Page 187 Exercise 9 Answer

Given

t = 0

at 8 Seconds

840 feet

Find the equation form of y = mx + b ?

We simply have to divide the distance that car has traveled with the time has passed which is 8 seconds.

840 ÷ 8 = 105

Now we know how much distance can the car pass in 1 seconds.

We can now simply write the equation because we know that the initial value is 0

d = 105t

Linear function is d = 105t

How To Solve Exercise 3.4 Functions In Envision Math Grade 8

Page 187 Exercise 10 Answer

Given

t = 0

after 56 minutes

8 inches

Find the equation form of y = mx + b?

In this task we must simply find how much time is needed for 1 inch of water to get into the bucket. We do this by dividing the amount of inches in the bucket.

56 ÷ 8 = 7

Now we know that it is needed 7 minutes for each inch that drips into the bucket.

Simply write the equation because we know that there is no initial value, in other words the initial value is 0.

\(w=\frac{1}{7} t\) \(w=\frac{1}{7} t\)


Envision Math Grade 8 Volume 1 Student Edition Solutions Chapter 3 Use Functions To Model Relationships Exercise 3.4 Page 187 Exercise 11 Answer

Given

Find the equation form of y = mx + b ?

To find the linear function in the form of y = mx + b we needed to read two points from the graph and calculate the slope so we can find the initial value.

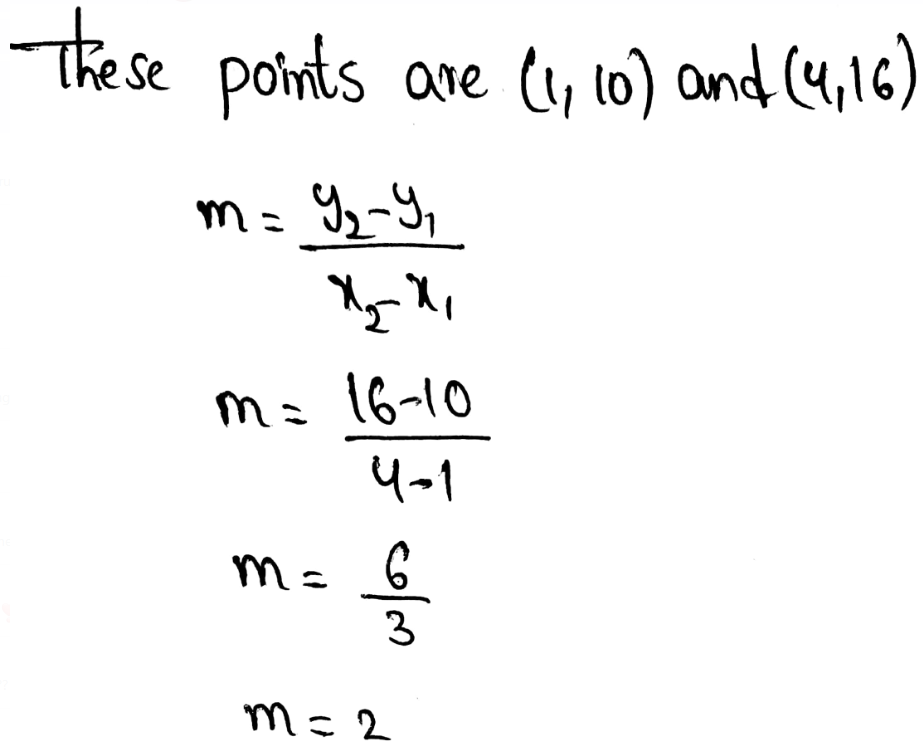
We are going to be using points (1,10) and (4,16)

The way we find the slope is by the formula:
Use Functions To Model Relationships Page 187 Exercise 11 Answer

Now we can use the slope that we just calculated to find the initial value. We do this by calculating either one of the points.

10 = 2 + b

10 − 2 = b

b = 8

Now we have everything we need to write the function for given line.

y = 2x + 8

y = 2x + 8


Page 187 Exercise 12 Answer

Given

Company charges $6.50

Flat fee $3.99

Find the equation form of y = mx + b ?

We can simply write the linear function from the data that we got in the task.

The sweatshirts are going to be our Variable x

And the shipping fee is going to be b

y = 6.5x + 3.99

y = 6.5x + 3.99

We need to describe how the linear function would change the shipping charge.

If the shipping charge would apply to each sweatshirt then we would have to change our linear function. If the shipping charge is applied to each sweatshirt than we would simply have to add 3.99 to the factor next to x, so that the shipping fee is applied to every single sweatshirt.

y = (6.5 + 3.99) × x

The linear function would change from y = 6.5x + 3.99 to y = (6.5 + 3.99)x


Envision Math Grade 8 Volume 1 Student Edition Solutions Chapter 3 Use Functions To Model Relationships Exercise 3.4 Page 187 Exercise 13 Answer

Given:

1 poster + 6 comics for $12.75 and 1 poster + 13 comics for $19.75

We consider:

y as the total cost

x as the cost of comic books

m as the number of comic books.

b as the cost of posters.

We get two functions from the given data:

12.75 = 6m + 1

And

19.75 = 13m + 1

Subtracting both the equations we get:

7x = 7

x = 1

The cost of one comic book is $1.

Substituting the value of x in first equation we get:

b = 6.75

Therefore the required equation is:

y = m + 6.75

The required linear function is y = m + 6.75

Given:

The initial value of the package sold by another seller is $7.99.

We consider:

y as the total cost

x as the cost of comic books

m as the number of comic books

b as the cost of posters.

Since the shop sells poster with a comic book, initial value is the cost of one comic book plus one poster.

7.99 = x + b

We get:

x = 1

In a, the cost of one book plus poster = $1 + 6.75 = $7.75 which is lesser than $7.99.

Therefore, the seller B has the best deal.

In a, the cost of one book plus poster = $1 + 6.75 = $7.75 which is lesser than $7.99. Therefore, the seller B has the best deal.

Envision Math Grade 8 Chapter 3 Exercise 3.4 Practice Problems

Envision Math Grade 8 Volume 1 Student Edition Solutions Chapter 3 Use Functions To Model Relationships Exercise 3.4 Page 188 Exercise 15 Answer

Given:

Use Functions To Model Relationships Page 188 Exercise 15 Answer

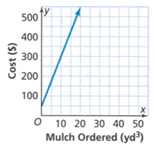
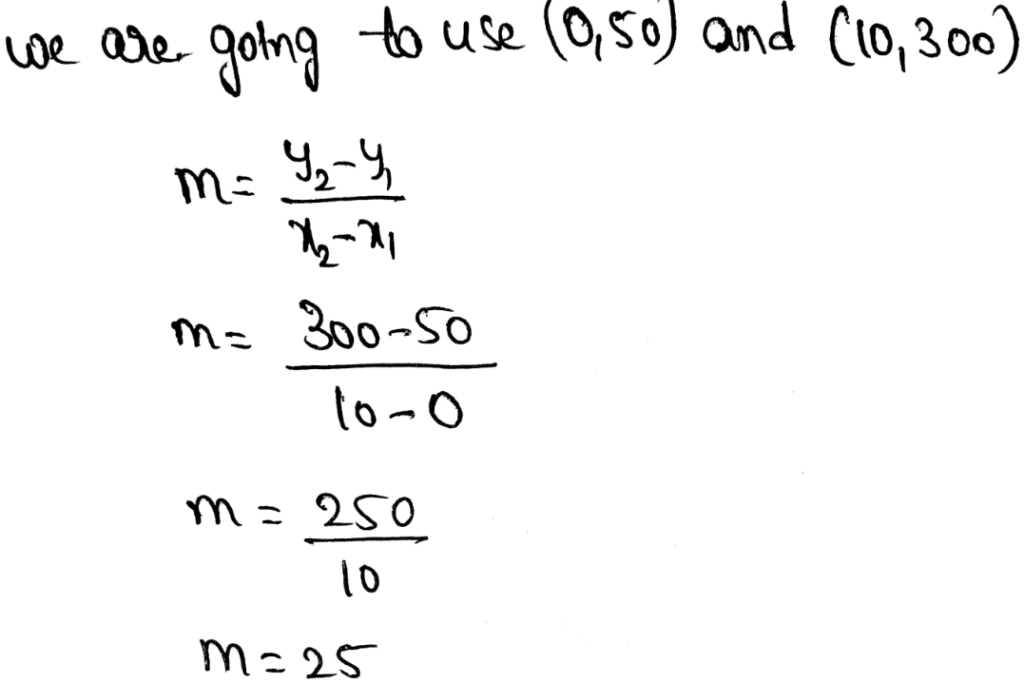
To find the constant rate of change we simply have to use two points that we can read from the graph.
Use Functions To Model Relationships Page 188 Exercise 15 Answer Image

The constant rate of change is 25. This means that one cubic yard of mulch costs $25.

The constant rate of change is 25 and that means that one cubic yard of mulch costs per 25$.

Given that, the graph shows the relationship between the number of cubic yards of mulch ordered and the total cost of the mulch delivered.

We need to find the initial value. Also, we need to explain what it represents.

The given graph is,

Use Functions To Model Relationships Page 188 Exercise 15 Answer

The given graph is,

Use Functions To Model Relationships Page 188 Exercise 15 Answer

It is visible from the graph that the initial point on the graph is (0,50)

The initial value is nothing but the starting point of the graph.

Therefore, the initial value is found to be $50 for 0 mulch ordered.

Thus, this initial value represents the shipping fee incurs for each shipment done.

The initial value is $50. This initial value represents the shipping fee for each shipment.


Page 188 Exercise 17 Answer

Given that, some eighth-graders are making muffins for a fundraiser. They have already made 200 muffins and figure they can make 40 muffins in an hour.

We need to write a linear function in the form y = mx + b that represents the total number of muffins the students will make, y, and the number of additional hours spent making the muffins, x

Also, we need to find how many additional hours would the students spend to make 640 muffins.

The linear function is of the form y = mx + b

Here, b = 400 since they have already made those muffins.

Also, they can make 40 muffins in an hour.

Thus, the value of m = 40

Substituting this in the equation, we get,

y = 40x + 200

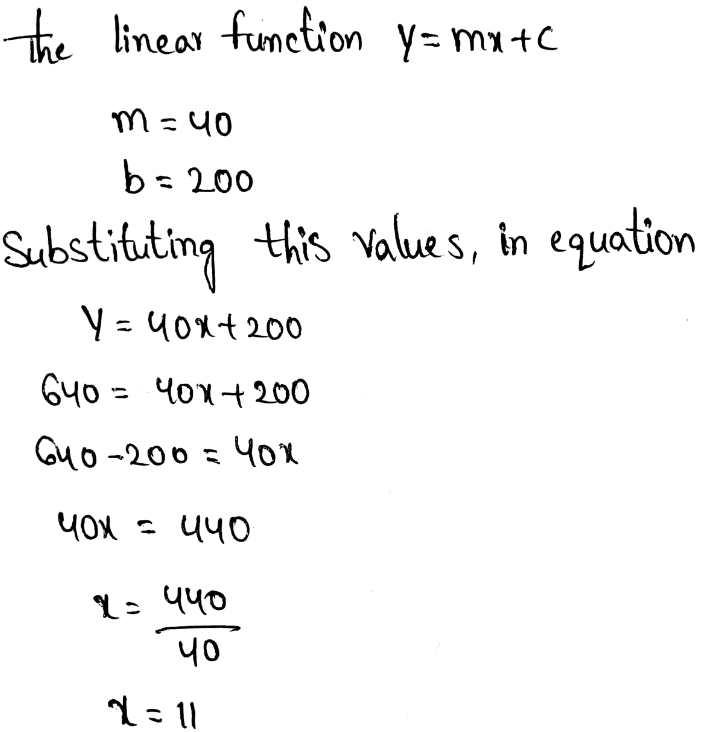
Finding the additional hours would the students spend to make 640 muffins, we get,

Use Functions To Model Relationships Page 188 Exercise 17 Answer
Thus, it took 11 more hours to make 640 muffins.

The linear equation will be y = 40x + 200

11 additional hours are needed to make 640 muffins.

Envision Math Exercise 3.4 Functions Detailed Answers

Envision Math Grade 8 Volume 1 Student Edition Solutions Chapter 3 Use Functions To Model Relationships Exercise 3.4 Page 188 Exercise 17 Answer

Given:

Eight graders made 200 muffins. They can make 40 muffins per hour.

We consider:

Initial value as 200 muffins.

Let, x is the estimate, 40 muffins per hour.

Now we simply write linear function:

y = 40x + 200

Therefore the required linear function is y = 40x + 200

y = 40x + 200 From(A)

We consider:

Let y= 640

Putting this value in the linear function obtained from Part (A):

640 = 40x + 200

640 − 200 = 40x

40x = 440

x = 11

The students are going to need 11 additional hours if they want to make 640 muffins.

The students are going to need 11 additional hours if they want to make 640 muffins.

Envision Math Grade 8 Volume 1 Student Edition Solutions Chapter 3 Use Functions To Model Relationships Topic 3.1

Envision Math Grade 8 Volume 1 Student Edition Solutions Chapter 3 Use Functions To Model Relationships Topic 3.1

Page 177 Exercise 2 Answer

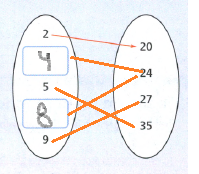
The relation shown in the arrow diagram is a function.

We can see that there are multiple arrows that go into 10 which is in the outputs on the right side.

When a relation is a function than all of the x-coordinates will have unique corresponding y-coordinate.

The given arrow diagram is a function.


Page 177 Exercise 4 Answer

Given :

Use Functions To Model Relationships Page 177 Exercise 4 Answer Image 1

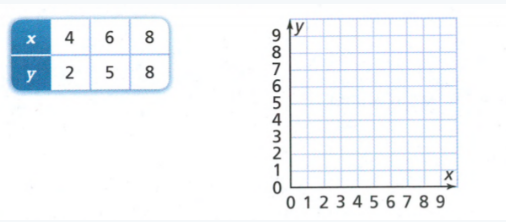
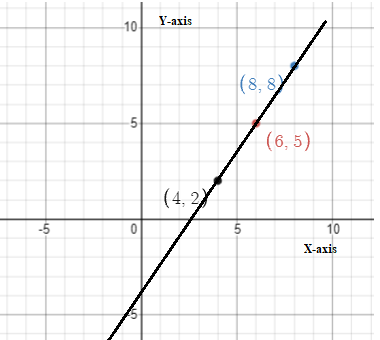
We need to check whether the relation shown in the table is a function or not.

We plot the graph of the ordered pairs into the graph.

Use Functions To Model Relationships Page 177 Exercise 4 Answer Image 2

As we can see the relation is a function because the graph is a straight line.

According to the definition of the linear function, the graph of the function should always be a straight line.

Therefore, the given relation is a function by the definition of linear function.

Envision Math Grade 8 Volume 1 Student Edition Solutions Chapter 3 Use Functions To Model Relationships Topic 3.1

Envision Math Grade 8 Volume 1 Chapter 3 Topic 3.1 Functions Solutions

Envision Math Grade 8 Volume 1 Student Edition Solutions Chapter 3 Use Functions To Model Relationships Topic 3.1 Page 178 Exercise 1 Answer

Given: three plans are proposed by Sarah, Gene and Paul.

y represents amount of money raised and x represents number of hours worked.

we have to show, whether each proposal is a linear function or not.

Sarah’s proposal: is a graph, the graph for Sarah’s proposal is a straight line, therefore, it represents a linear function.

Gene’s proposal is a table

Use Functions To Model Relationships Page 178 Exercise 1 Answer

from the table it is clear that,

for every 5 hours money raised changes by 35

therefore, rate of change \(\frac{35}{5}=7\) which makes it a linear function.

Paul’s proposal is: y = 10x + 7

which is in the form of linear equation y=mx+c

therefore, it is a linear function.

hence, all the three proposals are linear functions.

All three proposals are linear functions.

Given: three proposals are given for class fund raiser.

we need to find out the starting money which the class have in their account.

From the Paul’s equation y = 10x + 7

it is clear that the y-intercept is 7

i.e., when x = 0,y = 7

therefore, starting money = $7

from Sarah’s graph it is clear that starting money in the account is = $7 from

Gene’s table:

for every 5 hours there is $35 increase in money

therefore, rate of change is \(\frac{35}{5}=7\)

now to get the starting money subtract 5 multiply by rate from money raised in 5 hours

we get, 42 = 7(5) + c

c = 7

Therefore, it is clear that the starting money in the class account was = $7.

There was $7 in the class account.

Three fund raising proposals are given.

First, we will select a specific time and see how much money is earned at that time.

From Sarah’s graph the easiest point to read is 7 hours.

hence, we will check after 7 hours how much money each of the proposal would earn.

From Sarah’s proposal they would earn about $90 after 7 hours.

From Gene’s table, we can see that after 10 hours they would raise $77.

From Paul’s proposal we have the equation,

y = 10x + 7

substituting x = 7 we get,

y = 10(7) + 7 = 77

Therefore, after 7 hours they would raise $77 from Paul’s proposal.

Hence, we can say that Sarah’s proposal raises money at the fastest rate.

Sarah’s proposal raises money at the fastest rate.

Three fund raising proposals are given.

we have to recommend a proposal which will raise fastest.

we will recommend that proposal which raises the money at the fastest rate.

We would recommend Sarah’s proposal.

As Sarah’s proposal raises the money at the fastest rate.

Therefore, they would have to work for less hours in order to get $200.

We would choose Sarah’s proposal because it raises the money at the fastest rate.

Envision Math Grade 8 Topic 3.1 Use Functions To Model Relationships

Envision Math Grade 8 Volume 1 Student Edition Solutions Chapter 3 Use Functions To Model Relationships Topic 3.1 Page 179 Exercise 1 Answer

The video mentioned above shown some images that predict the amount of water we use every day.

The reason is for knowing the water wastage we do every day.

There is more percent of people who didn’t have enough water to drink. Hence, water conservation is necessary.

You may frequently utilize visual cues to figure out what’s in the shot and what the remainder of the thing could appear like.

The first question that comes to my mind after watching this video is “How much water do I use while brushing my teeth?”.

“How much water do I use while brushing my teeth?”.

This is the question that made up my mind after watching this video.


Page 179 Exercise 2 Answer

The video mentioned above shown some images that predict the amount of water we use every day.

The reason is for knowing the water wastage we do every day.

There is more percent of people who didn’t have enough water to drink. Hence, water conservation is necessary.

You may frequently utilize visual cues to figure out what’s in the shot and what the remainder of the thing could appear like.

The first question that comes to my mind after watching this video is “How much water do I use while brushing my teeth?”.

The main question that I will answer that I saw in the video is “How much water do I use while brushing my teeth?”.


Page 179 Exercise 3 Answer

A conjecture is a result or statement in math that is thought to be valid based on basic evidence to back it up but for which no evidence or falsifiability has ever been produced.

A conjecture is nothing but a conclusion we made up where it doesn’t have any proof to make it false.

The reason is for knowing the water wastage we do every day.

There is more percent of people who didn’t have enough water to drink. Hence, water conservation is necessary.

The first question that comes to my mind after watching this video is “How much water do I use while brushing my teeth?”.

An answer that I was predicted to this main question is four cups of water.

An answer that I was predicted to this main question is four cups of water I use while brushing my teeth. I found my answer by calculating the number of cups I use daily.

Functions And Modeling Relationships Grade 8 Topic 3.1 Envision Math

Envision Math Grade 8 Volume 1 Student Edition Solutions Chapter 3 Use Functions To Model Relationships Topic 3.1 Page 179 Exercise 5 Answer

Informally, a conjecture is simply making judgments over something based on what you understand and monitor.

A conjecture is a declaration that is thought to be accurate based on data.

In general, a conjecture is your view or an informed guess over something you recognize.

You can’t indicate any of it; you simply observed a pattern and conclude.

A number that I know which is too small to be the answer is one cup since at least one cup of water is necessary to rinse our mouth after brushing.

A number that is too large to be the answer is 10 cups of water since we can even take a quick bath with those amount of water.

My prediction is that I use 4 cups of water every day while brushing.

Plotting my prediction on the same number line, I get,

Use Functions To Model Relationships Page 179 Exercise 5 Answer


Page 180 Exercise 7 Answer

Informally, a conjecture is simply making judgments over something based on what you understand and monitor.

A conjecture is a declaration that is thought to be accurate based on data.

In general, a conjecture is your view or an informed guess over something you recognize.

You can’t indicate any of it; you simply observed a pattern and conclude.

To get the information I need regarding the amount of water usage, I can use a weighing machine for calculating mine and internet sources for calculating other’s usage.

This will determine the amount of water wastage I do each year.

A weighing scale can be used to get the information I need.

Envision Math Grade 8 Chapter 3 Topic 3.1 Solutions

Envision Math Grade 8 Volume 1 Student Edition Solutions Chapter 3 Use Functions To Model Relationships Topic 3.1 Page 180 Exercise 9 Answer

Informally, a conjecture is simply making judgments over something based on what you understand and monitor.

A conjecture is a declaration that is thought to be accurate based on data.

In general, a conjecture is your view or an informed guess over something you recognize.

You can’t indicate any of it; you simply observed a pattern and conclude.

The main question that comes to my mind after watching this video is “How much water do others use on average while brushing their teeth?”.

An answer to this main question is two cups of water.This is less than my prediction.

An answer to this main question is two cups of water. This is less than my prediction.

Envision Math 8th Grade Topic 3.1 Step-By-Step Functions Solutions

Page 181 Exercise 10 Answer

A conjecture is a result or statement in math that is thought to be valid based on basic evidence to back it up but for which no evidence or falsifiability has ever been produced.

A conjecture is nothing but a conclusion we made up where it doesn’t have any proof to make it false.

The main question that comes to my mind after watching this video is “How much water do others use on average while brushing their teeth?”.

An answer to this main question is two cups of water.

An answer that I saw in the video is also the same.

The answer that I saw in the video is people on average use two cups of water while brushing their teeth.


Envision Math Grade 8 Volume 1 Student Edition Solutions Chapter 3 Use Functions To Model Relationships Topic 3.1Page 181 Exercise 11 Answer

A conjecture is a result or statement in math that is thought to be valid based on basic evidence to back it up but for which no evidence or falsifiability has ever been produced.

A conjecture is nothing but a conclusion we made up where it doesn’t have any proof to make it false.

The first question that comes to my mind after watching this video is “How much water do I use while brushing my teeth?”.

An answer that I was predicted to this main question is four cups of water.

An answer that I saw in the video is two cups of water.

This is because I use more cups of water to wash my teeth than others.

My answer doesn’t match the answer in the video. This is because I use more cups of water to wash my teeth than others.


Page 181 Exercise 12 Answer

A conjecture is a result or statement in math that is thought to be valid based on basic evidence to back it up but for which no evidence or falsifiability has ever been produced.

A conjecture is nothing but a conclusion we made up where it doesn’t have any proof to make it false.

The first question that comes to my mind after watching this video is “How much water do I use while brushing my teeth?”.

An answer that I was predicted to this main question is four cups of water.

An answer that I saw in the video is two cups of water.

This is because I use more cups of water to wash my teeth than others.

I have to change my model now that I know the answer. I have to use less amount of water to conserve water.

Yes, I would change my model now that I know the answer.

Envision Math Grade 8 Topic 3.1 Practice Problems

Envision Math Grade 8 Volume 1 Student Edition Solutions Chapter 3 Use Functions To Model Relationships Topic 3.1 Page 182 Exercise 14 Answer

Informally, a conjecture is simply making judgments over something based on what you understand and monitor.

A conjecture is a declaration that is thought to be accurate based on data.

In general, a conjecture is your view or an informed guess over something you recognize.

You can’t indicate any of it; you simply observed a pattern and conclude.

The first question that comes to my mind after watching this video is “How much water do I use while brushing my teeth?”.

An answer that I was predicted to this main question is four cups of water.

I have used the units as the number of cups and the method I used is to calculate the number of cups of water I use to determine how much I use while brushing my teeth.

The calculations differ based on the amount of water. This helps me to know that when the amount of water increases the amount of water I conserve decreases.

Envision Math Topic 3.1 Functions Detailed Answers

Envision Math Grade 8 Volume 1 Student Edition Solutions Chapter 3 Use Functions To Model Relationships Topic 3.1 Page 182 Exercise 15 Answer

A conjecture is a result or statement in math that is thought to be valid based on basic evidence to back it up but for which no evidence or falsifiability has ever been produced.

A conjecture is nothing but a conclusion we made up where it doesn’t have any proof to make it false.

I use four cups of water every day to brush my teeth while on average he uses two cups every day.

Thus, he saves two cups of water every day.

Hence, in a year, he save 2 × 365 = 730 cups of water.

Therefore, \(\frac{730}{4}=\frac{365}{2}=182.5\) liters of water.

He saves 182.5 liters of water every day while brushing his teeth.

Envision Math Grade 8 Volume 1 Student Edition Solutions Chapter 3 Use Functions To Model Relationships Exercise 3.3

Envision Math Grade 8 Volume 1 Student Edition Solutions Chapter 3 Use Functions To Model Relationships Exercise 3.3

Page 171 Exercise 1 Answer

The Movies4You offer the deal that costs $10 for the first device and an additional $2 for each additional device, which means that they will for example charge $20 monthly for 6 devices.

The Family stream cots $12 a month for up to 4 devices which means that they are going to pay $12 if the number of devices is up to 4.

On the other hand, it means that if there are morthan 5 devices they are charging an additional $1 per device.

We make a table to see when each plan is the better deal:

Use Functions To Model Relationships Page 171 Exercise 1 Answer

Movies 4 you have a better deal when there is only one device connected.

Both of the services offer fixed costs per month for a number of devices.

They have a different fixed cost per month and different initial costs.

Movies 4 You has a better deal when there is only one device connected.

Envision Math Grade 8 Volume 1 Student Edition Solutions Chapter 3 Use Functions To Model Relationships Exercise 3.3

Envision Math Grade 8 Volume 1 Chapter 3 Exercise 3.3 Functions Solutions

Page 171 Exercise 1 Answer

We need to explain how we can represent the relationship between cost and number of devices.

The Movies 4 You offer the deal that costs $10 for the first device and an additional $2 for each additional device, which means that they will for example charge $20 monthly for 6 devices.

The Family stream costs $12 a month for up to 4 devices which means that they are going to pay $12 if the number of devices is up to 4.

On the other hand, it means that if there are more than 5 devices they are charging an additional $1 per device.

We make a table to see when each plan is the better deal:

Use Functions To Model Relationships Page 171 Exercise 1 Answer

Movies 4 you have a better deal when there is only one device connected.

We can represent the relationship between cost and number of devices using a table. The table is as follows:
Use Functions To Model Relationships Page 171 Exercise 1 Answer


Page 171 Exercise 1 Answer

Movies 4 You is offering $10 for the first device and an additional $2 for each additional device. This means that our equation

would look like y = (x−1)⋅2 + 10 where x is the number of devices connected and y is the total cost.

For Family stream we have to pay $12 if we have up to 4 devices connected, and this would give the following equation y = 12 where x ≤ 4

Reason of that equation is that we have 5 or more devices connected it states that they charge an additional fee of $1 per device which change our equation y = (x−4)⋅1 + 12 to where x ≥ 5

For Movies 4 You the relationship is shown by the equation y = (x−1)⋅2 + 10 where x is the number of devices connected.

For Family stream the equation y = (x−4)⋅1 + 12 when x ≥ 5


Envision Math Grade 8 Volume 1 Student Edition Solutions Chapter 3 Use Functions To Model Relationships Exercise 3.3 Page 172 Question 1 Answer

We can compare two different functions using the properties of functions.

We use the property of constant rate of change and the initial value which is the y-intercept to compare the two functions.

We can compare two functions by comparing their properties.


Page 172 Exercise 1 Answer

We need to determine what are the properties of functions that can be used to compare functions.

Some of the properties of functions are:

Linear functions: It is represented by f(x) = mx + b where m,b are real numbers.

Constant Function: It is represented by f(x) = b where b is a real number.

Identity Function: It is represented by f(x) = x where the input and the output are the same.

Square Function: It is represented by f(x) = x2 where the output is the square of the given input.

Cube Function: It is represented by f(x) = x3 where the output is the cube of the given input.

Square Root Function: It is represented by f(x) = √x where the output is the square root of the given input.

Reciprocal Function: It is represented by \(f(x)=\frac{1}{x}\) where the output is the inverse of the given input.

Absolute Value Function: It is represented by f(x)=∣x∣

Linear functions, Identity Function, Square Function, Cube Function, Square Root Function, Reciprocal Function, Absolute Value Function.

These are the properties of functions that can be used to compare functions.


Envision Math Grade 8 Volume 1 Student Edition Solutions Chapter 3 Use Functions To Model Relationships Exercise 3.3 Page 173 Exercise 2 Answer

Given :

Use Functions To Model Relationships Page 173 Exercise 2 Answer

To be able to compare the two given functions, we have to put values for y in Function 2 and see the results that we get for x. we are going to calculate for the first 3 y values.

1 = 2x − 4

Add 4 to both sides of the equation

5 = 2x

Now we divide both sides by 2

x = 2.5

5.5 = 2x − 4

Add 4 to both sides of the equation

9.5 = 2x

Divide both sides with 2

x = 4.75

11.5 = 2x − 4

Add 4 to both sides of the equation

15.5 = 2x

Divide both sides of the equation with 2

7.75 = 2x

From this we can see that the Function 1 has greater rate of change and Function 2 has a greater initial value.

Therefore Function 1 has greater rate of change and Function 2 has a greater initial value.

Envision Math Grade 8 Exercise 3.3 Use Functions To Model Relationships

Page 172 Exercise 1 Answer

All linear equations produce straight lines when graphed.

But not all linear equations produce linear functions.

In order to be a linear function, a graph must be both linear and a function.

Linear equations help to compare linear functions by graphs.


Envision Math Grade 8 Volume 1 Student Edition Solutions Chapter 3 Use Functions To Model Relationships Exercise 3.3 Page 174 Exercise 1 Answer

We can compare two different functions using the properties of functions.

We use the property of constant rate of change and the initial value which is the y-intercept to compare the two functions.

We can compare two functions by comparing their properties.


Page 174 Exercise 4 Answer

Given :

Use Functions To Model Relationships Page 174 Exercise 4 Answer

We find the constant rate of change and initial value for Samantha.

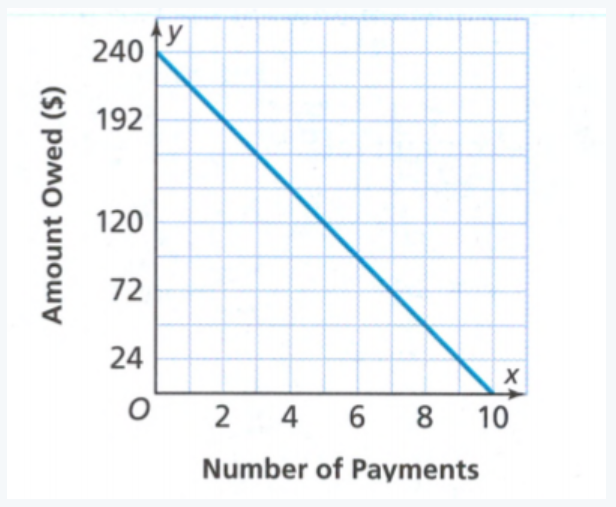
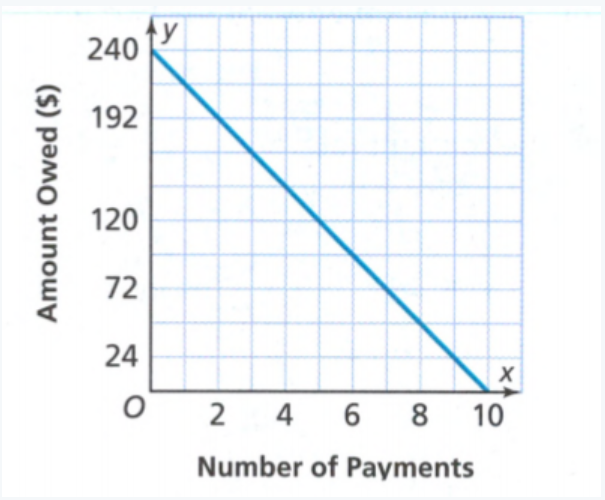
We see from the graph that the initial value is 240 and we can see that Samantha spent all this $240 on 10 payments.

We divide the amount of money with the number of payments, we get 4.

We can see she spends $24 per payment for the musical instrument.

In the task it states that Felipe pays $30 per payment.

Now we can see that she will spend $240 for the instrument and Felipe will spend $290.

Felipe’s instrument costs more.


Page 174 Exercise 5 Answer

Given :

Use Functions To Model Relationships Page 174 Exercise 5 Answer

We need to divide the amount of money with the amount of pays to find how much Samantha pays.

∴ 240 ÷ 10 = 24

Since we already stated that Felipe pays $30 per month and Samantha pays $24 per month. This means that Felipe pays more each month.

Felipe pays more each month.

Envision Math Grade 8 Exercise 3.3 Solution Guide

Envision Math Grade 8 Volume 1 Student Edition Solutions Chapter 3 Use Functions To Model Relationships Exercise 3.3 Page 175 Exercise 6 Answer

Given :

Use Functions To Model Relationships Page 175 Exercise 6 Answer


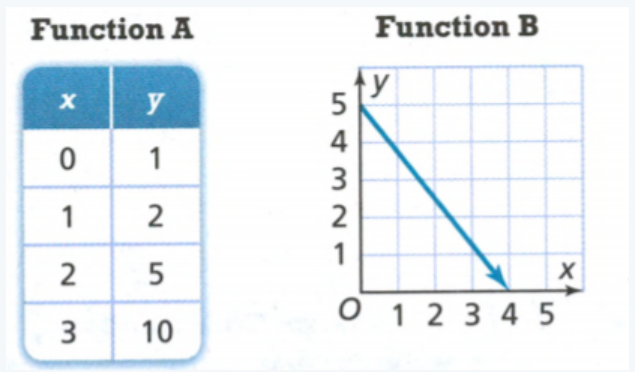
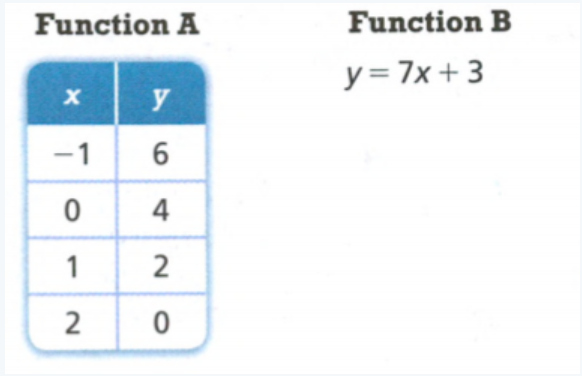
If we closely observe Function A, we see that the initial value of the function is 2. We also see that the rate at which the function is growing is 1, which means that the equation for the given function would be y = x + 2

Now we observe Function B. we see that the Function B starts from the origin.

If we observe the numbers in the table, we can see that y grows faster than x.

The function A has the same rate of change for x and y which is 1.

This means that Function B has the greater rate of change.

Therefore Function B has the greater rate of change.

How To Solve Exercise 3.3 Functions In Envision Math Grade 8

Page 175 Exercise 7 Answer

Given :

Use Functions To Model Relationships Page 175 Exercise 7 Answer

For initial value we have to find the ordered pair which has x = 0.Function A has the initial value of 4.

When we have a function written as an equation y = mx + b, we need to look at b and that is the initial value.

This means that Function B has the initial value of 3.

Function A has the greater value.

Function A has the greater initial value.

Functions And Modeling Relationships Grade 8 Exercise 3.3 Envision Math

Envision Math Grade 8 Volume 1 Student Edition Solutions Chapter 3 Use Functions To Model Relationships Exercise 3.3 Page 175 Exercise 8 Answer

Given :

Use Functions To Model Relationships Page 175 Exercise 8 Answer?


We observe Function A, we see that y changes is not always the same. This means that the given function is nonlinear.

If we observe the graph of Function B, we can see that it is a straight line which means that this function is linear.

Function A is nonlinear and Function B is linear.


Page 175 Exercise 10 Answer

Given :

Use Functions To Model Relationships Page 175 Exercise 10 Answer


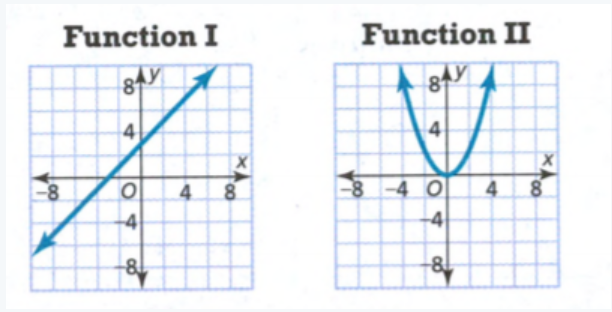
We observe that the graph of Function A is a straight line and therefore, it is linear.

The graph of Function B is a curve, therefore, it is nonlinear.

Function A is linear and Function B is nonlinear.

Envision Math Grade 8 Chapter 3 Exercise 3.3 Solutions

Envision Math Grade 8 Volume 1 Student Edition Solutions Chapter 3 Use Functions To Model Relationships Exercise 3.3 Page 175 Exercise 12 Answer

Given:

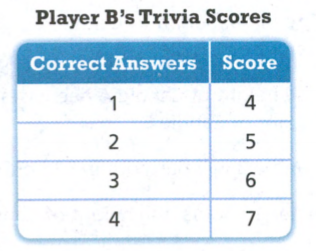
The function y = 4x + 3 describes Player A’s scores in a game of trivia.

Use Functions To Model Relationships Page 175 Exercise 12 Answer


If we look at the given function, we observe that the initial value is 3 for Player A. The coefficient of x shows how much points he earns when the question is answered correctly, which is 4 per question answered correctly.

For Player B we can see that for every correct answer his score goes up by 1, which means that the points Player B gets when he answers questions correctly is 1. We subtract 1 form the first value of Score and that will be the initial value.

Player A earns 4 points per question answered correctly and Player B earns 1 point per question answered correctly.

Player A earns 4 points per question answered correctly and Player B earns 1 point per question answered correctly.


Page 176 Exercise 13 Answer

Given:

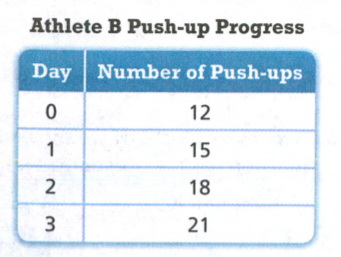
Athlete A can do 16 push-ups to start, and increase his total by 2 each day.

Use Functions To Model Relationships Page 176 Exercise 13 Answer


For Athlete A, the initial value is 16 push-ups that is already given, We look at the table for Athlete B, we see that on the first day, he was only able to do 12 push-ups.

Initial value in this situation tells us how many push-ups could each of them do before they started to train.

Therefore initial value in this situation tells us how many push-ups could each of them do before they started to train.

Envision Math 8th Grade Exercise 3.3 Step-By-Step Functions Solutions

Envision Math Grade 8 Volume 1 Student Edition Solutions Chapter 3 Use Functions To Model Relationships Exercise 3.3 Page 176 Exercise 14 Answer

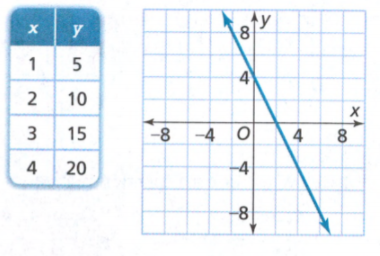
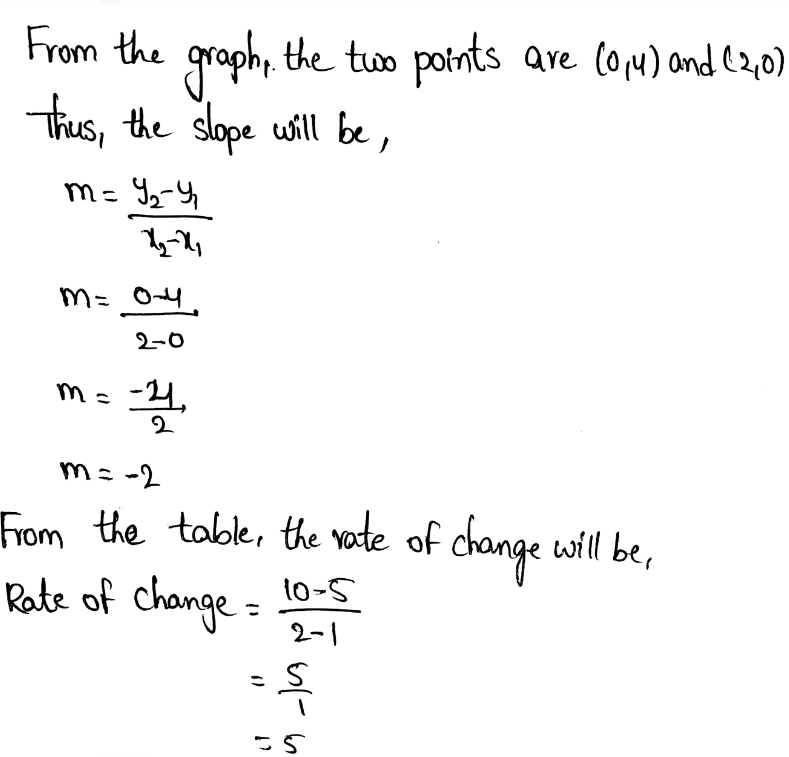
The equation y = 4x − 2 and the table and graph shown at the right describe three different linear functions. We need to find which function has the greatest rate of change and which has the least.

use Functions To Model Relationships Page 176 Exercise 14 Answer

Use Functions To Model Relationships Page 176 Exercise 14 Answer Image

The given equation is y = 4x − 2

When,

x = 1 ⇒ y = 4 − 2 = 2

x = 2 ⇒ y = 8 − 2 = 6

x = 3 ⇒ y = 12 − 2 = 10

x = 4 ⇒ y = 16 − 2 = 14

The rate of change here is,

Rate of change = \(\frac{6-2}{2-1}\)

= \(\frac{4}{1}\)

= 4

Rate of change is more for the given table and very less for the given graph.

The given table function has the greatest rate of change and the given graph has the least.

Envision Math Grade 8 Volume 1 Chapter 3 Functions Model Relationships Exercise 3.1 Solutions

Envision Math Grade 8 Solutions for Functions and Modeling Relationships – Exercise 3.1

Envision Math Grade 8 Volume 1 Chapter 3 Functions Model Relationships Exercise 3.1 Solutions Page 159 Exercise 1 Answer

A relation is said to be a function if it relates one value of its domain to one value of its range.

Also, is one input has only one output, the relation is a function.

Jesse plan is to sell 50 tickets but it will not fulfill the requirement of $500 as different amount of tickets have different values.

In case of Alexis plan, the target will be achieved if each person sells the tickets of $50 .

Alexis plan would be recommended to fulfill the requirement.

Envision Math Grade 8 Volume 1 Chapter 3 Exercise 3.1 Functions Solutions

Envision Math Grade 8 Volume 1 Chapter 3 Functions Model Relationships Exercise 3.1 Solutions Page 159 Exercise 1 Answer

  • A relation is said to be a function if it relates one value of its domain to one value of its range.
  • Also, is one input has only one output, the relation is a function.
  • Jesse plan is to sell 50 tickets per head which will get them approximately $400 from each person.
  • In case of Alexis plan, a person should sell the tickets of $50 and they will be able to collect $500 from 10 persons.
  • Plans are different as they have different strategies to collect the amount whereas the similarity is that they have to collect equal amount, i.e. $500 .

Envision Math Grade 8 Volume 1 Student Edition Solutions Chapter 3 Use Functions To Model Relationships Exercise 3.1

Envision Math Grade 8 Volume 1 Chapter 3 Functions Model Relationships Exercise 3.1 Solutions Page 160 Exercise 1 Answer

  • A relation is said to be a function if it relates one value of its domain to one value of its range.
  • Also, is one input has only one output, the relation is a function.
  • Different weights of the boxes have different cost of shipping ,i.e. the cost of shipping has unique values.
  • Yes. There is a relation between weight of the box and the cost to ship the box.

Envision Math Grade 8 Exercise 3.1 Model Relationships Functions

Envision Math Grade 8 Volume 1 Chapter 3 Functions Model Relationships Exercise 3.1 Solutions Page 160 Exercise 1 Answer

The given points are (4,24),(5,35),(8,24),(2,20),(9,27)

Find: complete arrow diagram and explain

The completed arrow diagram is:

Use Functions To Model Relationships Page 160 Exercise 1 Answer

Each side length has one line connected to it. So, area is a function of side length.

The required arrow diagram is:

Use Functions To Model Relationships Page 160 Exercise 1 Answer

Yes. The area of the brochure is a function of the side length.

Envision Math Grade 8 Volume 1 Chapter 3 Functions Model Relationships Exercise 3.1 Solutions Page 161 Exercise 3 Answer

A relation is said to be a function if it relates one value of its domain to one value of its range.

Also, is one input has only one output, the relation is a function.

Each cost of parking has different timings of parking by which it can be determined that for how much time the vehicle was parked according to the amount paid.

Heather is correct because this relation is a function.

Envision Math Grade 8 Volume 1 Chapter 3 Functions Model Relationships Exercise 3.1 Solutions Page 160 Exercise 1 Answer

A relation is said to be a function if it relates one value of its domain to one value of its range.

Also, is one input has only one output, the relation is a function.

If there are two outputs of the input 24, then it is not a function.

The given relation is not a function because one input has two output.

Envision Math Grade 8 Volume 1 Chapter 3 Functions Model Relationships Exercise 3.1 Solutions Page 162 Exercise 2 Answer

Given

Use different representation of a relation to determine whether the relation is a function?

We can use diagrams and tables to determine whether relation is function.

When we use diagrams than we simply have to look if there are multiple arrows connected to the same output.

When, we use tables again we simply have to look if the given inputs always give different outputs or the relation is a not function.

We use Diagram and table representations of a relation to determine whether the relation is a function.

Functions And Modeling Relationships Grade 8 Exercise 3.1 Envision Math

Envision Math Grade 8 Volume 1 Chapter 3 Functions Model Relationships Exercise 3.1 Solutions Page 162 Exercise 3 Answer

Given

The relation is always a function and function is always a relation?

A relation does not always have to be a function, but a function is always a relation.

When we have some relation we can have multiple inputs give out different outputs, but the functions always give different outputs for every single inputs.

A relation does not always a function, but a function is always a relation.

Envision Math Grade 8 Volume 1 Chapter 3 Functions Model Relationships Exercise 3.1 Solutions Page 162 Exercise 5 Answer

Given

Inputs are 3,4,1,5,2

Outputs are 4,6,2,8,5

Find the relation is function or not?

We can see from the table each of the inputs corresponds to exactly one output. This means that given relation is a function.

This relation is a function.

Envision Math Grade 8 Volume 1 Chapter 3 Functions Model Relationships Exercise 3.1 Solutions Page 162 Exercise 6 Answer

Given

Inputs are 3,4,1,5,2,6

Outputs are 16,25,9,36,4,1

Find the relation is function or not?

We can see from the table each of the inputs corresponds to exactly one output. This means that given relation is a function.

There is 6 different x- coordinates with 6 different corresponding y- coordinates.

This relation is a function. Because for every input exactly one output.

Envision Math Grade 8 Chapter 3 Exercise 3.1 Solutions

Envision Math Grade 8 Volume 1 Chapter 3 Functions Model Relationships Exercise 3.1 Solutions Page 163 Exercise 7 Answer

Given

Inputs are 1,2,3,4,5

Outputs are 19,23,23,29,31

Find the relation is function or not?

Here we are going to show how to make an arrow diagram.

1 → 19

2 → 23

3 → 23

4 → 29

5 → 31

Note that we put these values into a diagrams and in the right diagram with outputs we are going to have only 1 value 23.

Arrow diagram:

1 → 19

2 → 23

3 → 23

4 → 29

5 → 31

Given

Inputs are 1,2,3,4,5

Outputs are 19,23,23,29,31

Find the relation is function or not?

Here we are going to show how to make an arrow diagram.

1 → 19

2 → 23

3 → 23

4 → 29

5 → 31

A relation is an input if each input corresponds to only input.

The input 1 only corresponds to 19, 2 only corresponds to 23, 3 only corresponds to 23, 4 only corresponds to 29, 5 only corresponds to 31.

Therefore, the relation is a function. Each input corresponds to only one output.

Note that two inputs have the same output but this has no effect on whether it is a function. Repeating outputs do not determine if relation is a function, only repeating inputs determine if it is a function.

The relation is a function since each input corresponds to only one output.

Envision Math Grade 8 Volume 1 Chapter 3 Functions Model Relationships Exercise 3.1 Solutions Page 163 Exercise 8 Answer

Given

Inputs are -2,-7,-3,3,-9,-6

Outputs are 2,1,9,4,5,8

Find the relation is function or not?

Given relation is a function because there is exactly one input corresponding to one output.

The relation is a function because there is exactly one input corresponding to one output.

Envision Math 8th Grade Exercise 3.1 Step-By-Step Functions Solutions

Envision Math Grade 8 Volume 1 Chapter 3 Functions Model Relationships Exercise 3.1 Solutions Page 163 Exercise 10 Answer

Given

Inputs are 0,5,10,15,20,25

Outputs are 15,20,50,80,100,100

Find the relation is function or not?

Given relation is not a function because there is two different inputs corresponding to same output.

The input 20 and 25 corresponds to the same output 100.

The relation is not a function .

Envision Math Grade 8 Volume 1 Chapter 3 Functions Model Relationships Exercise 3.1 Solutions Page 163 Exercise 11 Answer

Given

Inputs are 3,4,5,6,7,8

Outputs are 726,759,749,792,804,835

Find the relation is function or not?

Given relation is a function because there is exactly one inputs corresponding to exactly one output.

The relation is a function .

Envision Math Grade 8 Volume 1 Chapter 3 Functions Model Relationships Exercise 3.1 Solutions Page 164 Exercise 13 Answer

Given

Inputs are 3,7,15,16

Outputs are 6,14,6,14

Find the relation is function or not?

Here we are going to show how to make an arrow diagram.

3 → 6

7 → 14

15 → 6

16 → 14

Note that we put these values into a diagrams and in the right diagram with outputs we are going to have only one value 14 and 6.

Arrow diagram of P:

3 → 6

7 → 14

15 → 6

16 → 14

Given

Inputs are 6,6,14,14

Outputs are 7,16,3,15

Find the relation is function or not?

Here we are going to show how to make an arrow diagram.

6 → 7

6 → 16

14 → 3

14 → 15

Note that we put these values into a diagrams and in the right diagram with outputs we are going to have only 1 value 6 and 14.

Arrow diagram:

6 → 7

6 → 16

14 → 3

14 → 15

Given

Inputs are 6,6,14,14

Outputs are 7,16,3,15

Find the relation is function or not?

6 → 7         3 → 6

6 → 16       7 → 14

14 → 3       15 → 6

14 → 15     16 → 14

Neither of these two relations are functions because for a relation to be a function, each input must correspond to exactly one output.

Neither of two given relations are functions.

How To Solve Exercise 3.1 Functions In Envision Math Grade 8

Envision Math Grade 8 Volume 1 Chapter 3 Functions Model Relationships Exercise 3.1 Solutions Page 164 Exercise 14 Answer

Given

Inputs are 1,6,12,18

Outputs are 2,12,24,36

Find the relation is function or not?

Here we are going to show how to make an arrow diagram.

1 → 2

6 → 12

12 → 24

18 → 36

If we look at the ordered pairs, than we can simply see that there is exactly one input of number 12 and on the diagram we can see that he drew 2 lines from the number 12 in inputs. This means that the mostly likely swapped x-coordinate with y-coordinate in one of the ordered pairs.

He most likely swapped x-coordinate with y-coordinate in one of the ordered pairs.

Envision Math Grade 8 Chapter 3 Exercise 3.1 Practice Problems

Envision Math Grade 8 Volume 1 Chapter 3 Functions Model Relationships Exercise 3.1 Solutions Page 164 Exercise 15 Answer

Given

Inputs are 49,61,10,76,23

Outputs are 13,36,27,52,52

Find the relation is function or not?

When we have to write ordered pairs from the diagram than we simply write the inputs which are in the left diagram as x-coordinate and the corresponding outputs as y-coordinate.

(49,13),(61,36),(10,27),(76,52),(23,52)

Given relation is a function because for it to be a function each input must correspond to exactly one output.

When we have to write ordered pairs from the diagram than we simply write the inputs which are in the left diagram as x-coordinate and the corresponding outputs as y-coordinate.

(49,13),(61,36),(10,27),(76,52),(23,52)

Given relation is a function.

Envision Math Grade 8 Solutions For Chapter 3 Use Functions to Model Relationships

Use Functions To Model Relationships – Envision Math Grade 8 Volume 1 Chapter 3

Envision Math Grade 8 Volume 1 Chapter 3 Page 157 Exercise 1 Answer

Slope of a line is the measure of the steepness and direction of a line.

Slope can be calculated by dividing the change in y by the change in x.

The formula of slope is:

\(m=\frac{y_2-y_1}{x_2-x_1}\)

The slope is the ratio of the vertical change to the horizontal change of a line.

Envision Math Grade 8 Volume 1 Chapter 3 Page 157 Exercise 2 Answer

A function can be given in the form of the equation representing slope-intercept form.

The form of equation which can be give is: y = mx + b

Where, m is the slope and b is the intercept.

The relation , y = mx + b is a proportional relationship between x and y if the intercept is equals to zero.

The relationship that can be modeled by the equation y = mx is a proportional relationship.

Envision Math Grade 8 Volume 1 Student Edition Solutions Chapter 3 Use Functions To Model Relationships Topic 3

Envision Math Grade 8 Chapter 3 Use Functions To Model Relationships Solutions

Envision Math Grade 8 Volume 1 Chapter 3 Page 157 Exercise 3 Answer

A function can be given in the form of the equation representing slope-intercept form.

The form of equation which can be give is: y = mx + b

Where, m is the slope and b is the intercept.

The value of b gives y-intercept which is the point at which the line intersects the y-axis of the graph.

The y-value at which a line of a graph crosses the y-axis is called the y-intercept.

Envision Math Grade 8 Volume 1 Chapter 3 Page 157 Exercise 4 Answer

The function is a relation between the set of input to the set of output.

A function can be given in the form of the equation representing slope-intercept form.

The form of linear equation which can be give is: y = mx + b

Where, m is the slope and b is the intercept.

An equation written in the form y = mx + b is called the linear equation.

Envision Math Grade 8 Chapter 3 Answers

Envision Math Grade 8 Volume 1 Chapter 3 Page 157 Exercise 5 Answer

The given points are: (2,2) and (3,0)

We need to find the slope and the y−intercept of a line that passes through these points.
Use Functions To Model Relationships Page 157 Exercise 5 Answer

The slope of line through the points (2,2)and (3,0) = −2

y-intercept of line through the points (2,2) and (3,0) = 6

Envision Math Grade 8 Volume 1 Chapter 3 Page 157 Exercise 6 Answer

The given points are: (1,5) and (4,10)

We need to find the slope and y−intercept of a line that passes through these points.
Use Functions To Model Relationships Page 157 Exercise 6 Answer

Slope of line through the points (1,5) and (4,10) = 1.67

y-intercept of line through the points (1,5) and (4,10) = 3.33

Use Functions To Model Relationships Grade 8 Envision Math Solutions

Envision Math Grade 8 Volume 1 Chapter 3 Page 157 Exercise 7 Answer

The given points are: (8,2) and (−8,6)

We need to find the slope and y−intercept of a line that passes through these points.

Use Functions To Model Relationships Page 157 Exercise 7 Answer

Slope of line through the points (8,2) and (−8,6) = −0.25

y-intercept of line through the points (8,2) and (−8,6) = 4

How To Solve Functions To Model Relationships Envision Math Grade 8

Envision Math Grade 8 Volume 1 Chapter 3 Page 157 Exercise 8 Answer

Given that, Jenna’s mother is shopping for energy drinks in 12-ounce bottles for Jenna’s soccer team. Store A sells a case of 18bottles for $10. Store B sells a case of 12 bottles for $6. We need to find which store sells the drinks for less. Also, we need to use the given graph to compare the unit costs of the drinks.

Finding the unit rate of store A, we get,

\(\frac{10}{18}=\frac{5}{9}\)

Finding the unit rate of store B, we get,

\(\frac{6}{12}=\frac{1}{2}\)

Plotting the given proportional relationships in the given graph now, we get,

Use Functions To Model Relationships Page 157 Exercise 8 Answer

The line for the proportional relationship of store A is red in color.

The line for the proportional relationship of store B is blue in color.

Here, the line of store B is lower than A.

This means that store B sells the drinks in a lesser price.

Store B sells the drinks for less.

Envision Math 8th Grade Functions And Relationships Exercises

Envision Math Grade 8 Volume 1 Chapter 3 Page 157 Exercise 9 Answer

We need to write the equation for the graph of the line shown.

Use Functions To Model Relationships Exercise 157 Exercise 9 Answer

For finding the y-intercept, the value of x = 0

Analyzing the graph for which value of y, the value of x = 0

Thus, the y-intercept is −6

Find two points on the graph to find the slope of the line.
Use Functions To Model Relationships Page 157 Exercise 9 Answer

The equation of the slope-intercept form be,

y = mx + b

Here, m is the slope and b is the y-intercept.

Thus, we get,

y = 4x − 6

The equation for the graph of the line shown is y = 4x − 6

Envision Math Grade 8 Chapter 3 Solution Guide

Envision Math Grade 8 Volume 1 Chapter 3 Page 158 Exercise 1 Answer

We need to find whether the given table, arrow diagram, graph, ordered pairs, and the equation is a function or not.

Use Functions To Model Relationships Page 158 Exercise 1 Answer Image 1

TABLE:

In the given table, the same inputs are having two different outputs.

Here, the value x = 2 corresponds to both y = 6,8

Thus, it is not a function.

ORDERED PAIRS:

In the given ordered pairs, each input is having unique outputs.

Thus, the relation is a function.

EQUATION:

Graphing the given equation, y = 3x − 12, we get,

Use Functions To Model Relationships Page 158 Exercise 1 Answer Image 2

The obtained graph is a straight line. Thus, it is a function.

ARROW DIAGRAM:
In the given diagram, each input corresponds to only one output.

Thus, it is a function.

GRAPH:

In the given graph, the value x corresponds to two y values.

Thus, it is not a function.

The given arrow diagram ordered pairs, and the equation is a function.

The given table and the graph are NOT a function.
Use Functions To Model Relationships Page 158 Exercise 1 Answer Image 3

Envision Math Grade 8 Volume 1 Chapter 2 Analyze And Solve Linear Equations Solutions

Envision Math Grade 8 Volume 1 Chapter 2 Analyze And Solve Linear Equations Solutions

Page 147 Question 1 Answer

We need to explain how we can analyze connections between linear equations and use them to solve problems.

Equations that consist of degree one are said to be linear equations.

Linear equations will always result in a straight line when plotted on the graph.

The highest degree of the variables present in the linear equations must be one.

A linear equation must have a constant in it.

Linear equations can be solved by doing arithmetical operations on both sides of the equation. This will not affect the balance of the equation.

It can also be solved graphically.

Some of the examples of linear equations are,

5x + 2y = 3

\(2 y=\frac{15}{2}\)

15x – 5 = 0

We can analyze connections between linear equations by solving them arithmetically or by graphically, and we can also use them to solve real-life problems.

Envision Math Grade 8 Volume 1 Student Edition Solutions Chapter 2 Analyze And Solve Linear Equations Topic 2 Review Questions

Envision Math Grade 8 Volume 1 Chapter 2 Linear Equations Solutions

Envision Math Grade 8 Volume 1 Chapter 2 Analyze And Solve Linear Equations Solutions Page 147 Exercise 3 Answer

The slope intercept form of a line is y = mx + b where them is the slope of the line and the b is the y−intercept of the line.

Example:

If we look at the graph of given line we can see the equation y = −2x + 3.

The slope of the given line is −2 and that means that our graph of the line will be decreasing. The y− intercept is 3 which tells us where the line will cross the y−axis.

Analyze And Solve Linear Equations Page 147 Exercise 3 Answer
The slope intercept form of a line is y = mx + b. The variable m in the equation stands for the slope. The variable bin the equation stands for the y−intercept.


Page 147 Exercise 1 Answer

Given that, Paddleboats rent for a fee of $25, plus an additional $12 per hour. We need to write the equation, in y = mx + b form, represents the cost to rent a paddleboat for x hours. Also, we have to explain how you write the equation. Use vocabulary words in your explanation.

The equation of the line is of the form y=mx+b

Here, b is a constant.

x is the number of hours while y is the cost to rent a paddleboat.

Given that, the initial investment is $25

The additional cost is $12 per hour.

Thus, the equation will be

y = 12x + 25

The equation is y = 12x + 25. Here, y is the cost to rent a paddleboat where x is the number of hours.


Envision Math Grade 8 Volume 1 Chapter 2 Analyze And Solve Linear Equations Solutions Page 148 Exercise 1 Answer

The given equation is 2x + 6x = 1000

We need to solve the given equation and find the value of x

Analyze And Solve Linear Equations Page 148 Exercise 1 Answer
The value of x = 125


Page 148 Exercise 2 Answer

The given equation is \(2 \frac{1}{4} x+\frac{1}{2} x=44\)

We need to solve the given equation and find the value of x
Analyze And Solve Linear Equations Page 148 Exercise 2 Answer

The value of x = 16

Envision Math Grade 8 Analyze And Solve Linear Equations Chapter 2 Answers

Envision Math Grade 8 Volume 1 Chapter 2 Analyze And Solve Linear Equations Solutions Page 148 Exercise 3 Answer

The given equation is −2.3x − 4.2x = −66.3

We need to solve the given equation and find the value of x

Analyze And Solve Linear Equations Page 148 Exercise 3 Answer
The value of x = 10.2


Page 148 Exercise 4 Answer

Given that, Javier bought a microwave for $105. The cost was 30% off the original price. We need to find the price of the microwave before the sale.

Let x be the price of the microwave before the sale.

Analyze And Solve Linear Equations Page 148 Exercise 4 Answer

The price of the microwave before the sale is $150


Envision Math Grade 8 Volume 1 Chapter 2 Analyze And Solve Linear Equations Solutions Page 148 Exercise 3 Answer

The given equation is 9x − 5x + 18 = 2x + 34

We need to solve the given equation and find the value of x
Analyze And Solve Linear Equations Page 148 Exercise 3 Answer Image

The value of x = 8

Analyze And Solve Linear Equations Solutions Grade 8 Envision Math

Page 149 Exercise 1 Answer

The given equation is 4(x+4) + 2x = 52

We need to solve the given equation and find the value of x

Analyze And Solve Linear Equations Page 149 Exercise 1 Answer

The value of x = 6


Envision Math Grade 8 Volume 1 Chapter 2 Analyze And Solve Linear Equations Solutions Page 149 Exercise 2 Answer

The given equation is 8(2x+3x+2) = −4x + 148

We need to solve the given equation and find the value of x

Analyze And Solve Linear Equations Page 149 Exercise 2 Answer
The value of x = 3


Page 149 Exercise 3 Answer

Given that, Justin bought a calculator and a binder that were both 15% off the original price. The original price of the binder was $6.20. Justin spent a total of $107.27. We need to find the original price of the calculator.

The price of the binder at which Justin bought is,

\(6.20 \times \frac{100-15}{100}=6.20 \times \frac{85}{100}\)

= \(\frac{527}{100}\)

= 5.27

The total price spent by Justin is,

5.27 + x = 107.27

x = 102

This x be the discounted price of the calculator.

Therefore, the calculator’s original price will be,

Analyze And Solve Linear Equations Page 149 Exercise 3 Answer

The original price of the calculator is $120

Envision Math Grade 8 Chapter 2 Solutions For Linear Equations

Envision Math Grade 8 Volume 1 Chapter 2 Analyze And Solve Linear Equations Solutions Page 149 Exercise 1 Answer

The given equation is x + 5.5 + 8 = 5x − 13.5 − 4x

We need to solve the given equation and find the value of x

Analyze And Solve Linear Equations Page 149 Exercise 1 Answer Image
The equation has no solutions.

The given equation doesn’t have any solutions.

Envision Math Grade 8 Chapter 2 Practice Problems Solutions

Page 149 Exercise 2 Answer

The given equation is \(4\left(\frac{1}{2} x+3\right)=3 x+12-x\)

We need to solve the given equation and find the value of x
Analyze And Solve Linear Equations Page 149 Exercise 2 Answer Image

The given equation doesn’t have any solutions.


Envision Math Grade 8 Volume 1 Chapter 2 Analyze And Solve Linear Equations Solutions Page 149 Exercise 4 Answer

Given that, the weight of Abe’s dog can be found using the expression 2(x+3), where x is the number of weeks. The weight of Karen’s dog can be found using the expression 3(x+1), where x is the number of weeks. We need to determine when will the dogs ever be the same weight.

Equating both the expressions, we get,

Analyze And Solve Linear Equations Page 149 Exercise 4 Answer
The dogs be the same weight after 3 weeks.


Page 150 Exercise 2 Answer

Given that, A 16-ounce bottle of water from Store A costs $1.28. The cost in dollars, y, of a bottle of water from Store B is represented by the equation y = 0.07x, where x is the number of ounces. We need to find the cost per ounce of water at each store. Also, find which store’s bottle of water costs less per ounce.

Cost of one ounce of water at store A,

= \(\frac{1.28}{16}\)= 0.08 dollars per ounce

Cost of one ounce of water at store B,

y = 0.07x

y = 0.07(1)

y = 0.07 dollars per ounce

Therefore, store B’s bottle of water costs less per ounce.

Store B’s bottle of water costs less per ounce.

How To Solve Linear Equations In Envision Math Grade 8 Chapter 2

Envision Math Grade 8 Volume 1 Chapter 2 Analyze And Solve Linear Equations Solutions Page 151 Exercise 2 Answer

Given that, A mixture of nuts contains 1 cup of walnuts for every 3 cups of peanuts.

We need to graph the line.

The linear equation formed from the given data is

y = 3x

Graphing the given equation, we get,

Analyze And Solve Linear Equations Page 151 Exercise 2 Answer

The graph is,

Analyze And Solve Linear Equations Page 151 Exercise 2 Answer


Page 152 Exercise 1 Answer

We need to graph the line with the equation \(y=\frac{1}{2} x-1\)

Finding two points to draw the line,
Analyze And Solve Linear Equations Page 152 Exercise 1 Answer Image

Plot both the points (0, -1) and (2, 0) on the graph and connect them together with the line.

The graph will be,

Analyze And Solve Linear Equations Page 152 Exercise 1 Answer

The graph of the equation is,

Analyze And Solve Linear Equations Page 152 Exercise 1 Answer

Envision Math 8th Grade Step-By-Step Linear Equations Solutions

Envision Math Grade 8 Volume 1 Chapter 2 Analyze And Solve Linear Equations Solutions Page 153 Exercise 1 Answer

Given that, each block below shows an equation and a possible solution. We need to shade a path from START to FINISH. Also, follow the equations that are solved correctly. You can only move up, down, right, or left.

Analyze And Solve Linear Equations Page 153 Exercise 1 Answer Image 1

Substituting each value in its corresponding equation, we get,

x = 2 ⇒ 2x + 3 = 7

2(2) + 3 = 7

4 + 3 = 7

7 = 7

TRUE

y = −1 ⇒ 9(−1)−1 = −10

−10 = −10

TRUE

t = 2 ⇒ 5(2) + 1 = 9

11 ≠ 9

FALSE

x = −1 ⇒ −11(−1) + 12 = 1

23 ≠ 1

FALSE

Repeat the same in the second row, we get,

p = −7 ⇒ 19−4(−7) = 9

19 + 28 = 9

47 ≠ 9

FALSE

j = 60 ⇒ 30−60 = 90

−30 ≠ 90

FALSE

m = 7 ⇒ 14 + 3(7) = 35

35 = 35

TRUE

h = 4 ⇒ 6(4)−1 = 25

23 ≠ 25

FALSE

Repeat the same in the third row, we get,

t = 5 ⇒ 20(5)−1 = 95

99 ≠ 95

FALSE

q = 3 ⇒ 20−3 = 17

17 = 17

TRUE

w = −1 ⇒ −4(−1) + 7 = 11

11 = 11

TRUE

a = 2 ⇒ −2 + 15 = 13

13 = 13

TRUE

Repeat the same in the fourth row, we get,

y = 4 ⇒ 7(4) + 4 = 32

32 = 32

TRUE

y = 6 ⇒ 23 = 1 + 4(6)

23 ≠ 25

FALSE

r = −9 ⇒ −9(−9)−4 = −85

77 ≠ −85

FALSE

x = −25 ⇒ 100 − 4(−25) = 0

200 ≠ 0

FALSE

Repeat the same in the fifth row, we get,

b = −4 ⇒ −6(−4) + 27 = 3

51 ≠ 3

FALSE

\(z=\frac{1}{2} \Rightarrow 2\left(\frac{1}{2}\right)+1=0\)

FALSE

x = −1 ⇒ 47−2(−1) = 45

49 ≠ 45

FALSE

k = 6 ⇒ −12 + 9(6) = 42

42 = 42

TRUE

The correct ones are marked as “T” while the incorrect ones are marked as “F”.
Analyze And Solve Linear Equations Page 153 Exercise 1 Answer Image 2

Envision Math Grade 8 Volume 1 Student Edition Solutions Chapter 2 Analyze And Solve Linear Equations Exercise 2.9

Envision Math Grade 8 Volume 1 Student Edition Solutions Chapter 2 Analyze And Solve Linear Equations Exercise 2.9

Page 141 Exercise 1 Answer

Given

statement

To find/solve

Construct an argument to defend Xiu’s statement.

A y-intercept or vertical intercept is a point where the graph of a function or relation intersects the y-axis of the coordinate system. These points satisfy x = 0.

Xiu stated correctly that they passed the one-mile mark couple of minutes ago because they did not start from the sea level, but were already 2,080 ft above the sea level.

The starting height was 2,080 ft, so Xiu is correct.

The starting height was 2,080 ft, so Xiu is correct.

A y-intercept or vertical intercept is a point where the graph of a function or relation intersects the y-axis of the coordinate system. These points satisfy x=0.

Jon knew that the Mountain Tram is moving at 800 vertical ft/min and multiplied that by the minutes that are needed to reach the 1 mile point. We know that

1 mile is equal to 5,280 ft.

Now we get,

800 × 6.5 = 5200

He was correct about that part but forgot that they started at 2,080 ft above the sea level.

He forgot that they started at 2,080 ft above the sea level.

He forgot that they started at 2,080 ft above the sea level.

Envision Math Grade 8 Volume 1 Student Edition Solutions Chapter 2 Analyze And Solve Linear Equations Exercise 2.9

Page 141 Exercise 1 Answer

We need to find whether there is a proportional relationship between x and y.

Also, check whether the equation y = mx represents the path of the tram or not.

We can partly use given equation y = mx because the tram starts moving from 2,080ft above the sea level and that must be added to the equation.

So now the new equation would look something like y = mx + b

We can use it but have to add the starting value to the equation.

Thus, there won’t be any proportional relationships that exists.

This is because the value of y depends on the value of both x and b

We can use the equation y = mx but we have to add the starting value to the equation. i.e., y= mx + b

Envision Math Grade 8 Volume 1 Chapter 2 Exercise 2.9 Linear Equations Solutions

Envision Math Grade 8 Volume 1 Student Edition Solutions Chapter 2 Analyze And Solve Linear Equations Exercise 2.9 Page 142 Exercise 1 Answer

Given

Analyze And Solve Linear Equations Page 142 Exercise 1 Answer
To find/solve

Write a linear equation in slope-intercept form.

First, we have to look at the y-intercept to find out from which value has the graph started.

The y-intercept is 2

Secondly, we have to find the slope of the given line. To find the slope we are going to use two points on the graph that we can read which are (4,5) and (8,8).

Analyze And Solve Linear Equations Page 142 Exercise 1 Answer Image

Now the equation is y = 0.75x + 2.

Hence, the y-intercept is 2

and the slope is 0.75

The equation is y = 0.75x + 2.

Envision Math Grade 8 Chapter 2 Exercise 2.9 Solutions

Page 143 Exercise 2 Answer

Given

Analyze And Solve Linear Equations Page 143 Exercise 2 Answer Image 1

To find/solve

What is an equation for the line shown.

First, we have to find the y-intercept of the given line.

The y-intercept is 2.

Secondly, we have to find the slope of the given line. We have to use two points which are (4,0) and (0,2)

Analyze And Solve Linear Equations Page 143 Exercise 2 Answer Image

The equation is y = -0.5x + 2.

The equation is y = -0.5x + 2.

Given

Analyze And Solve Linear Equations Page 143 Exercise 2 Answer Image 2

To find/solve

Graph the line.

When we look at the equation of given line we can see that it has -5. This means that the y-intercept is -5.

The slope of given line is 1/3.
Analyze And Solve Linear Equations Page 143 Exercise 2 Answer Image 3
We have to find the y-intercept and the slope first, and simply graph the line after that.

We have to find the y-intercept and the slope first, and simply graph the line after that.

Envision Mathb8th Grade Exercise 2.9 Step-By-Step Linear Equation Solutions

Envision Math 8th Grade Exercise 2.9 Step-By-Step Linear Equation Solutions

Envision Math Grade 8 Volume 1 Student Edition Solutions Chapter 2 Analyze And Solve Linear Equations Exercise 2.9 Page 144 Exercise 1 Answer

Given

Statement

To find/solve

Equation of a line.

A y-intercept or vertical intercept is a point where the graph of a function or relation intersects the y-axis of the coordinate system. These points satisfy x = 0.

The equation for a line of a non proportional relationship is y = mx + b

where m is the slope and b is the y-intercept.

The equation is y = mx + b

The equation is y = mx + b

Envision Math Grade 8 Exercise 2.9 Solution Guide

Page 144 Exercise 4 Answer

Given

Analyze And Solve Linear Equations Page 144 Exercise 4 Answer

To find/solve

Which student is correct.

A y-intercept or vertical intercept is a point where the graph of a function or relation intersects the y-axis of the coordinate system. These points satisfy x=0.

First we look at the graph to see what is the y-intercept.

The y- intercept is 5.

Now that we have found the intercept we can see that the line is decreasing which means that the slope is negative.

George is correct.

Hence, we found out that George is correct.

How To Solve Exercise 2.9 Linear Equations In Envision Math Grade 8

Envision Math Grade 8 Volume 1 Student Edition Solutions Chapter 2 Analyze And Solve Linear Equations Exercise 2.9 Page 144 Exercise 5 Answer

Given

Analyze And Solve Linear Equations Page 144 Exercise 5 Answer Image 1
To find/solve

Draw a line to show the relationship between the number of hours the tent is rented, x, and the total cost of the tent,y

Since we know that the set-up fee is $100 then we know that this will be our y-intercept.

The cost per hour is additional $500. This is the slope of given equation. Now we can write whole equation.

y = 500x + 100

Now the graph is obtained by adding 100 to the variable then the graph of given equation will be translated 100 units up on the y-axis.

Analyze And Solve Linear Equations Page 144 Exercise 5 Answer Image 2

We have to find the equation of given line which is y = 500x + 100 and after that simply graph that line.

We have to find the equation of given line which is y = 500x + 100 and after that simply graph that line.

Given
Analyze And Solve Linear Equations Page 144 Exercise 5 Answer Image 3

To find/solve

What is the equation of the line in slope-intercept form?

To find the equation first we have to see the data that we are given in the task. Since it states that the cost of the tent is $500 per hour, that means that this will be our variable.

The set-up fee is in for every tent and it is a one-time pay per tent. This means that we have to add the $100 to the variable.

Now we know how our equation will look like

y = 500x + 100

The equation is y = 500x + 100.

The equation is y = 500x + 100.


Envision Math Grade 8 Volume 1 Student Edition Solutions Chapter 2 Analyze And Solve Linear Equations Exercise 2.9 Page 145 Exercise 6 Answer

Given

Analyze And Solve Linear Equations Page 145 Exercise 6 Answer Image 1

We need to find the y-intercept of the given equation y = 2x + 4. Also, find another point using the slope of the line and daw a line to connect the two points.

If we look at the equation we can see that we have added 4 to the variable and that means that the y-intercept will be 4. The point at which the line will cross y-axis is (0,4).

The slope is positive and that means that the graph will be increasing from left to right.

We will simply start at the y-intercept and move up to 2 points and then we will move 1 point to the right.

Draw a line through points (0,4) and (1,6). This is the line of the given equation.

Graph the given equation and draw a line to connect the obtained two points.

Analyze And Solve Linear Equations Page 145 Exercise 6 Answer image 2

The y -intercept is 4, which means the line crosses the y -axis at the point (0,4)

The slope of the line is positive, so it goes increasing from left to right.Start at the y-intercept. Move up 2units, and then move right 1unit.

You are now at the point (1,6)

Graphing the given equation and plotting the points, we get,

Analyze And Solve Linear Equations Page 145 Exercise 6 Answer image 2


Page 145 Exercise 7 Answer

Given

Analyze And Solve Linear Equations Page 145 Exercise 7 Answer

To find/solve

Write an equation.

We have to use two points from the graph that are visible and one of them will be the y-intercept (0,-3)

The other point we are going to use is (2,-4).

Now to find the slope.

Analyze And Solve Linear Equations Page 145 Exercise 7 Answer Image

The equation is y = -0.5x – 3

The equation is y = -0.5x – 3

Envision Math Exercise 2.9 Linear Equations Detailed Answers

Envision Math Grade 8 Volume 1 Student Edition Solutions Chapter 2 Analyze And Solve Linear Equations Exercise 2.9 Page 145 Exercise 8 Answer

Given

Analyze And Solve Linear Equations Page 145 Exercise 8 Answer

To find/solve

Write an equation.

We have to use two points from the graph that are visible and one of them will be the y-intercept (0,4)

The other point we are going to use is (-1,1).

Now to find the slope.

Analyze And Solve Linear Equations Page 145 Exercise 8 Answer Image

The equation is y = 3x + 4

The equation is y = 3x + 4


Page 145 Exercise 9 Answer

Given

Analyze And Solve Linear Equations Page 145 Exercise 9 Answer

To find/solve

Write an equation.

If we look at the kayak rentals in the task we can see that the cost per hour is $12, and that will be our variable.

As for the $6 deposit, that will happen only once every time someone rents a Kayak.

Now the equation is y = 12x + 6

The equation is y = 12x + 6.

Envision Math Grade 8 Exercise 2.9 Practice Problems

Envision Math Grade 8 Volume 1 Student Edition Solutions Chapter 2 Analyze And Solve Linear Equations Exercise 2.9 Page 145 Exercise 10 Answer

Given

Analyze And Solve Linear Equations Page 145 Exercise 10 Answer Image 1

To find/solve

Graph the equation y = 3x − 5.

In order to graph the given equation, we have to know the slope of the given equation, and they-intercept.

Since we know the y-intercept. We got the one point of the graph which is 0,−5.

Then if we need another equation to draw the graph when the y-coordinate is 0.

0 = 3x − 5

3x = 5

\(x=\frac{5}{3}\)

The graph becomes,

Analyze And Solve Linear Equations Page 145 Exercise 10 Answer Image 2

The two points are (0,−5)and (5/3,0).

The two points are(0,−5) and (5/3,0).

The graph is,

Analyze And Solve Linear Equations Page 145 Exercise 10 Answer Image 2


Envision Math Grade 8 Volume 1 Student Edition Solutions Chapter 2 Analyze And Solve Linear Equations Exercise 2.9 Page 146 Exercise 11 Answer

Given

Analyze And Solve Linear Equations Page 146 Exercise 11 Answer Image 1

To find/solve

What is the correct equation.

Since we know that she had $25 in her bank account at start that means that the y-intercept is in point (0,25). Then the y-intercept is 25

Then she spends $5 every day this means the variable is subtracted by -5

Then the equation is y = −5x + 25.

Then the equation is y = −5x + 25.

Given

Analyze And Solve Linear Equations Page 146 Exercise 11 Answer Image 2

To find/solve

What mistake might Amy have made.

Amy has added only $5 to the variable and that would mean that she had $5 in her account on the start.

This means that she must have used the positive value of slope for the y-intercept as well.

She might have used the positive value of slope as y-intercept.

She might have used the positive value of slope as y-intercept.


Page 146 Exercise 12 Answer

Given

Graph

To find/solve

Write an equation for the line in slope intercept form.

From the graph we get the slope and y-intercept to write the equation.

The y-intercept is 12.25 and then means that we have to add that value to the variable.

To find the slope,

We know that each ticket cost $21, then it will be our slope.

The equation is y = 21x + 12.25

The equation is y = 21x + 12.25

Given

Analyze And Solve Linear Equations Page 146 Exercise 12 Answer

To find/solve

write an equation.

We can write the equation by reading the part where they show us the price of each ticket and the processing fee for each transaction.

As we can see the processing fee will be paid each transaction once and the price of each ticket will be $21, which means that we can order multiple that would give us the equation.

y = 21x + 12.25 which is the same as in the first part of the task.

We have the picture in the task which shows us the price of each ticket and the processing fee for each transaction.

We have the picture in the task which shows us the price of each ticket and the processing fee for each transaction and the equation is y = 21x + 12.25

Given

Graph

To find/solve

Is this graph a good representation of the situation.

Give graph would be a good representation of the situation if no one would buy more than 4 tickets.

Since the line of the graph is shown to the number of 4 tickets, we do not know from the graph how much will we have to pay for more than 4 tickets.

The graph is a good representation if we no one buys more than 4 tickets.

The graph is a good representation if we no one buys more than 4 tickets.


Envision Math Grade 8 Volume 1 Student Edition Solutions Chapter 2 Analyze And Solve Linear Equations Exercise 2.9 Page 146 Exercise 13 Answer

Given

Graph the equation \(y=\frac{2}{5} x-1\)

To find/solve

What should you do first to graph the equation.

A y-intercept or vertical intercept is a point where the graph of a function or relation intersects they-axis of the coordinate system. These points satisfy x = 0.

When we have to graph some equation, then the first thing we want to do is to mark the y-intercept. This will show us where the graph of the line will begin.

Plot a point at the y-intercept.

Plot a point at the y-intercept.


Page 146 Exercise 14 Answer

Given

Analyze And Solve Linear Equations Page 146 Exercise 14 Answer

To find/solve

Write an equation for the line in slope-intercept form.

First, we want to find the y-intercept of the given line. As we can see from the graph the point of the y-intercept is (0,8).

This means that the y-intercept is 8.

Secondly, we want to find the slope of the given line. To do this we have to use two points from the graph that we can read. The first point is going to be the y-intercept and the second will be the x-intercept, which is (4,0).

Analyze And Solve Linear Equations Page 146 Exercise 14 Answer Image

The equation of the line is y = -2x + 8

The equation of the line is y = -2x + 8