
Carnegie Learning Algebra II Student Skills Practice 1st Edition Chapter 4 Skills Practice
Page 363 Problem 1 Answer
To define the average rate of change in our own words
First, the rate of change can generally be expressed as a ratio between a change in one variable relative to a corresponding change in another.
The average rate of change:
The average rate of change can be simply defined as the average rate at which one quantity changes with respect to some other quantity
The average rate of change:
The average rate of change can be simply defined as the average rate at which one quantity changes with respect to some other quantity.
Page 363 Problem 2 Answer
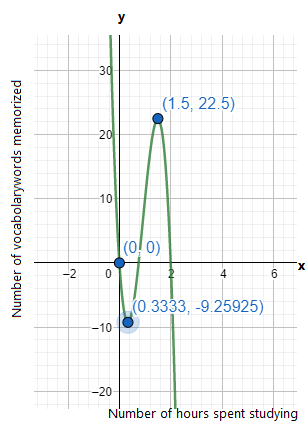
Given: A graph that shows the number of vocabulary words a student can able to memorize based on the amount of time spent studying.

To find how many words does the student knows at the start of the study and we have to locate the position in the graph.
At the start, the student knows 0 vocabulary words and the event is represented by the y-intercept in the origin.
The blue-colored point is the point origin.
At the start, the student knows 0.75 vocabulary words and The blue color represents the origin.
Carnegie Learning Algebra Ii Chapter 4 Exercise 4.1 Solutions
Carnegie Learning Algebra II Student Skills Practice 1st Edition Chapter 4 Exercise 4.1 Skills Practice Page 364 Problem 3 Answer
Given: A graph that shows the number of vocabulary words a student can able to memorize based on the amount of time spent studying.
To find the relative minimum.
In the graph, It has two extrema which are located at x=0.333 and x=1.5

We know that the relative minimum is where the graph attains its lowest point on the domain of the function.
Here at x=0.333 the y-coordinate attains its minimum value.
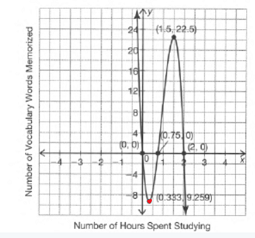
The red colored point represent the relative minimum
The relative minimum is when for 0.33 hours the number of vocabulary words memorized is 9.25 (approximately 9 words).
Page 364 Problem 4 Answer
Given: A graph that shows the number of vocabulary words a student is able to memorize based on the amount of time spent studying.
To find: The minimum amount of time that a student studies before they begin to remember the vocabulary
From the graph, the student took about 0.75 hours before they began to remember the vocabulary.
It is because before 0.75 hours the number of vocabularies that the student memorized is negative which is not possible and negligible.
The number of vocabulary that the student memorized started to increase from 0.75 hours.
The red-colored point represents the estimated location on the graph
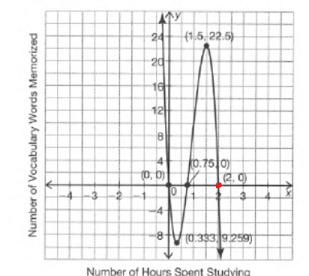
From the graph, the minimum amount of time the student studies before they begin to remember the vocabulary is 0.75 hours
Carnegie Learning Algebra II Student Skills Practice 1st Edition Chapter 4 Exercise 4.1 Skills Practice Page 364 Problem 5 Answer
Given: A graph that shows the number of vocabulary words a student can able to memorize based on the amount of time spent studying.
To find how long the student has to study in order to remember 22 vocabulary words.
In the graph, They coordinate represents the number of hours spent studying and the x coordinate represents the number of vocabulary words memorized.
Here the y-coordinate of 22.5 is almost equal to the 22 vocabularies.
When they-coordinate is 22.5 the x coordinate has a value of 1.5 which implies that the student memorized the approximately 22 vocabularies in 1.5 hours.
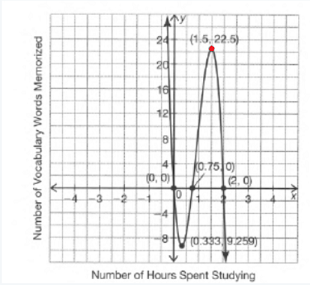
Here the red colored point represents the location of the estimated point.
From the graph, we estimated that the student memorized approximately 22 vocabularies in 1.5 hours.
Page 364 Problem 6 Answer
Given: The graph has an x-intercept at (2,0)
To describe the activity of the student.
We need to verify the graph in order to find the activity of the student.
We know that, In the graph, the x-axis represents the number of hours spent studying and the y-axis represents the number of vocabulary words memorized.
Therefore the x-intercept (2,0) represent that the student memorized 0 vocabulary in 2 hours.
The student memorized 0 vocabulary (nothing) in 2 hours.
Page 364 Problem 7 Answer
Given: A graph that shows the number of vocabulary words a student is able to memorize based on the amount of time spent studying.
To describe whether the graph accurately shows the problem situation or not.
The graph so far showed the accurate details on how many hours the student took to memorize the vocabulary.
The situations given in the problem accurately match the x and y coordinates in the graph.
Yes, the graph accurately describes the problem situation.
Skills Practice Carnegie Learning Algebra Ii Exercise 4.1 Answers
Carnegie Learning Algebra II Student Skills Practice 1st Edition Chapter 4 Exercise 4.1 Skills PracticePage 365 Problem 8 Answer
Given: (0,1.5)
To find: The average rate of change.
We need to substitute the given interval in the average rate of change formula.
are the x-coordinates of the given graph and f(a) and f(b) are the corresponding y-coordinates.
Substituting the given interval in the formula of the average rate of change.
A(x)=f(b)−f(a)/b−a
=f(1.5)−f(0)/1.5−0
=4.375−0/1.5−0
=4.375/1.5
≈2.92
The average rate of change for the given interval for each polynomial function is 2.92 (approximately).
Page 365 Problem 9 Answer
Given: (1,2)
To find: The average rate of change.
We need to substitute the given interval in the average rate of change formula.
are the x-coordinates of the given graph and f(a) and f(b) are the corresponding y-coordinates.
Substituting the given interval in the formula of the average rate of change.
A(x)=f(b)−f(a)/b−a
=f(2)−f(1)/2−1
=6−0/2−1
=6/1
A(x)=6
The average rate of change for the given interval for each polynomial function is6
Page 366 Problem 10 Answer
Given: (−2,0)
To find: The average rate of change.
We need to substitute the given interval in the average rate of change formula.
(a,b)=(−2,0) are the x-coordinates of the given graph and f(a) And f(b) are the corresponding y-coordinates.
Substituting the given interval in the formula of the average rate of change.
A(x)=f(b)−f(a)/b−a
=f(0)−f(−2)/0−(−2)
=−6−4/0+2
=−10/2
A(x)=−5
The average rate of change for the given interval for each polynomial function is−5
Carnegie Learning Algebra II Student Skills Practice 1st Edition Chapter 4 Exercise 4.1 Skills Practice Page 366 Problem 11 Answer
Given: (−3,−0.3)
We have determined the average rate of change for the given interval.
Here we will use the average rate of change formula to find the answer.
The average rate of change for the given interval (−3.−0.3):
The average rate of change=f(b)−f(a)/b−a
=f(−0.3)−f(−3)/−0.3−(−3)
=2.38−(−17.5)/−0.3+3
≈7.36
Hence the average rate of change for interval (−3,−0.3) is approximately equal to 7.36.
Page 367 Problem 12 Answer
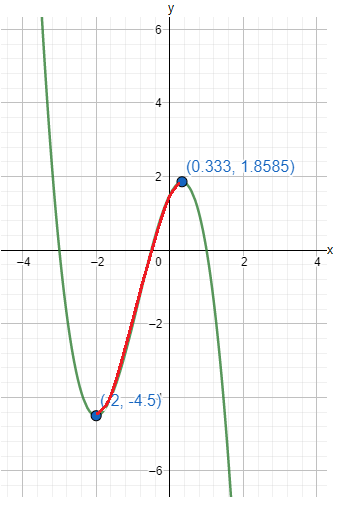
Given: (−2,0.333)
We have determined the average rate of change for the given interval.
Here we will use the average rate of change formula to find the answer.
The average rate of change for the given interval (−2,0.333):
Average rate of change =f(b)−f(a)/b−a
=f(0.333)−f(−2)/0.333−(−2)
=1.85−(−4.5)/0.333+2
≈2.72
The interval is shown below

Hence the average rate of change for interval(−2,0.333) is approximately equal to 2.72.
The interval is shown below
How To Solve Chapter 4 Exercise 4.1 Algebra Ii Carnegie Learning
Page 367 Problem 13 Answer
Given: (2,3.5)
We have determined the average rate of change for the given interval.
Here we will use the average rate of change formula to find the answer.
The average rate of change for the given interval(2,3.5):
Average rate of change =f(b)−f(a)/b−a
=f(3.5)−f(2)/3.5−2
=−4.79−2.333/1.5
≈−4.74
Hence the average rate of change for interval (2,3.5) is approximately equal to.
Carnegie Learning Algebra II Student Skills Practice 1st Edition Chapter 4 Exercise 4.1 Skills PracticePage 368 Problem 14 Answer
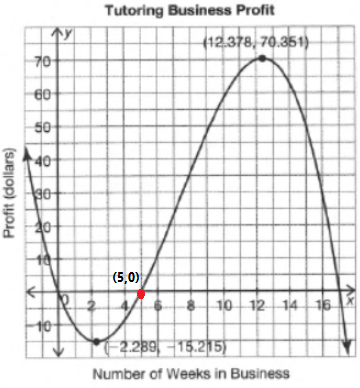
Given: The graph models the profit a group of students earns running a tutoring business.
We have to find after how many weeks did it take the group to earn a profit and where is this information located on the graph.
Here we will use the graph to find the answer.
The given graph describes the Tutoring Business Profit.
The x−axis represents the number of weeks in business and y−axis represents the profit in dollars.

From the graph, the number of weeks after which the group earns a profit is at x=5 where x is the number of weeks.
And the point (5,0) where the information is located on the graph.
The location of the point (5,0) on the graph is shown below
Hence the group earns a profit after 5 weeks in business. The information is located at the point (5,0).
Located the point (5,0) in the graph
Page 368 Problem 15 Answer
Given: The graph models the amount of money a company makes producing floral displays.
We have to find the what is the maximum number of floral displays that the company can create and continue to increase their profit and where is this information located on the graph.
Here we will use the graph to find the answer.
The given graph describes the Floral Business Profit.
The x−axis represents the number of floral displays made and y−axis represents the profit in dollars.
Find the point from where the x−coordinate and y−coordinate both are positive.
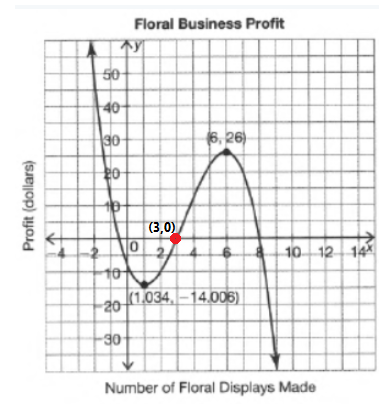
From the graph, we can see that at x=3 the company can create and increase their profit and the point which describes this information is (3,0)
Hence the maximum 3 number of floral displays that the company can create and continue to increase their profit and this point is located at (3,0).
The point (3,0) on the graph is

Carnegie Learning Algebra II Student Skills Practice 1st Edition Chapter 4 Exercise 4.1 Skills Practice Page 369 Problem 16 Answer
Given: The graph models the number of gallons of water that are filtered at a filtration plant hourly.
We have to find how many gallons of water has the plant filtered after running for about 4.5 hours and where is this information located on the graph.
Here we will use the graph to find the answer.
The given graph describes the Gallons of water filtered. The x−axis represents time and y−axis represents the number of gallons filtered.
From the graph, we can see that after running for an 4.5 hours the amount of water filtered is approximately equal to 631 Gallons and the point which describes this relation is .The point is plotted in the graph
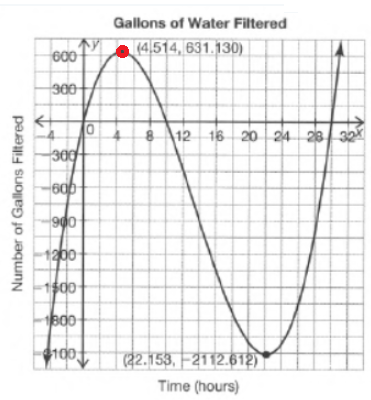
Hence 631 gallons of water have the plant filtered after running for about 4.5 hours. This information is located on the graph.
Located the point on the graph.

Carnegie Learning Algebra Ii Student Skills Practice Exercise 4.1 Explanations
Page 369 Problem 17 Answer
Given: The graph models the amount of profit Emilio earns from his own lawn-care business.
We have to find how much did Emilio initially invest to start his business and where is this information located on the graph.
The given graph describes the Lawn-Care Business Profit where x−axis represents the number of weeks in business and y−axis represents the profit.
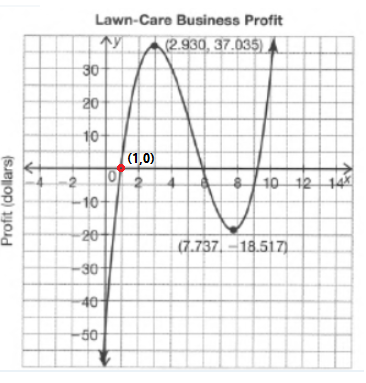
From the graph, we can see that Emilio needs to invest 1 week to start his business and the which describe the information is (1,0).
Locate the point on the graph

Hence initially Emilio needs to invest 1 week to start his business and this information is located (1,0) on the graph.
Page 370 Problem 18 Answer
Given: The graph models the number of tricks that a dog can perform based on the number of hours it is trained.
We have to estimate how long it takes the dog to learn 8 tricks. and where is this information located on the graph
Here we will use the graph to find the answer.
The given graph describes the Dog tricks learned in time trained where x−axis represents the time spent training in hours and y−axis represents the number of tricks learned.
From the graph in 1 hour dog learned 8 tricks and the point which describes this information is (1,8).
Hence it takes 1 hour to the dog to learn 8 tricks and this information is located (1,8)on the graph.
Chapter 4 Carnegie Learning Algebra Ii Exercise 4.1 Worked Examples
Carnegie Learning Algebra II Student Skills Practice 1st Edition Chapter 4 Exercise 4.1 Skills Practice Page 370 Problem 19 Answer
Given: The graph models the number of electronic devices that are being used in a home during the hours of noon and4:00 pm.
We have to estimate the time when the greatest number of electronic devices are being used and where is this information located on the graph.
Here we will use the graph to find the answer.
The given graph describes the Electronic device usage where x−the axis represents the time since noon in hours and y−the axis represents the number of active electric devices.
From the graph, we can see that from 3 noon the maximum number of electronic devices are being used and the point which describes this information is (3,18).
Hence 3 pm is the time when the greatest number of electronic devices are being used and this information is located (3,18) on the graph.