
Carnegie Learning Algebra I Student Text Volume 1 3rd Edition Chapter 2 Graphs Equations And Inequalities
Page 88 Problem 1 Answer
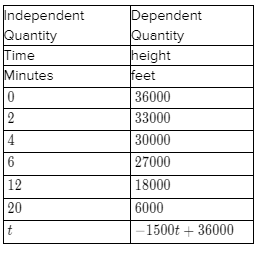
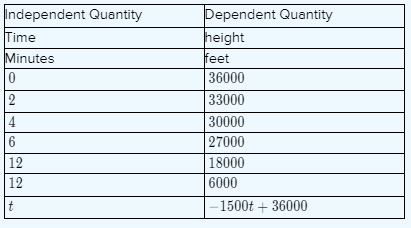
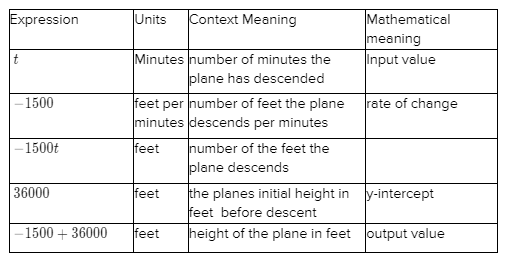
Given :1500 feet.
To complete the table to represent the problem situation.
Using the inequality method.
The two changing quantities are time and the height of the plane.
The height of the plane depends on the time, the height of the plane is the dependent quantity and the time is the independent quantity.
The units for time are minutes and the units for height are feet since the given rate of change has units of feet per minute.
Problem situation marked on the table.
Page 88 Problem 2 Answer
Given :1500 feet.
To write a function,g(t), to represent this problem situation.
Using the inequality method.
At36000 feet, the crew aboard the 747 airplane begins making preparations to land.
The plane descends at a rate of 1500 feet per minute until it lands.
From the table in the previous question,
The height aftert minutes is−1500t+36,000
So if g(t) represents the height of the plane,
Theng(t)=−1500t+36,000.
The height of the planeg(t)=−1500t+36,000.
Carnegie Learning Algebra I Chapter 2 Exercise 2.2 Solutions
Carnegie Learning Algebra I Student Text Volume 1 3rd Edition Chapter 2 Exercise 2.2 Graphs Equations And InequalitiesPage 89 Problem 3 Answer
Given :
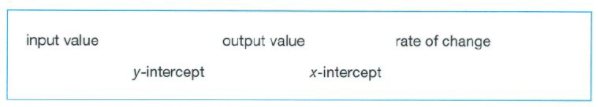
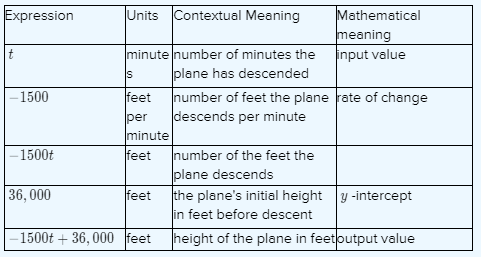
To describe the mathematical meaning of each part of the function.Using the inequality method.
t is the independent variable so its mathematical meaning is the input value.
It has units of minutes and its contextual meaning is how long the plane is descending.
Described the mathematical meaning of each part of the function.
Page 89 Problem 4 Answer
Given :
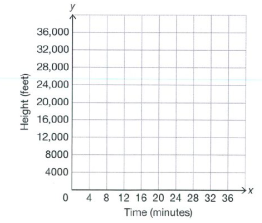
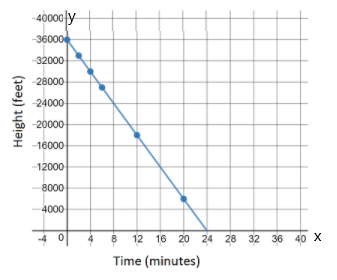
To graphg(t) on the coordinate plane shown.Using the graphical method.
From the table in Problem2,the graph must pass through the points(0,36,000),(2,33,000),(4,30,000),(6,27,000),(12,18,000), and(20,6,000).
Plot these points and then connect them with a straight line. Draw the line long enough to intersect the x-axis:

The graph of g(t)is:
Carnegie Learning Algebra I Student Text Volume 1 3rd Edition Chapter 2 Exercise 2.2 Graphs Equations And InequalitiesPage 90 Problem 5 Answer
Given :14,000 feet.
To use the table to determine how long it will take the plane to descend to 14,000 feet.
Using the inequality method.
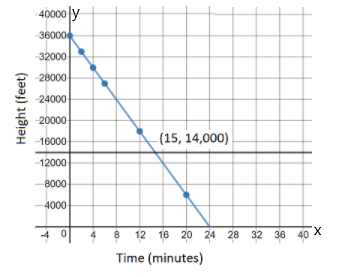
The table has the ordered pairs(12,18,000) and⇒(20,6,000)
so the plane will reach a height of14,000 feet at some time between 12 and 20.
The plane is descending 1500 feet per second and 18,000−14,000=4,000,
It will take the plane about 4,000/1500≈3 minutes to go from18,000 feet to 14,000feet.
An approximation of the time it takes to reach14,000
feet is then12+3=15 minutes.
The time it takes to reach 14,000 feet is 15minutes.
Page 90 Problem 6 Answer
Given :y=14,000
To explain what the intersection point means in terms of this problem situation.
Using the graphical method.

Draw the horizontal line y=14,000 on the graph made in question 5 and find an estimate for the point of intersection.
The plane will then reach a height of 14,000 feet in approximately 15 minutes:
Determined the intersection point. The graph is a height of 14,000 feet in approximately 15 minutes.
Page 90 Problem 7 Answer
Substituteg(t)=14,000 into the function
g(t)=−1500t+36,000 and solve fort:
g(t)=−1500t+36,000
14,000=−1500t+36,000
−22,000=−1500t
−22,000/−1500=−1500t/−1500
44/3=t
142/3=t
The plane will reach a height of 14,000 feet in 142/3 minutes.
The plane will reach a height of 14,000 feet in 142/3 minutes.
Graphs, Equations, And Inequalities Chapter 2 Exercise 2.2 Answers
Carnegie Learning Algebra I Student Text Volume 1 3rd Edition Chapter 2 Exercise 2.2 Graphs Equations And Inequalities Page 90 Problem 8 Answer
Given :14,000 feet.
To use the table, graph, and the function. What do you notice?
Using the inequality method.
Determine how long will it take the plane to descend to14,000 feet
I was only able to find an estimate for the solution by using a table and using the graph but,
I was able to find the exact solution using the function.
The table and graph gave an estimate for the solution and the function gave an exact solution.
The table and graph gave an estimate for the solution and the function gave an exact solution.
Page 91 Problem 9 Answer
Given :24,000.
To use the table to determine how long it will take the plane to descend to 24,000 feet.
Using the inequality method.
The table has the ordered pairs(12,18,000) and (6,27,000)
so the plane will reach a height of 24,000 feet at some time between 6 and 12.
The plane is descending 1500 feet per second and27,000−24,000=3,000,
it will take the plane3,000/1500=2 minutes to go from 27,000 feet to 24,000 feet.
It then takes the plane 6+2=8 minutes to reach 24,000 feet.
The plane to descend to 24,000 feet is 8 minutes.
Page 91 Problem 10 Answer
Given :y=24,000.
To explain what the intersection point means in terms of this situation.
Using the inequality method.
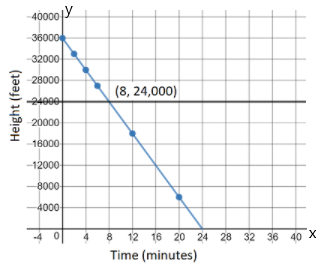
Draw the horizontal liney=24,000 on the graph you made in question 5 and find an estimate for the point of intersection.
The plane will then reach a height of 24,000 feet in 8 minutes:
The graph is a height of 24,000 feet in 8 minutes.

Page 91 Problem 11 Answer
Given :24,000 feet.
To solve the equation fort.
Using the inequality method.
Substitute g(t)=24,000 into the function
g(t)=−1500t+36,000 and solve fort:
g(t)=−1500t+36,000
24,000=−1500t+36,000
−12,000=−1500t
−12,000/−1500=−1500t/−1500
8=t
The plane will reach a height of 24,000 feet in 8 minutes.
The equation of t is 8 minutes.
Carnegie Learning Algebra I Student Text Volume 1 3rd Edition Chapter 2 Exercise 2.2 Graphs Equations And Inequalities Page 91 Problem 12 Answer
Given :24,000 feet.
To use the table, graph, and the function. What do you notice?
Using the inequality method.
Using the table,I was only able to find the exact solution by using the rate of change since none of the ordered pairs in the table had a height of 24,000 feet.
Using the graph, I could find the exact solution since the time was a whole number.
Using the function, I could also find the exact solution.
The exact solution since the time was a whole number.
Page 92 Problem 13 Answer
Given : For how many heights can you calculate the exact time using the table.
To calculate the exact time using the table.
Using the inequality method.
Calculate the exact time using the table:
The table only has 6 ordered pairs so there are only 6 heights,
can find the exact time using only the ordered pairs in the table.
Perfect timing using only the pairs ordered in table 6.
Page 92 Problem 14 Answer
Given in graph. To find the height for calculating the exact time,Use the method of graphical.
Find the exact time using graph only when the height is a multiple of 4,000 since y-axis has a scale of 4,000 and when the time is a multiple of 4.
The only ordered pairs that meet these requirements are
(0,36,000),(8,24,000),(16,12,000),(24,0).
Any other height would be an estimate so there are only 4 heights, can find the exact time.
For 4 heights, can calculate the exact time using the graph.
Carnegie Learning Algebra I Exercise 2.2 Solutions Guide
Carnegie Learning Algebra I Student Text Volume 1 3rd Edition Chapter 2 Exercise 2.2 Graphs Equations And Inequalities Page 92 Problem 15 Answer
Given in function.To find the height for calculating the exact time,Use the method of properties of function.
If find any height using the function, then there are infinitely many exact times can find.
The function will give infinitely many solutions.

Therefore, infinitely many exact times can find in finding any height using the function.
For infinitely many heights we can calculate the exact time using the function.

Page 92 Problem 16 Answer
Given in words, always, sometimes, never.To complete the sentence using the word bank,Use the method of property of linear function.
Tables can give an exact solution if it is one of the ordered pairs in the table and an estimate if it is not.
Therefore here the suitable word to fill the blank is “always”, then the sentence is,
“I can always use a table to determine an approximate value”.
I can always use a table to determine an approximate value.
Page 92 Problem 17 Answer
Given in words, always, sometimes, never. To complete the sentence using the word bank,Use the method of property of linear function.
Tables can give an exact solution if it is one of the ordered pairs in the table and an estimate if it is not.
Therefore here the suitable word to fill the blank is “sometimes”, then the sentence is,
“I can sometimes use a graph to calculate an exact value”.
I can sometimes use a graph to calculate an exact value.
Carnegie Learning Algebra I Student Text Volume 1 3rd Edition Chapter 2 Exercise 2.2 Graphs Equations And Inequalities Page 92 Problem 18 Answer
Given in words, always, sometimes, never.
To complete the sentence using the word bank,Use the method of property of linear function.
A graph can give an exact solution if it is at an intersection of the grid and an estimate if it is not.
Therefore here the suitable word to fill the blank is “always”, then the sentence is,
“I can always use a graph to determine an approximate value”.
I can always use a graph to determine an approximate value.
Page 92 Problem 19 Answer
Given in words, always, sometimes, never.
To complete the sentence using the word bank,Use the method of property of linear function.
A graph can give an exact solution if it is at an intersection of the grid and an estimate if it is not.
Therefore here the suitable word to fill the blank is “sometimes”, then the sentence is,
“I can sometimes use a graph to calculate an exact value”.
I can sometimes use a graph to calculate an exact value.
Page 92 Problem 20 Answer
Given in words, always, sometimes, never.
To complete the sentence using the word bank,Use the method of property of linear function.
A function gives an exact solution and can be rounded to get an estimated solution.
Therefore here the suitable word to fill the blank is “always”, then the sentence is,
“I can always use a function to determine an approximate value”.
I can always use a function to determine an approximate value.
Exercise 2.2 Graphs, Equations, And Inequalities Explained
Carnegie Learning Algebra I Student Text Volume 1 3rd Edition Chapter 2 Exercise 2.2 Graphs Equations And InequalitiesPage 92 Problem 21 Answer
Given in words, always, sometimes, never.
To complete the sentence using the word bank,Use the method of property of linear function.
A function gives an exact solution and can be rounded to get an estimated solution.
Therefore here the suitable word to fill the blank is “always”, then the sentence is,
“I can always use a function to calculate an exact value”.
I can always use a function to calculate an exact value.
Page 94 Problem 22 Answer
Given in Dawson would like to exchange $70 more, Dawson should have a total of £343.54707, Erin says he should have a total of £343.55, Tre says he should have a total of £342.
To find who’s reasoning is correct,Use the method of comparison.
since the pound is made up of 100 pence, the number of pounds must be rounded to two decimal places.
Jonathon’s answer is then incorrect since he didn’t round.
Tre is incorrect because he rounded to the conversion rate to 0.6.
Erin is correct because she used the exact conversion rate and rounded the number of pounds to two decimal places.
Erin’s reasoning is correct.
Page 94 Exercise 1 Answer
Given in if Dawson only exchanges an additional $50.
To find how many total pounds will Dawson have,Use the method of solving a function.
The function is f(d)=0.622101d+300.
Substitute d=50
f(50)=0.622101(50)+300
Simplify, f(50)=31.10505+300
=331.10505
Since British pound is made up of 100 pence, round the answer into two decimal places.
∴f(50)≈331.11.
331.11 British pounds will Dawson have if he only exchanges an additional $50.
Page 95 Exercise 2 Answer
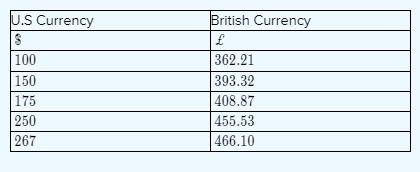
Given in a table.
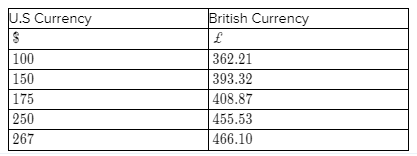
To complete the table,Use the method of graphing calculator and TABLE feature.
Use the TABLE feature on the graphing calculator and and the steps given in book to complete the table.
The first three values for U.S dollars are multiples of 25 so first use ΔTbl=25:
he last row in the table could not be filled in since it wasn’t the graphing calculator table. From the graphing calculator table though you now it is between $250 and $275 so set Tbl Start=250 and
ΔTbl=5.
466.10 is still not in the table but it will fall between $265 and $270 so set the Tblstart=265 and ΔTbl=1.
This then gives $267 for £466.10.
Using graphing calculator and the TABLE feature the completed table is,
Carnegie Learning Algebra I Student Text Volume 1 3rd Edition Chapter 2 Exercise 2.2 Graphs Equations And Inequalities Page 96 Exercise 3 Answer
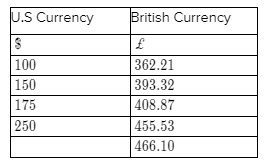
Given in table.To complete the table,Use the method of table feature.
Yes. But the TblStart and ΔTbl values had to be adjusted multiple times to fill in the last row.
All of the rows but the last one could be filled in using TblStart=100 and ΔTbl=25.
From this table, it came to knew that the last rows as between $250 and $275 so then,
Set TblStart=250 and ΔTbl=5.
From this table, it came to knew that the last row was between $265 and $270, so then,
Set TblStart=265 and ΔTbl=1
Then able to find that $267 as the value for the last row.
Yes. But the TblStart and ΔTbl values had to be adjusted multiple times to fill in the last row.
Page 96 Exercise 4 Answer
Given in Amy exchanges an additional $375.
To find the amount of total British pound,Use the method of graphing calculator.
Here x=375
Using the value feature in graphing calculator that following the steps in the book,
The input x=375
gives a result of y=533.29.
The graphing calculator is capable of plotting graphs and solving simultaneous equations.
533.29 British pounds will Amy have if she exchanges an additional $375.
Carnegie Learning Algebra I Student Text Volume 1 3rd Edition Chapter 2 Exercise 2.2 Graphs Equations And Inequalities Page 96 Exercise 5 Answer
Given in Amy exchanges an additional $650.
To find the amount of total British pound,Use the method of graphing calculator.
Here, x=650
Using the value feature on the graphing calculator following the steps in the book,
If the input is x=650, then the value of y=704.37.
The graphing calculator is capable of plotting graphs and solving simultaneous equations.
704.37 British pounds will Amy have if she exchanges an additional $650.
Page 96 Exercise 6 Answer
Given in Amy exchanges an additional $2000.To find the amount of total British pound,Use the method of graphing calculator.
Here, x=2000 Using the value feature on graphing calculator following the steps in the book,
If the input is x=2000 then the value of y=1544.20.
The graphing calculator is capable of plotting graphs and solving simultaneous equations.
1544.20 British pounds will Amy have if she exchanges an additional $2000.
Page 97 Exercise 7 Answer
Given in Solution,To verify that the solution is correct,Use the method of simplifying function
Verify that each solution is correct by substituting U.S dollar amount into the function f(d)=0.622101d+300.
Substitute d=375
f(375)=0.622101(375)+300≈533.29.
Substitute d=650
f(650)=0.622101(65)+300
≈704.37.
Substitute d=2000
f(2000)=0.622101(2000)+300
≈1544.20.
This gives the same answer.
By substituting each U.S dollar amount into the function f(d)=0.622101d+300, it can verify that each solution is correct.
Chapter 2 Exercise 2.2 Carnegie Learning Detailed Solutions
Carnegie Learning Algebra I Student Text Volume 1 3rd Edition Chapter 2 Exercise 2.2 Graphs Equations And InequalitiesPage 97 Exercise 8 Answer
Given in value feature.
To find the advantages ad limitations of using the value feature,Use the method of analysing value feature.
The value feature can be used to find the value of the dependant quantity for any independent quantity in the graphing window.
if the value of the independent quantity is not in the graphing window, the dimensions of the graphing window can be changed so it will be.
The value feature does not allow to find the value of the independent quantity given the value of the dependent quantity though.
That is, it can be used to find the value of the dependent quantity for any value of independent quantity and it cannot be used though to find the value of the independent quantity for a given value of the dependent quantity.
The advantage of the value feature is that, it can be used to find the value of the dependent quantity for any value of independent quantity.
The limitation of the value feature is that, it cannot be used though to find the value of the independent quantity for a given value of the dependent quantity.
Page 98 Exercise 9 Answer
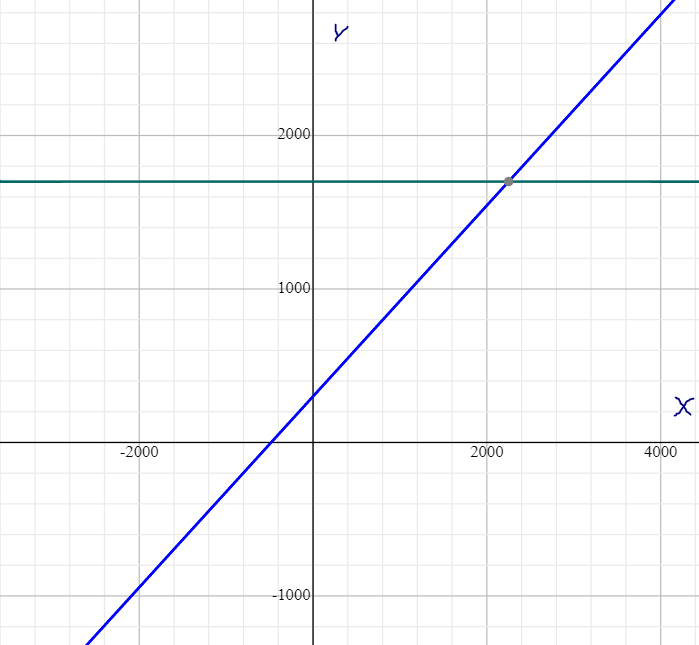
Given: The total amount George have is £1699.73
To find: How many additional U.S. dollars did Jorge exchange
Method used : intersect feature
The graph of the intersection is

We have the equation
y=300+0.622101x
1699.73=300+0.622101x
Switch sides
300+0.622101x=1699.73
Subtract 300 from both sides
300+0.622101x−300=1699.73−300
Simplify
0.622101x=1399.73
Divide both sides by 0.622101
0.622101x/0.622101=1399.73/.0.622101
Simplify
x=1399.73/0.622101
The additional U.S. dollars did Jorge exchange is x=1399.73/0.622101
Page 98 Exercise 10 Answer
Given ” Intersect Feature”.To determine advantages and limitations of the intersect feature.Using theory of intersect feature.
The intersect feature is used to find the value of the independent quantity for any value of the dependent quantity on the graph.
But can’t be used to find the value of the dependent quantity for a given value of the independent quantity.
Because if the value of the independent quantity is given, it would need to be graphed.
The intersect feature is used to find the value of the independent quantity for any value of the dependent quantity on the graph.
But can’t be used to find the value of the dependent quantity for a given value of the independent quantity.
Carnegie Learning Algebra I Student Text Volume 1 3rd Edition Chapter 2 Exercise 2.2 Graphs Equations And Inequalities Page 98 Exercise 11 Answer
Given ” Intersect feature”.
To determine “could we use each of the graphing calculator strategies discussed in this lesson with any function, not just linear functions”Using theory of intersect feature.
The intersect feature and tables on a graphing calculator can be used on any function.
However, some functions may have none, one, or two or more intersections with a horizontal line, unlike a linear function that has one or none.
Also, some functions do not have a domain of all real number so the value feature and table will be unable to evaluate.
Yes, we could use each of the graphing calculator strategies discussed in this lesson with any function, not just linear functions.
Page 98 Exercise 12 Answer
Givenf(x)=14.95x+31.6
To determinef(3.5)
Using methods of graphing.
Given function f(x)=14.95x+31.6
Puttingx=3.5
f(3.5)=14.95×(3.5)+31.6
f(3.5)=52.325+31.6
f(3.5)=83.925
The value off(3.5)=83.925
Page 98 Exercise 13 Answer
Givenf(x)=14.95x+31.6
To determine f(16.37)
Using methods of graphing.
Given function f(x)=14.95x+31.6
Puttingx=16.37
f(16.37)=14.95×(16.37)+31.6
f(16.37)=244.7315+31.6
f(16.37)=276.3315
The value off(16.37)=276.3315
How To Solve Exercise 2.2 Graphs, Equations, And Inequalities
Carnegie Learning Algebra I Student Text Volume 1 3rd Edition Chapter 2 Exercise 2.2 Graphs Equations And Inequalities Page 98 Exercise 14 Answer
Givenf(x)=14.95x+31.6
To determinef(50.1)
Using methods of graphing.
Given function f(x)=14.95x+31.6
Puttingx=50.1
f(50.1)=14.95×(50.1)+31.6
f(50.1)=748.995+31.6
f(50.1)=780.595
The value off(50.1)=780.595
Page 99 Exercise 15 Answer
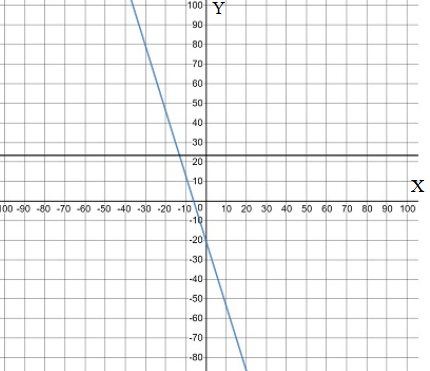
Given: f(x)=−3.315x−20 when f(x)=23.38
To sketch the graphs on the coordinate plane provided.Using the method of Graphical.
To sketch the graphs on the coordinate plane provided.
Type Y1=−3.315x−20 and Y2=23.38.
when y=23.38
x≈−13.09
To graph f(x)=23.38, graph a horizontal line passing through 23.38 on the y-axis.
To graph f(x)=−3.315x−20, enter TblStart =−100 and ΔTbl=20
Then use the ordered pairs in the table to find points on the graph.
Plot these points and then connect them with a straight line.
The graph of the function is

The graph of the given function in a coordinate plane is shown.:
Page 99 Exercise 16 Answer
Given: 1/2x+5=164/5
To find the graph on the coordinate plane.Using the method of Graphing calculator.
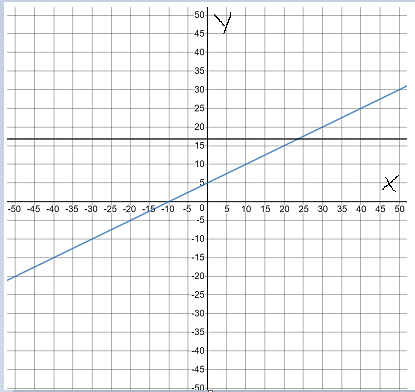
Given 1/2x+5=164/5 here Y1=1/2x+5and Y2=164/5
Plot Y1 and Y2 values on the graph
Solving 1/2x+5=164/5
Convert mixed fractions into fractions
164/5=16×5+4/5
80+4/5=84/5
1/2x+5=84/5
Transfer 5 to Right-hand side 1/2x=84/5−5
1/2x=84−25/5
1/2x=59/5
Transfer 1/2 to Right-hand side
x=59/5×2/1
x=118/5
x=23.6
The graph on the coordinate plane is shown below:
The independent value is x=23.6
Page 100 Exercise 17 Answer
Given: The word box to complete each sentence.
To find a table to determine an approximate value.Using the method of Graphing calculator.
Given the word, box to complete each sentence.
I can Always use a table to determine an approximate value.
Tables can determine an approximate value if they are in ordered pairs.
they also determine that they are not approximate values if they are not in ordered pairs.
So, I can always use tables to determine approximate values.
I can always use a table to determine an approximate value.
Algebra I Chapter 2 Exercise 2.2 Answer Key
Carnegie Learning Algebra I Student Text Volume 1 3rd Edition Chapter 2 Exercise 2.2 Graphs Equations And Inequalities Page 100 Exercise 18 Answer
Given: The word box to complete each sentence.To find a table to calculate an exact value.Using the method of Graphing calculator.
Given the word, box to complete each sentence.
I can sometimes use a table to calculate an exact value
When we solve a problem or anything using a certain thing or method we can never determine beforehand that will give us an exact value.
So we can sometimes only determine exact values.
It is not only tables but anything we want to determine we will not be able to tell whether they will give an exact value unless we solve them.
I can sometimes use a table to calculate an exact value.
Page 100 Exercise 19 Answer
Given: The word box to complete each sentence.To find a graph to determine an approximate value.Using the method of Graphing calculator.
Given the word, box to complete each sentence.
I can always use a graph to determine an approximate value.
here approximate value means the values which are nearly equal to the exact values.
when we plot a graph we can always use the points on the graph to determine the approximate values.
Because when we plot a graph there will always be differences in points which are nothing but approximate values.
I can always use a graph to determine an approximate value.
Page 100 Exercise 20 Answer
Given: The word box to complete each sentence.
To find a graph to calculate an exact value.Using the method of Graphing calculator.
Given the word, box to complete each sentence.
I can sometimes use a graph to calculate an exact value.
Not always a graph can give exact values.
Because when we solve the points on the graph there will at least be some point difference.
So graphs can only be used sometimes to determine an exact value.
I can sometimes use a graph to calculate an exact value.
Page 100 Exercise 21 Answer
Given: The word box to complete each sentence.
To find a function to determine an approximate value.Using the method of Graphing calculator.
Given the word, box to complete each sentence.
I can always use a function to determine an approximate value.
here approximate value means the values which are nearly equal to the exact values.
In functions, we mostly get an approximate value while solving x and y conditions.
We mostly get approximate values in all the methods and they are easy to find.
I can always use a function to determine an approximate value.
Carnegie Learning Algebra I Student Text Volume 1 3rd Edition Chapter 2 Exercise 2.2 Graphs Equations And Inequalities Page 100 Exercise 22 Answer
Given: The word box to complete each sentence.
To find a function to calculate an exact value.Using the method of Graphing calculator.
Given the word, box to complete each sentence.
I can always use a function to calculate an exact value
In functions, we mostly get an approximate value while solving x and y conditions.
But in functions, we can round off these approximate values to get an exact value.
So in functions, approximate values can always be round off to get an exact value.
I can always use a function to calculate an exact value.