
Carnegie Learning Algebra I Student Text Volume 1 3rd Edition Chapter 1 Quantities And Relationships
Page 38 Problem 1 Answer
Given increasing function and decreasing function To fill the table
Method used is increasing and decreasing function
We are given that
A function is described as increasing when the dependent variable increases as the independent variable increases.
If a function increases across the entire domain, then the function is called an increasing function.
A function is described as decreasing when the dependent variable decreases as the independent variable increases.
If a function decreases across the entire domain, then the function is called a decreasing function.
A graph is increasing if it rises from left to right, decreasing if it is falling from left to right, and constant if it is horizontal.
All the increasing and decreasing functions, constants are grouped in the table
| Increasing function | Decreasing function | constant function | combination of increasing,decreasing or constant |
| G | H | U | A,B,C |
| K | L | D,F,I | |
| O | M,Q,S | ||
| P | T,V |
Carnegie Learning Algebra I Chapter 1 Exercise 1.3 Solutions
Page 39 Problem 2 Answer
Given: Some of the functions are given
To determine the shape of its graph.
Method: Graphing calculator
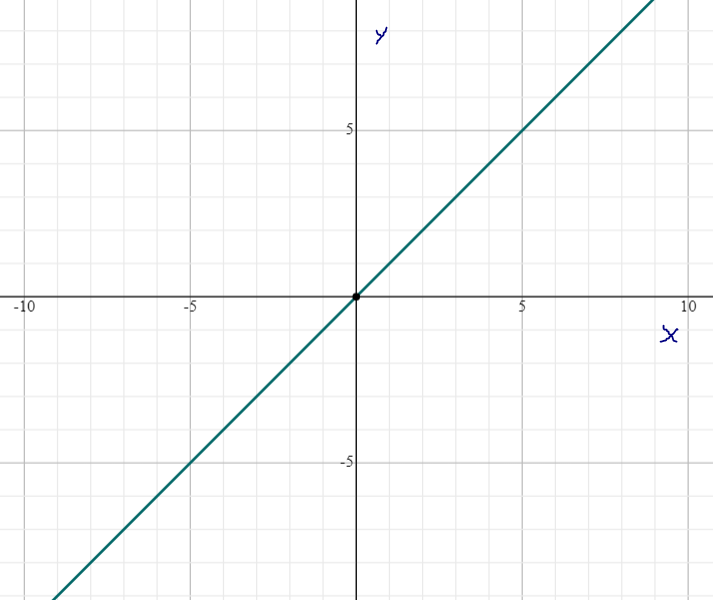
The graph of the function f(x)=x is
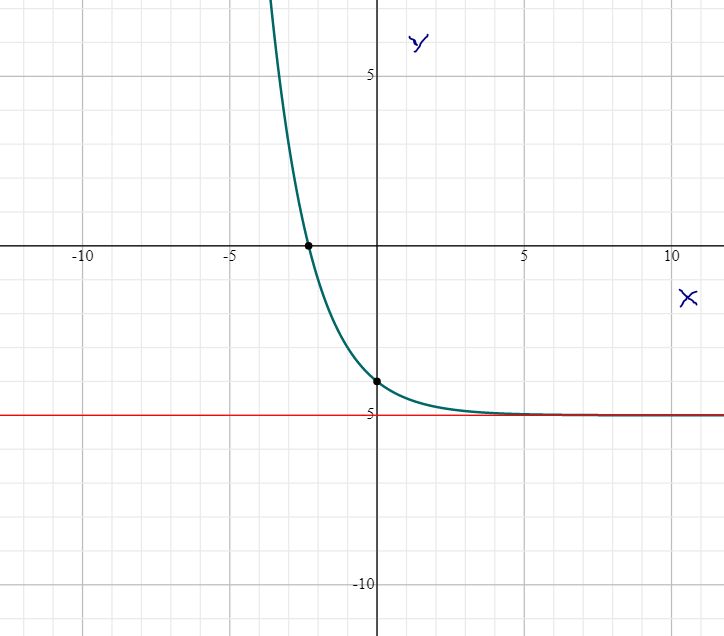
So the graph off(x)=(1/2)x−5
The shape of its graph is

Page 39 Problem 3 Answer
Given functions To sort the graphs into two groups based on the equations representing the functions and record the function letter in the table.
Method used is the concept of functions
The seven graphs from exercise 2 can be grouped as linear or exponential
A linear function is of the form y=mx+c
so the constant function are a linear function when m=0
An exponential function is of the formy=bx−k
The exponential function are then f(x)=(1/2)x−5
Where x is an integer (graph H)
f(x)=2x (graph K), and f(x)=(1/2)x (graph P)
The linear function aref(x)=x(graph G),f(x)=−2/3x+5(graph L)
f(x)=−x+3 where x is an integer (graph O), andf(x)=2
Wherex is an integer(graph U)
The table can be filled as
| Group 1 | Group 2 |
| P | G |
| H | L |
| K | O |
| U |
All the data s are arranged in the table
Carnegie Learning Algebra I Student Text Volume 1 3rd Edition Chapter 1 Exercise 1.3 Quantities And Relationships Page 39 Problem 4 Answer
Given seven graphs and functions that are increasing functions, decreasing functions, or constant functions.
To find same about all the functions in each group Method used is the concept of function
All the in Group 1 are exponential functions
Also, all the functions in group 2 are linear functions
Functions in group 1 are exponential functions and group 2 are linear functions
Page 40 Problem 5 Answer
Given functions To identify which group represents linear and constant functions and which group represents exponential functions.
Method used is the concept of functions
All the functions in group 1 are exponential functions
Since they are of the form f(x)=ab x
All the functions in group 2 are linear functions
Since they are of the form f(x)=mx+b
All the functions in group 1 are exponential functions and in group 2 are linear functions
Quantities And Relationships Chapter 1 Exercise 1.3 Answers
Page 40 Problem 6 Answer
Given linear function f(x)=mx+b
To describe the m and b values that produce a constant function. The method
used is the concept of functions
We are given the function f(x)=mx+b
f(x)=mx+b is the linear equation
The graph of the linear equation is a line.
The value of m tell us the steepness of the line that is the slope of the line b is the initial value
Whenx=0,f(x)=a(0)+b
That is, f(0)=b
So b is the initial value or y-intercept
The value of m steepness of the line and b is the initial value
Carnegie Learning Algebra I Student Text Volume 1 3rd Edition Chapter 1 Exercise 1.3 Quantities And Relationships Page 40 Problem 7 Answer
Given different functions To sort the graphs and record the function letter in the appropriate column of the table shown

Method used is the concept of absolute minimum and absolute maximum value
GraphA has no absolute minimum or maximum since it doesn’t have a highest or lowest point
GraphB has an absolute maximum at(2,2) since that is the highest point in the graph.
GraphC has no absolute maximum or minimum since it doesn’t have a highest or lowest point
GraphD has an absolute minimum at(0,0) since that is the lowest point in the graph.
GraphF has an absolute maximum at(0,4) since that is the highest point in the graph
GraphI has an absolute maximum at(0,0) since that is the highest point in the graph
Graph M has an absolute minimum at(0,0) since that is the lowest point in the graph
Graph Q has an absolute maximum at(2,4) since that is the highest point in the graph
Graph S does not have an absolute maximum or minimum since it doesn’t have a highest of lowest point
Graph T has an absolute minimum at(−4,−4) since that is the lowest point in the graph
Graph V has an absolute minimum at(3,−2) since that is the lowest point in the graph.
The table is then
| absolute minimum | absolute maximum | no absolute minimum and maximum |
| B,F,I | D,M,T | A,C,S |
| Q,V |
All the data s are arranged in the table
Page 41 Problem 8 Answer
Given: Consider the graphs of functions that have an absolute minimum or an absolute maximum.
To sort the graphs into two groups based on the equations representing the functions and record the function letter in the table.
The method used: Functional method.
Group1 equations in the form of f(x)=a∣x+b∣+c,
Group 2 be the equations in the form of f(x)=ax2+bx+c,
f(x)=a∣x+b∣+c,
f(x)=∣x−3∣−2 (graphV),
f(x)=∣x∣ (graph D),
f(x)=−∣x∣ (graphI),
f(x)=−2∣x+2∣+4 (graphQ).
f(x)=ax2+bx+c,
f(x)=x2+8x+12 (graph T),
f(x)=x2 (graph M),
f(x)=−3x2+4 (graph F),
f(x)=−1/2x2+2x (graphB).
The function letter is shown in the table.
Carnegie Learning Algebra I Student Text Volume 1 3rd Edition Chapter 1 Exercise 1.3 Quantities And Relationships Page 41 Problem 9 Answer
Given: Consider the graphs of functions that have an absolute minimum or an absolute maximum.
To find what is the same about all the functions in each group?
Method used: Functional method.
To find the same about all the functions in each group;
The functions in Group1 is in the form off(x)=a∣x+b∣+c ,
The functions in Group 2 is of the form off(x)=ax2+bx+c.
The group1 and 2 in the form of
f(x)=a∣x+b∣+c,
f(x)=ax2+bx+c.
| Group1 | Group2 |
| D,I,Q,V | B,F,M,T |
Carnegie Learning Algebra I Student Text Volume 1 3rd Edition Chapter 1 Exercise 1.3 Quantities And Relationships Page 42 Problem 10 Answer
Given: which group represents quadratic functions and which group represents linear absolute value functions.
To identify which group represents quadratic functions and which group represents linear absolute value functions.
The method used: Functional method.
To identify which group represents;
Group 1 is in the form off(x)=a∣x+b∣+c ,
Group 1 are linear absolute value functions.
Group 2 is in the form of f(x)=ax2+bx+c
Group 2 is quadratic functions.
Group 2 represents quadratic functions and group1 represents linear absolute value functions.
Carnegie Learning Algebra I Quantities And Relationships Exercise 1.3 Solutions
Carnegie Learning Algebra I Student Text Volume 1 3rd Edition Chapter 1 Exercise 1.3 Quantities And Relationships Page 43 Problem 11 Answer
Given: Enter the remaining functions into your graphing calculator.To determine the shapes of their graphs.Method used: Graphical method.
To determine the shapes of their graphs;
Graph
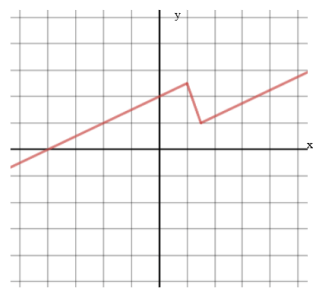
f(x)={ −2x+10,−∞≤x<3
{ 4, 3≤x<7
{ −2x+8, 7≤x≤+∞
Y1=(−2X+10)/(X<3)
Y2=(4)/((3≤X)(X<7))
Y3=(−2X+18)/(7≤X)
The shape of the graph is

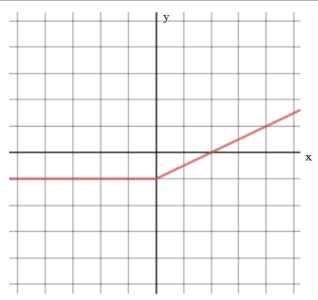
Graph
f(x)= { −2, x−2,
{ 1 −∞<x<0
{ 2 0≤x<+∞
Y1=(−2)/(X<0)
Y2=(1/2X−2)/(0≤X)
The shape of the given function is

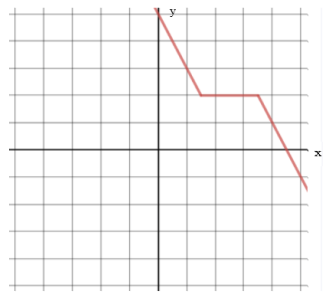
Graph
f(x)= {1/2 x+4, −∞≤x<2
{−3x+11, 2≤x<3
{ 1/ 2x+1/2, 3≤x≤+∞
Y1=(1/2X+4)/(X<2)
Y2=(−3x+11)/((2≤X)(X<3))
Y3=(1/2X+1/2)/(3≤X)
The graph of the given function
The shape of the given functions are

Exercise 1.3 Quantities And Relationships Explained
Carnegie Learning Algebra I Student Text Volume 1 3rd Edition Chapter 1 Exercise 1.3 Quantities And Relationships Page 45 Problem 12 Answer
Given: Glue your sorted graphs and functions to the appropriate function family Graphic Organizer on the pages that follow.
To write a description of the graphical behavior for each function family.
Method used: Functional method.
Linear Functions: GraphsG,L,O,U,
Increasing/Decreasing: increasing, decreasing, or constant,
Maximum/Minimum: none,
Curve/Line: Line.
Exponential Functions:
Graphs H,K,P,
Increasing/Decreasing: Only one,
Maximum /Minimum: None,
Curve/Line: Curve.
Quadratic Functions:
GraphsB,F,M,T,
Increasing/Decreasing: Both,
Maximum/Minimum: One,
Curve/Line: Curve.
Linear Absolute Value Functions:
Graphs D,I,Q,U,
Increasing/Decreasing: Both,
Maximum/Minimum: One,
Curve/Line: Two lines.
Linear Piecewise Functions:
Graphs A,C,S,
Increasing/Decreasing: Can be both,
Maximum/Minimum: None or one,
Curve/Line: Two or more lines.
The graphical behavior for each function family was explained.