
Carnegie Learning Algebra I Student Text Volume 1 3rd Edition Chapter 1 Quantities And Relationships
Page 24 Problem 1 Answer
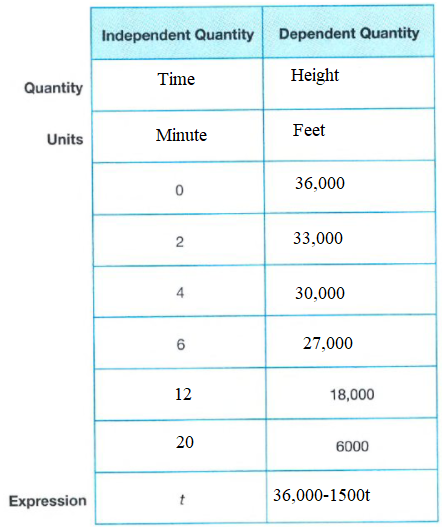
Given: At 36,000 feet, the crew aboard the 747 airplane begins making preparations to land.
The plane descends at a rate of 1500 feet per minute until it lands.
To complete the table.
Using the method of Quantity function.
To complete the table.
Using the given function,
Thus, the expression is g(t)=36,000−1500t

Completed the table with the expression g(t)=36,000−1550t
Carnegie Learning Algebra I Chapter 1 Exercise 1.2 Solutions
Carnegie Learning Algebra I Student Text Volume 1 3rd Edition Chapter 1 Exercise 1.2 Quantities And Relationships Page 25 Problem 2 Answer
Given: The airplane is at 36,000 feet
The plane descends at a rate of 1500 feet per minute until it lands.
To determine the unit of measure for each expression
Method: Mathematical reasoning
Independent Quantity and Dependent Quantity
Considering the Quantity ,Time and Height
0 36,000
2 33,000
4 30,000
6 27,000
12 18,000
20 6000
Expression 25000t/1 36,000
Write a function, g(t) to represent this problem situation.
g(t)=521500t
Think about the pattern you are used to calculate each dependent quantity value.
Using the table, I can only estimate the time. When plotting the points on my graph, I was able to approximate the intersection of the graphs of both functions.
When I used the function, I was able to determine an exact time when the plane would descend to 14,000 feet.
We can only estimate the time and we can able to determine an exact time when the plane would descend to 14,000 feet.
Page 25 Problem 3 Answer
Given: The plane descends at a rate of 1500 feet per minute until it lands.
To graph the g(t) on the coordinate plane.Using the method of the graph.
Graph which the coordinates
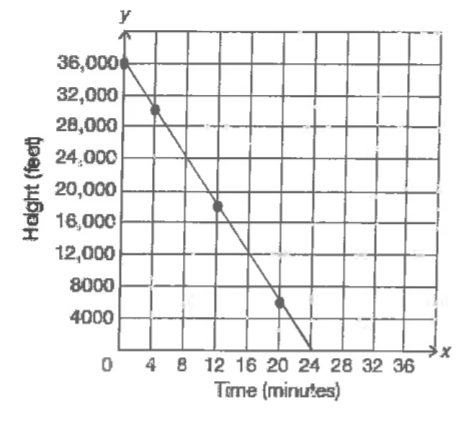
Graph of coordinates

Page 29 Problem 4 Answer
Given:
To Show why Ashley’s reasoning is correct.Using the method of Vertical line test.
To Show why Ashley’s reasoning is correct.
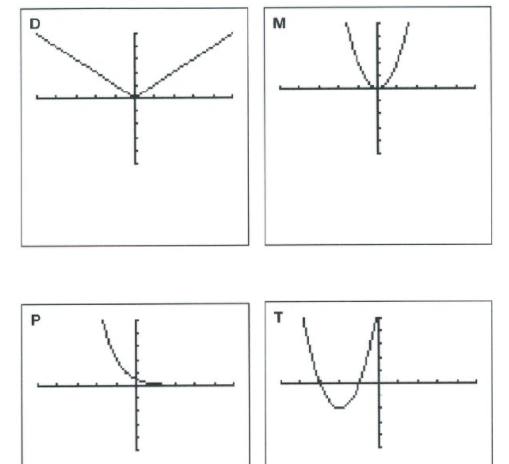
The vertical line test can be used to determine whether a graph represents a function.
Drawing any vertical line that intersects a graph more than once, then the graph does not define a function because a function has only one output value for each input value.
The axis of symmetry of a parabola is a vertical line that divides the parabola into two congruent halves.
Thus, the image is the same on both sides.
Shown that the image is same on both sides.
Page 29 Problem 5 Answer
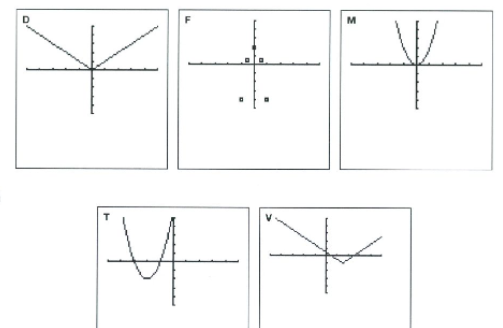
Given: The graphs together all show vertical symmetry.
To identify other graphs that show vertical symmetry.
Using determination method.
The other graphs with vertical symmetry are graphs B,E,I,Q&U.
The other possible graphs with vertical symmetry are graphs B,E,I,Q&U.
Quantities And Relationships Chapter 1 Exercise 1.2 Answers
Carnegie Learning Algebra I Student Text Volume 1 3rd Edition Chapter 1 Exercise 1.2 Quantities And RelationshipsPage 30 Problem 6 Answer
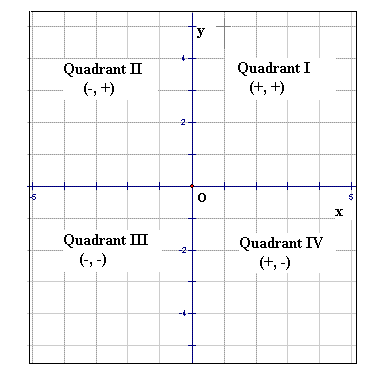
Given: Grouped these graphs together because each graph only goes through two quadrants.
To Explain why Duane’s reasoning is not correct.
Using the method of Graphical.
To Explain why Duane’s reasoning is not correct.
No, Duane’s reasoning is correct.
Because, every graph has four quadrant.
All the given four graph only goes through two quadrants.
Thus, Duane’s reasoning is correct.
Each of given graph goes through two quadrants.
So, Duane’s reasoning is correct.
Page 30 Problem 7 Answer
Given: Duane grouped the graphs together because each graph only goes through two quadrants.
To identify other graphs that only go through two quadrants.Using determination method.
The other graphs that go through only two quadrants are G,I,K,N,R&U.
The possible other graphs that go through only two quadrants are G,I,K,N,R&U.
Page 31 Problem 8 Answer
Given: Josephine grouped four graphs together, but did not provide any rationale.
To find What do you notice about the graphs Using determination method.
The graphs E,J,N&R can be together because none of them are functions.
They are not functions since they don’t pass the vertical line test.
| Functions | Non-functions |
| A,B,C,D,F | E,J,N,R |
| G,H,I,K,L | |
| M,O,P,Q,S | |
| T,U,V |
The graphs E,J,N&R are not functions.
| Functions | Non-functions |
| A,B,C,D,F | E,J,N,R |
| G,H,I,K,L | |
| M,O,P,Q,S | |
| T,U,V |
Page 31 Problem 9 Answer
Given: Josephine grouped the four graphs together, but did not provide any rationale.
To find What rationale could Josephine have providedUsing determination method.
For graphs E, the vertical line x=0 crosses the graph twice. For graph J&N, the vertical line x=2 crosses the graph twice.
For graph R, the vertical line x=2 so it will intersect infinitely many times with the vertical line x=2.
The rationale for grouping these graph is then none of the graphs pass the vertical line test so they are not functions.
The rationale for grouping these graph is then none of the graphs pass the vertical line test.
Carnegie Learning Algebra I Quantities And Relationships Exercise 1.2 Solutions
Carnegie Learning Algebra I Student Text Volume 1 3rd Edition Chapter 1 Exercise 1.2 Quantities And Relationships Page 32 Problem 10 Answer
Given: A discrete graph is a graph of isolated points.
A continuous graph is a graph of points that are connected by a line or smooth curve on the graph.
Continuous graphs have no breaks.
To find that the graphs she grouped are functions
To Explain how you determined your conclusion.
Using determination method
For graph E, the vertical line x=0 crosses the graph twice.
For graph J&N, the vertical line x=2 crosses the graph twice.
For graph R it is vertical line x=2 so it will intersect infinitely many times with the vertical line x=2 .
None of the graphs pass the vertical line test so they are not functions.
Judy grouped the four graphs together They are not functions since they don’t pass the vertical line test.
Page 32 Problem 11 Answer
Given: functions and non-functions.
Record your results by writing the letter of each graph in the appropriate column in the table shown.
Using determination method.
Only the graphs E,J,N&R fail the vertical line test. So, they are the only non-functions.
The remaining graphs are all functions.
The functions and non functions are shown.
Page 33 Problem 12 Answer
Given: the x-axis and the y -axis display values from −10 to 10 with an interval of 2 units.
To Label each function graph with the appropriate domain.
Using determination method.
The graph that are functions are graphs A, B,C,D,F,G,H,I,K,L,M,O,P,Q,S,T,U&V
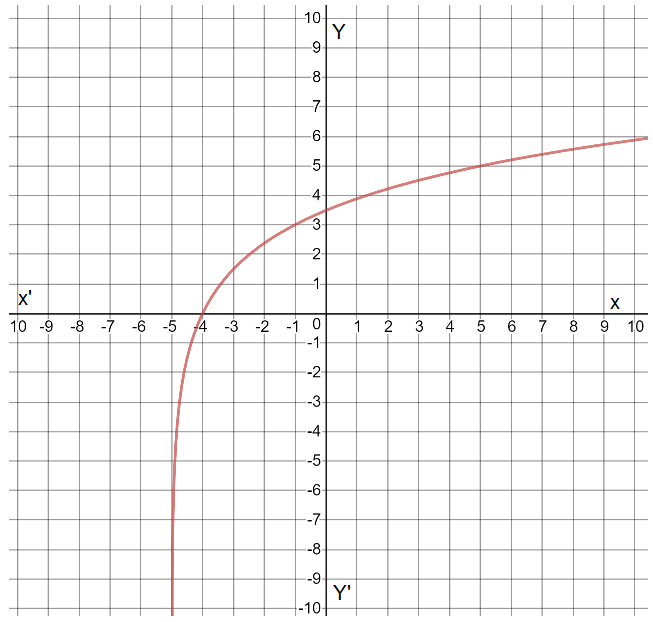
The domain will be set of all real numbers if the graph is continuous and the set of integers if the graph is discrete.
Graphs A,B, C,D,G,H,I,L,M,P,Q,S,T,U&V are continuous so they have domains of the set of all real numbers.
Graph F,K,O&U are discrete so they have domains of the set of integers.
The graphs A,B,C,D,G,H,I,L,M,P,Q,S,T,U&V have domains of the set of all real numbers.
The graph F,K,O,U have domains of the set of integers.
Carnegie Learning Algebra I Student Text Volume 1 3rd Edition Chapter 1 Exercise 1.2 Quantities And Relationships Page 33 Problem 13 Answer
Given: The relation is the mapping between a set of input values called the domain and a set of output values called the range.
To find: the mapping between the graphs
Method used : Algebraic relations
The Vertical Line Test is a visual strategy used to decide if a connection addressed as a chart is a capacity.
To apply the Vertical Line Test, think about the entirety of the upward lines that could be drawn on the chart of a connection.
In the event that any of the upward lines cross the chart of the connection at more than one point,then, at that point the connection isn’t a capacity
A discrete chart is a diagram of confined focuses.
A constant chart is a diagram of focuses that are associated by a line or smooth bend on the diagram. Consistent charts have no breaks.
The Vertical Line Test applies for both discrete and constant charts.
The graphs has been mapped and The Vertical Line Test applies for both discrete and constant charts.
Page 34 Problem 14 Answer
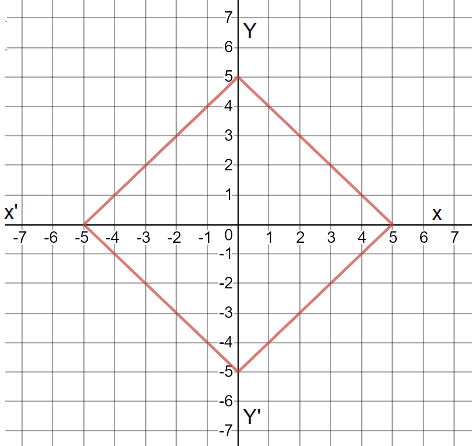
Given a graph of a function To explain what the function isMethod used vertical line test
Draw any graph that passes the vertical line test
Graph is plotted below
Since all the graphs that pass the vertical line test are functions
The graph passes through the vertical line test and so it is a function
Exercise 1.2 Quantities And Relationships Explained
Carnegie Learning Algebra I Student Text Volume 1 3rd Edition Chapter 1 Exercise 1.2 Quantities And Relationships Page 34 Problem 15 Answer
Given a graph that is not a functionTo explain that it is not a functionMethod used is vertical line test
Draw any graph that do not passes the vertical line test
Plotted the graph below
Since all the graphs that fails the vertical line test are not functions

The graph does not passes the vertical line test so it is not a function.
Chapter 1 Exercise 1.2 Carnegie Learning Guide