Big Ideas Math Algebra 1 Student Journal 1st Edition Chapter 5 Solving Systems Of Linear Equations
Page 162 Essential Question Answer
Let’s assume that inequality as a linear equation, and Find the coordinates of X−, Y− axis intersecting points.
Plot them on graph and draw a dotted(>,<) or a solid(≥,≤) line connecting those points.
Shade the area above that linear equation if the inequalities are >,≥ or below the linear equation if the inequalities are <,≤
A system of linear inequalities can be plotted on graph by using the mentioned process:
1. Let’s assume that inequality as a linear equation, and Find the coordinates of the X, and Y axis intersecting points.
2. Plot them on graph and draw a dotted (>,<) or a solid (≥,≤) line connecting those points.
3. Shade the area above that linear equations if the inequalities are >,≥ or below the linear equation if the inequalities are <,≤

Big Ideas Math Algebra 1 Chapter 5 Exercise 5.7 Solutions
Big Ideas Math Algebra 1 Student Journal 1st Edition Chapter 5 Solving Systems Of Linear Equations Exercise 5.7 Page 162 Exercise 1 Answer
Given: Linear function 2x + y ≤ 4
Let’s assume it a linear equation, and Find coordinates of X, Y− axis intersecting points.
Plot them on graph and draw a dotted line connecting those points.
Shade the area below that linear equation.
On X− axis (x,0) coordinates are (2,0)
On Y− axis (0,y) coordinates are (0,4)
Plot the coordinates on the graph

Graph and inequality 2x + y ≤ 4 matches each other, as the given graph and solved graph showing same picture
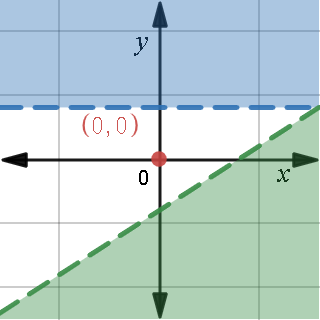
Given: Linear function, 2x−y ≤ 0
Let’s assume it a linear equation, and Find the coordinates of X, Y− axis intersecting points.
Plot them on graph and draw a solid line connecting those points.
Shade the area below that linear equation.
On X− the axis (x,0) coordinates are (0,0).
Since line passes through the origin, let’s take another coordinate of x, i.e. (2,y).
Another coordinates are (2,4)
Plot coordinates on graph
Graph and inequality 2x−y ≤ 0 matches each other, as the given graph and solved graph showing the same picture

Solving Systems Of Equations Exercise 5.7 Answers
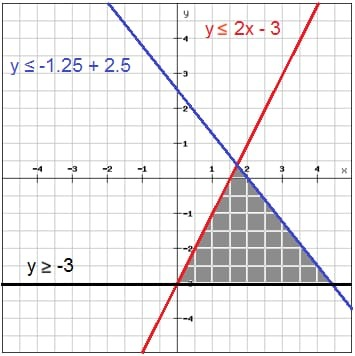
Big Ideas Math Algebra 1 Student Journal 1st Edition Chapter 5 Solving Systems Of Linear Equations Exercise 5.7 Page 162 Exercise 2 Answer
The given inequalities are:
⇒ 2x + y ≤ 4
⇒ 2x − y ≤ 0
Plot for the inequalities will be

Since both inequalities are ≤ type, therefore, we shaded the reason left to the lines.
From the graph, the conclusion can be drawn that the point lies in the intersection of the shaded regions are the solutions of given linear inequalities.
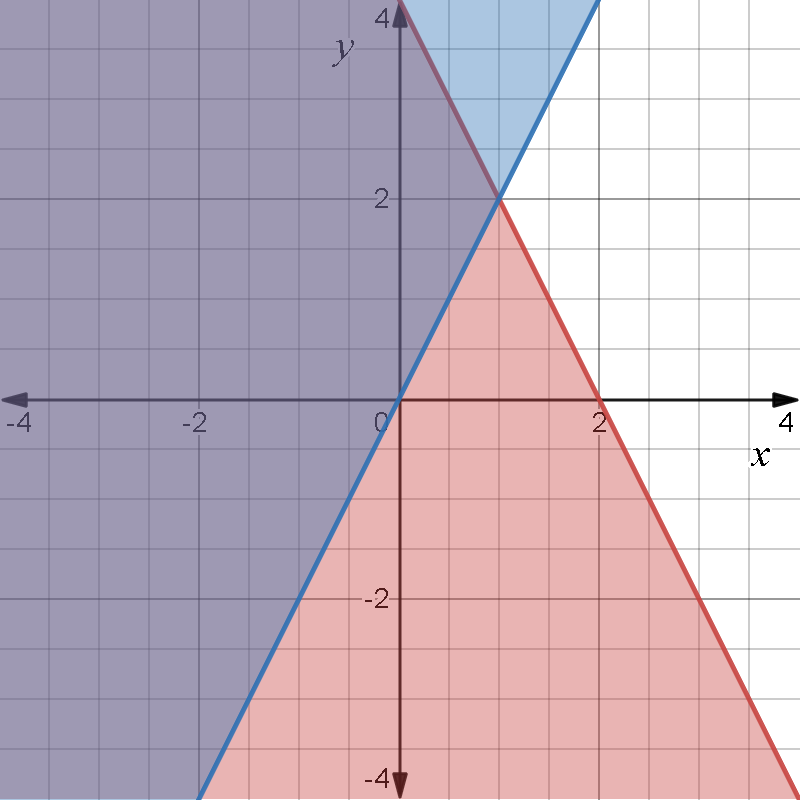
The inequalities are:
⇒ 2x + y ≤ 4
⇒ 2x−y ≤ 0
The plot for the above inequalities is

Since both inequalities are less than equal to type. The red shaded region is a set of all points which satisfy the inequality one.
Similarly, the blue-shaded region is the set of all points which satisfy the 2nd inequality.
The intersection of two shaded regions is the set of all points which satisfy both the inequalities.
The unshaded region of the graph is a set of all points that satisfy none of the inequalities.
The region covered by intersection of two shaded regions. Will be the solution to linear inequalities The unshaded region of the graph is a set of all points that satisfy none of the inequalities. 2x+y≤4, 2x−y≤0 Graph :

Page 163 Exercise 3 Answer
Given: How can you graph a system of linear inequalities?
Pick one point that is not on either line and decide whether these coordinates satisfy the inequality or not.
If they do, shade the half-plane containing that point.
If they don’t, shade the other half-plane.
Graph each of the inequalities in the system in a similar way.
The solution of the system of inequalities is the intersection region of all the solutions in the system.
Pick one point that is not on either line and decide whether these coordinates satisfy the inequality or not. If they do, shade the half-plane containing that point. If they don’t, shade the other half-plane. Graph each of the inequalities in the system in a similar way.
The solution of the system of inequalities is the intersection region of all the solutions in the system.
Big Ideas Math Algebra 1 Student Journal 1st Edition Chapter 5 Solving Systems Of Linear Equations Exercise 5.7 Page 163 Exercise 4 Answer
Our aim is to find a region that represents, the solution of a system of linear inequalities when the graphing happens.
Let us consider an example of a system of linear inequalities.
⇒ y < 3
⇒ y > x−4
Following is graphing of the system.

In this graph, a region covered by both colors red and blue is the solution of the system.
When a graphing of a system of linear inequalities, then intersections of all shaded regions represent the solution of the system. This is where the solution of the system lies.

In this graph, a region covered by both colors red and blue is the solution of the system.
Page 163 Exercise 5 Answer
Given: That Do you think all systems of linear inequalities have a solution? Explain your reasoning.
The solution of a linear inequality is the ordered pair that is a solution to all inequalities in the system and the graph of the linear inequality is the graph of all solutions of the system.
Graph one line at the time in the same coordinate plane and shade the half-plane that satisfies the inequality.
The solution region which is the intersection of the half-planes is shown in a darker shade.
Usually, only the solution region is shaded which makes it easier to see which region is the solution region.
A system of linear inequalities can have none, one, or an infinite number of solutions; therefore, there are three.
Big Ideas Math Student Journal Exercise 5.7 Explained
Big Ideas Math Algebra 1 Student Journal 1st Edition Chapter 5 Solving Systems Of Linear Equations Exercise 5.7 Page 163 Exercise 6 Answer
Given that:

To prove: Use the graph’s shading to determine which way your inequality sign will face.
This works for single inequalities as well as systems of inequalities.
If you have more than one line on the graph, you’ll need to use these steps to write more than one inequality.
One of the lines has the equation y=3 As the solution is below it and the line is strong we can write the first inequality can write the first inequality y≤3 The other line has the equation x = 2. As shown in the graph
As the solution is at the left of it and the line is strong we can write the second inequality x ≤ 2 The system is \(\left\{\frac{y \leq 3}{x \leq 2}\right. \)
The equation of the given graph is: \(\left\{\frac{y \leq 3}{x \leq 2}\right. \)
Page 165 Exercise 1 Answer
Considered inequalities are
⇒ y > 2
⇒ y < x−2
Our aim is to check whether the point (0, 0) is the solution to the inequalities or not. Steps to be followed as:
1. Plot the inequalities.
2. Check that the point (0,0) is inside the feasible region or outside the feasible region.
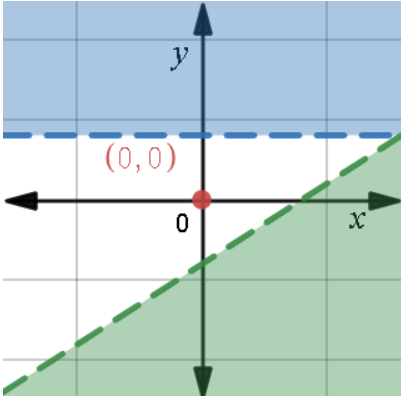
If (0,0) is inside the feasible region, then it will be the solution to the given inequalities otherwise not a solution.
Following is the plot for the given inequalities:
It is clear that the point (0,0) lies outside of the feasible region, which indicates that the point (0, 0) is not the solution to the inequalities.
⇒ y > 2
⇒ y < x − 2
Chapter 5 Exercise 5.7 Solving Systems Practice
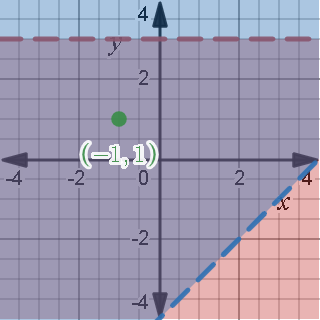
Page 165 Exercise 2 Answer
Provided linear inequalities provided are:
⇒ y < 3
⇒ y > x − 4
We have to check whether the point (−1,1) is solution to the inequalities or not. Steps to be followed:
1. Plot the given inequalities and the point in the graph.
2. Check whether the point lies inside the feasible region or not, if yes the point is the solution to those inequalities.
The following is graph corresponds to inequalities:
⇒ y < 3
⇒ y > x − 4

From the graph, it is clear that point (−1,1) lies in the feasible region
The point (−1,1) is the solution to the inequalities:
⇒ y < 3
⇒ y > x − 4
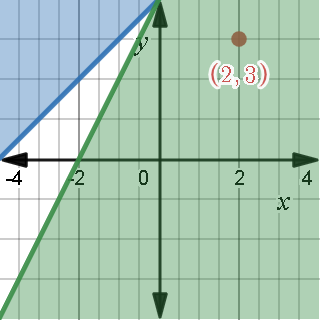
Big Ideas Math Algebra 1 Student Journal 1st Edition Chapter 5 Solving Systems Of Linear Equations Exercise 5.7 Page 165 Exercise 3 Answer
Given: The system of inequalities is
⇒ y ≥ x + 4
⇒ y ≤ 2x + 4
We need to check that the point (2,3) is the solution to the above system of inequalities. The sequence to solve the problem is:
1. Make a graph for the given inequalities and the given point.
2. Observe that the point is on the feasible region, if yes then it will be a solution, otherwise not a solution.
Le us draw the graph.

It is clear that point (2,3) does not lie on the feasible region(solution space).
Point (2,3) is not a solution to the system of linear inequalities:
⇒ y ≥ x + 4
⇒ y ≤2x + 4
Page 165 Exercise 4 Answer
Given: A system of linear inequalities is
⇒ y ≤−x + 4
⇒ y ≥ 5x −3.
We have to check that point (0,4) is a solution of the system or not. We have to follow the steps:
1. Plot a graph corresponding to linear inequalities and the point.
2. Check that the point lies in a feasible region, if yes, then it will be a solution, otherwise not a solution.
The graph for the above system of inequality is
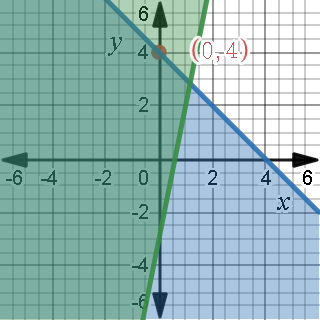
Since point (0,4) lies on the feasible region, therefore it is a solution of the given system.
Point (0,4) is a solution of the system of inequalities:
⇒ y ≤−x + 4
⇒ y ≥ 5x −3

Big Ideas Math Algebra 1 Exercise 5.7 Guide
Big Ideas Math Algebra 1 Student Journal 1st Edition Chapter 5 Solving Systems Of Linear Equations Exercise 5.7 Page 165 Exercise 6 Answer
The system of linear inequalities provided to us
⇒ y < 3
⇒ x < 2.
We have to draw a graph corresponding to the system for that we have to go through the following steps:
1. Since the first inequality involves strictly less than type, so the dashed line will be drawn. It will be parallel to the x-axis at a distance of 3 units. A region must be shaded just above the line.
2. Similarly, for the first step, draw a dashed line parallel to the y-axis at a distance of two units. The region is covered left to the line.
Here is the graph corresponding to the system
Graph for the system of inequalities:
⇒ y < 3
⇒ x < 2
will be graph:

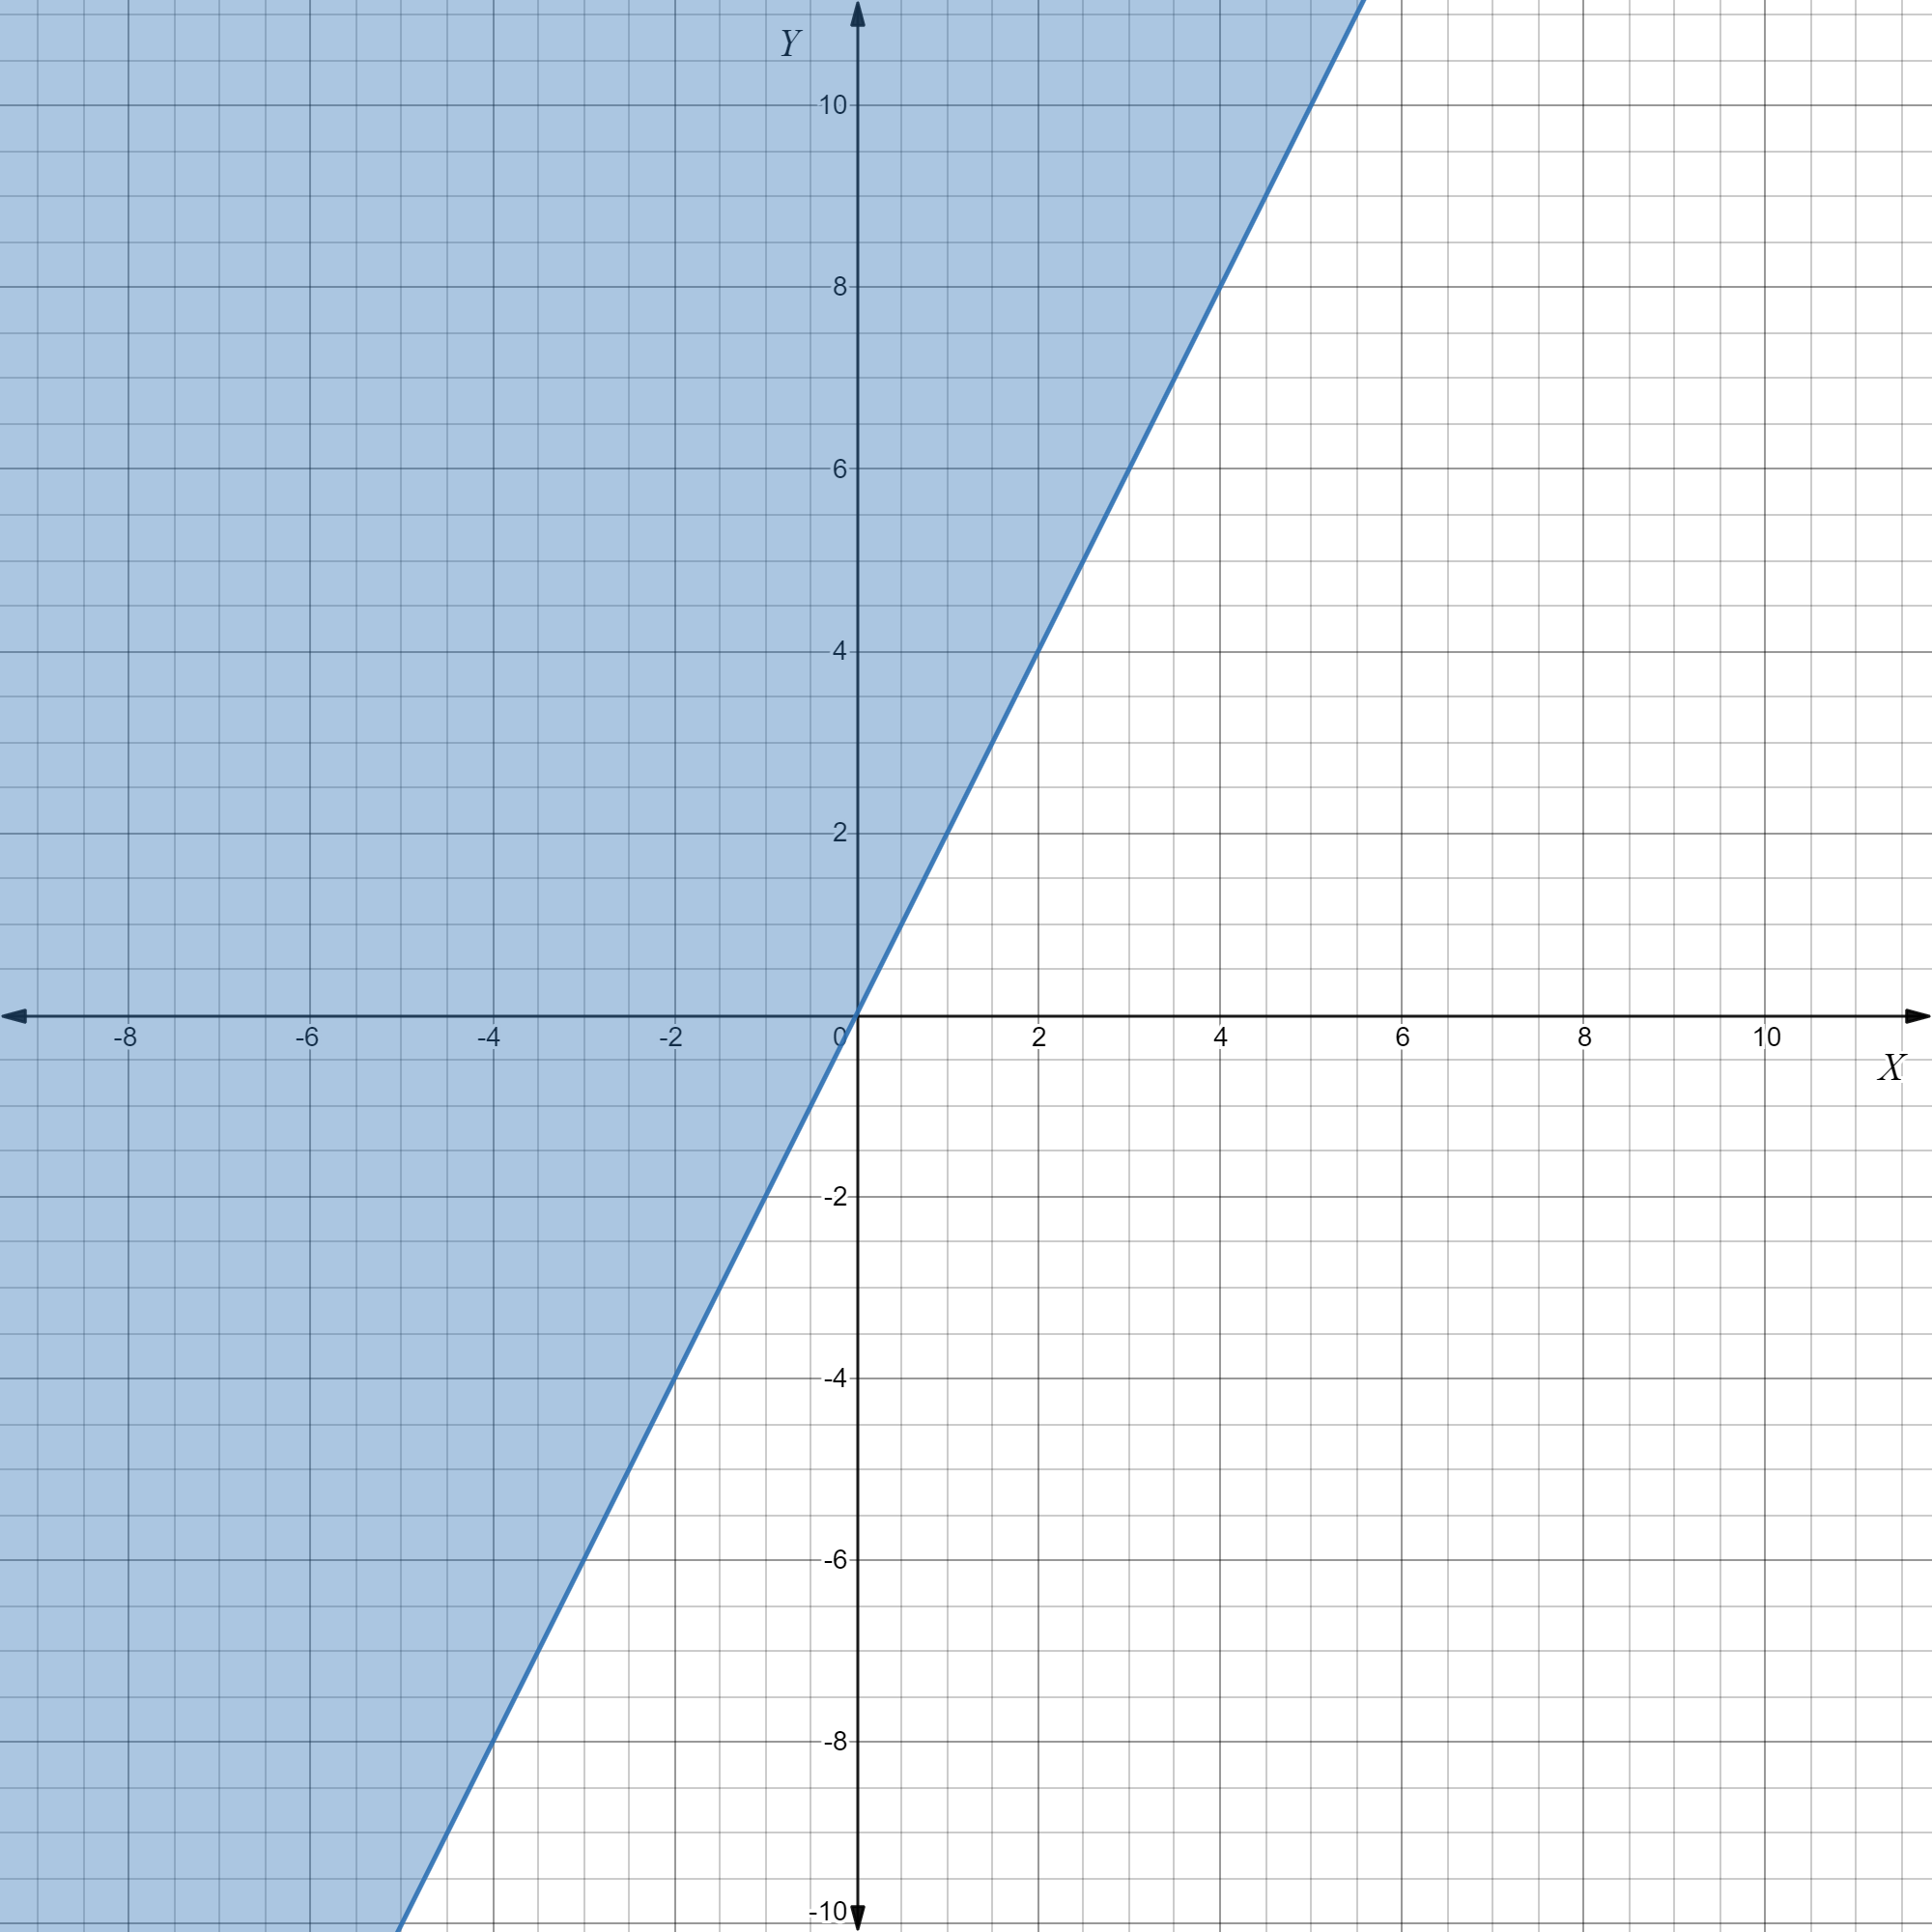
Page 166 Exercise 7 Answer
Given: A system of linear inequalities is
⇒ y ≥ x−2
⇒ y <−x + 2.
We have to draw a graph corresponding to the system for that we have to go through the following steps:
1. Since the first inequality contains greater than equal to type inequality. So, we have to draw the line y=x−2 and shade the region above the line.
2. Since 2nd inequality consists of strictly less than type inequality. So, draw the dashed line y=−x+2 and shade the region below the line.
Following graph will be obtained:
Graph for the system of inequalities:
⇒ y ≥ x−2
⇒ y <−x + 2
will be graph:

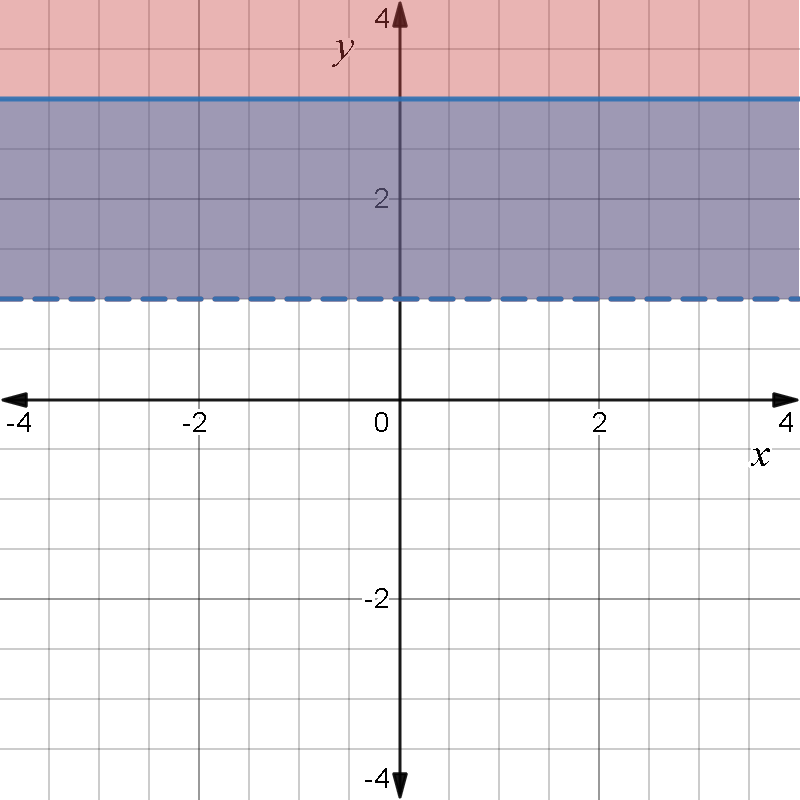
Page 166 Exercise 8 Answer
The given system of linear inequalities is
⇒ 2x + 3y < 6
⇒ y−1 ≥− 2x
We have to draw a graph corresponding to the system for that we have to go through the following steps:
1. Since the first inequality contains less than type inequality. So, we have to draw a dashed line for 2x+3y=6 and shade the region below the line.
2. Since 2nd inequality contains greater than equal to type inequality. So, draw the line y−1=−2x and shade the region above the line.
Here is the graph corresponding to the systems of given inequalities
Graph for the system of inequalities:
⇒ 2x + 3y <6
⇒ y−1 ≥−2x
will be graph:

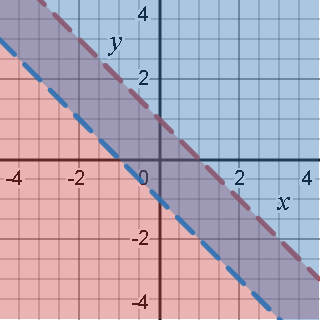
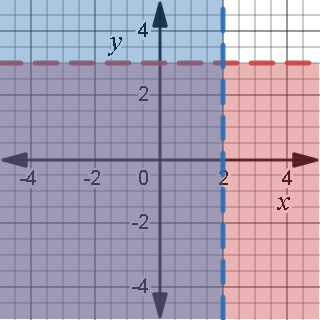
Page 166 Exercise 10 Answer
The given graph is

For the dashed line, there will be > inequality because the line is not connected and the red-shaded region is just above the dashed line.
For the non-breakable line there will be ≥ because the line is connected and the blue-shaded region is just below the line.
So, the linear inequality for the dashed line is y>1 and the connected line for the non-dashed is y≤3
y > 1 and y ≤ 3 are the linear inequality for the given graph:
How To Solve Exercise 5.7 Big Ideas Math Chapter 5
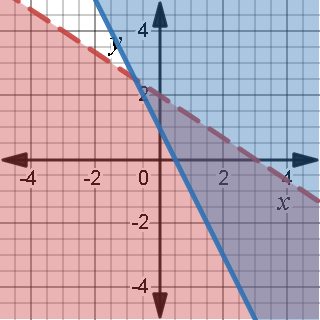
Big Ideas Math Algebra 1 Student Journal 1st Edition Chapter 5 Solving Systems Of Linear Equations Exercise 5.7 Page 165 Exercise 11 Answer
The graph is

Linear inequality for the given graph will be y−x ≥1 and x + y ≤ 1:
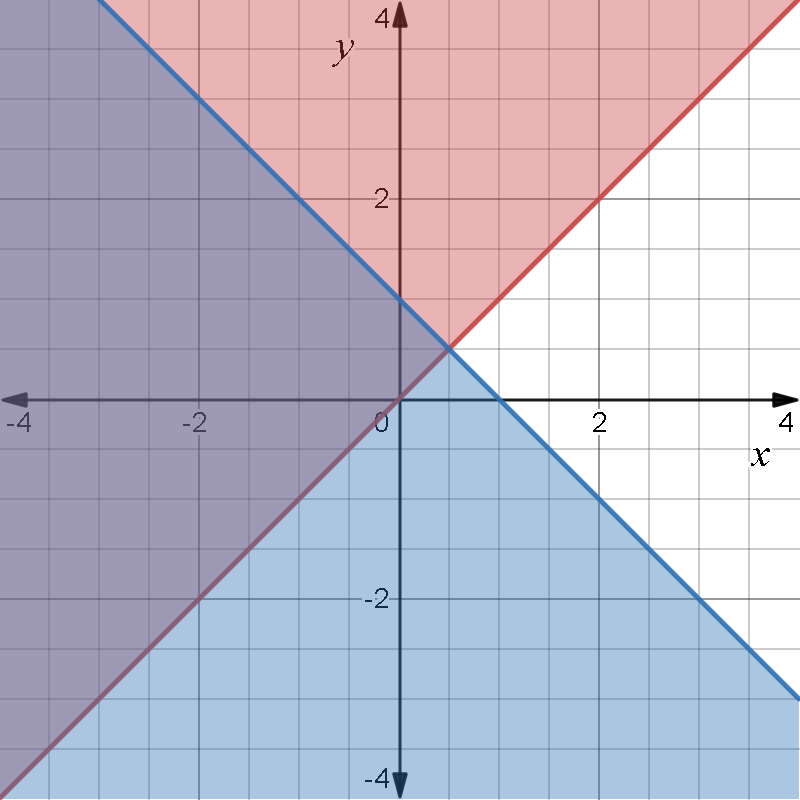
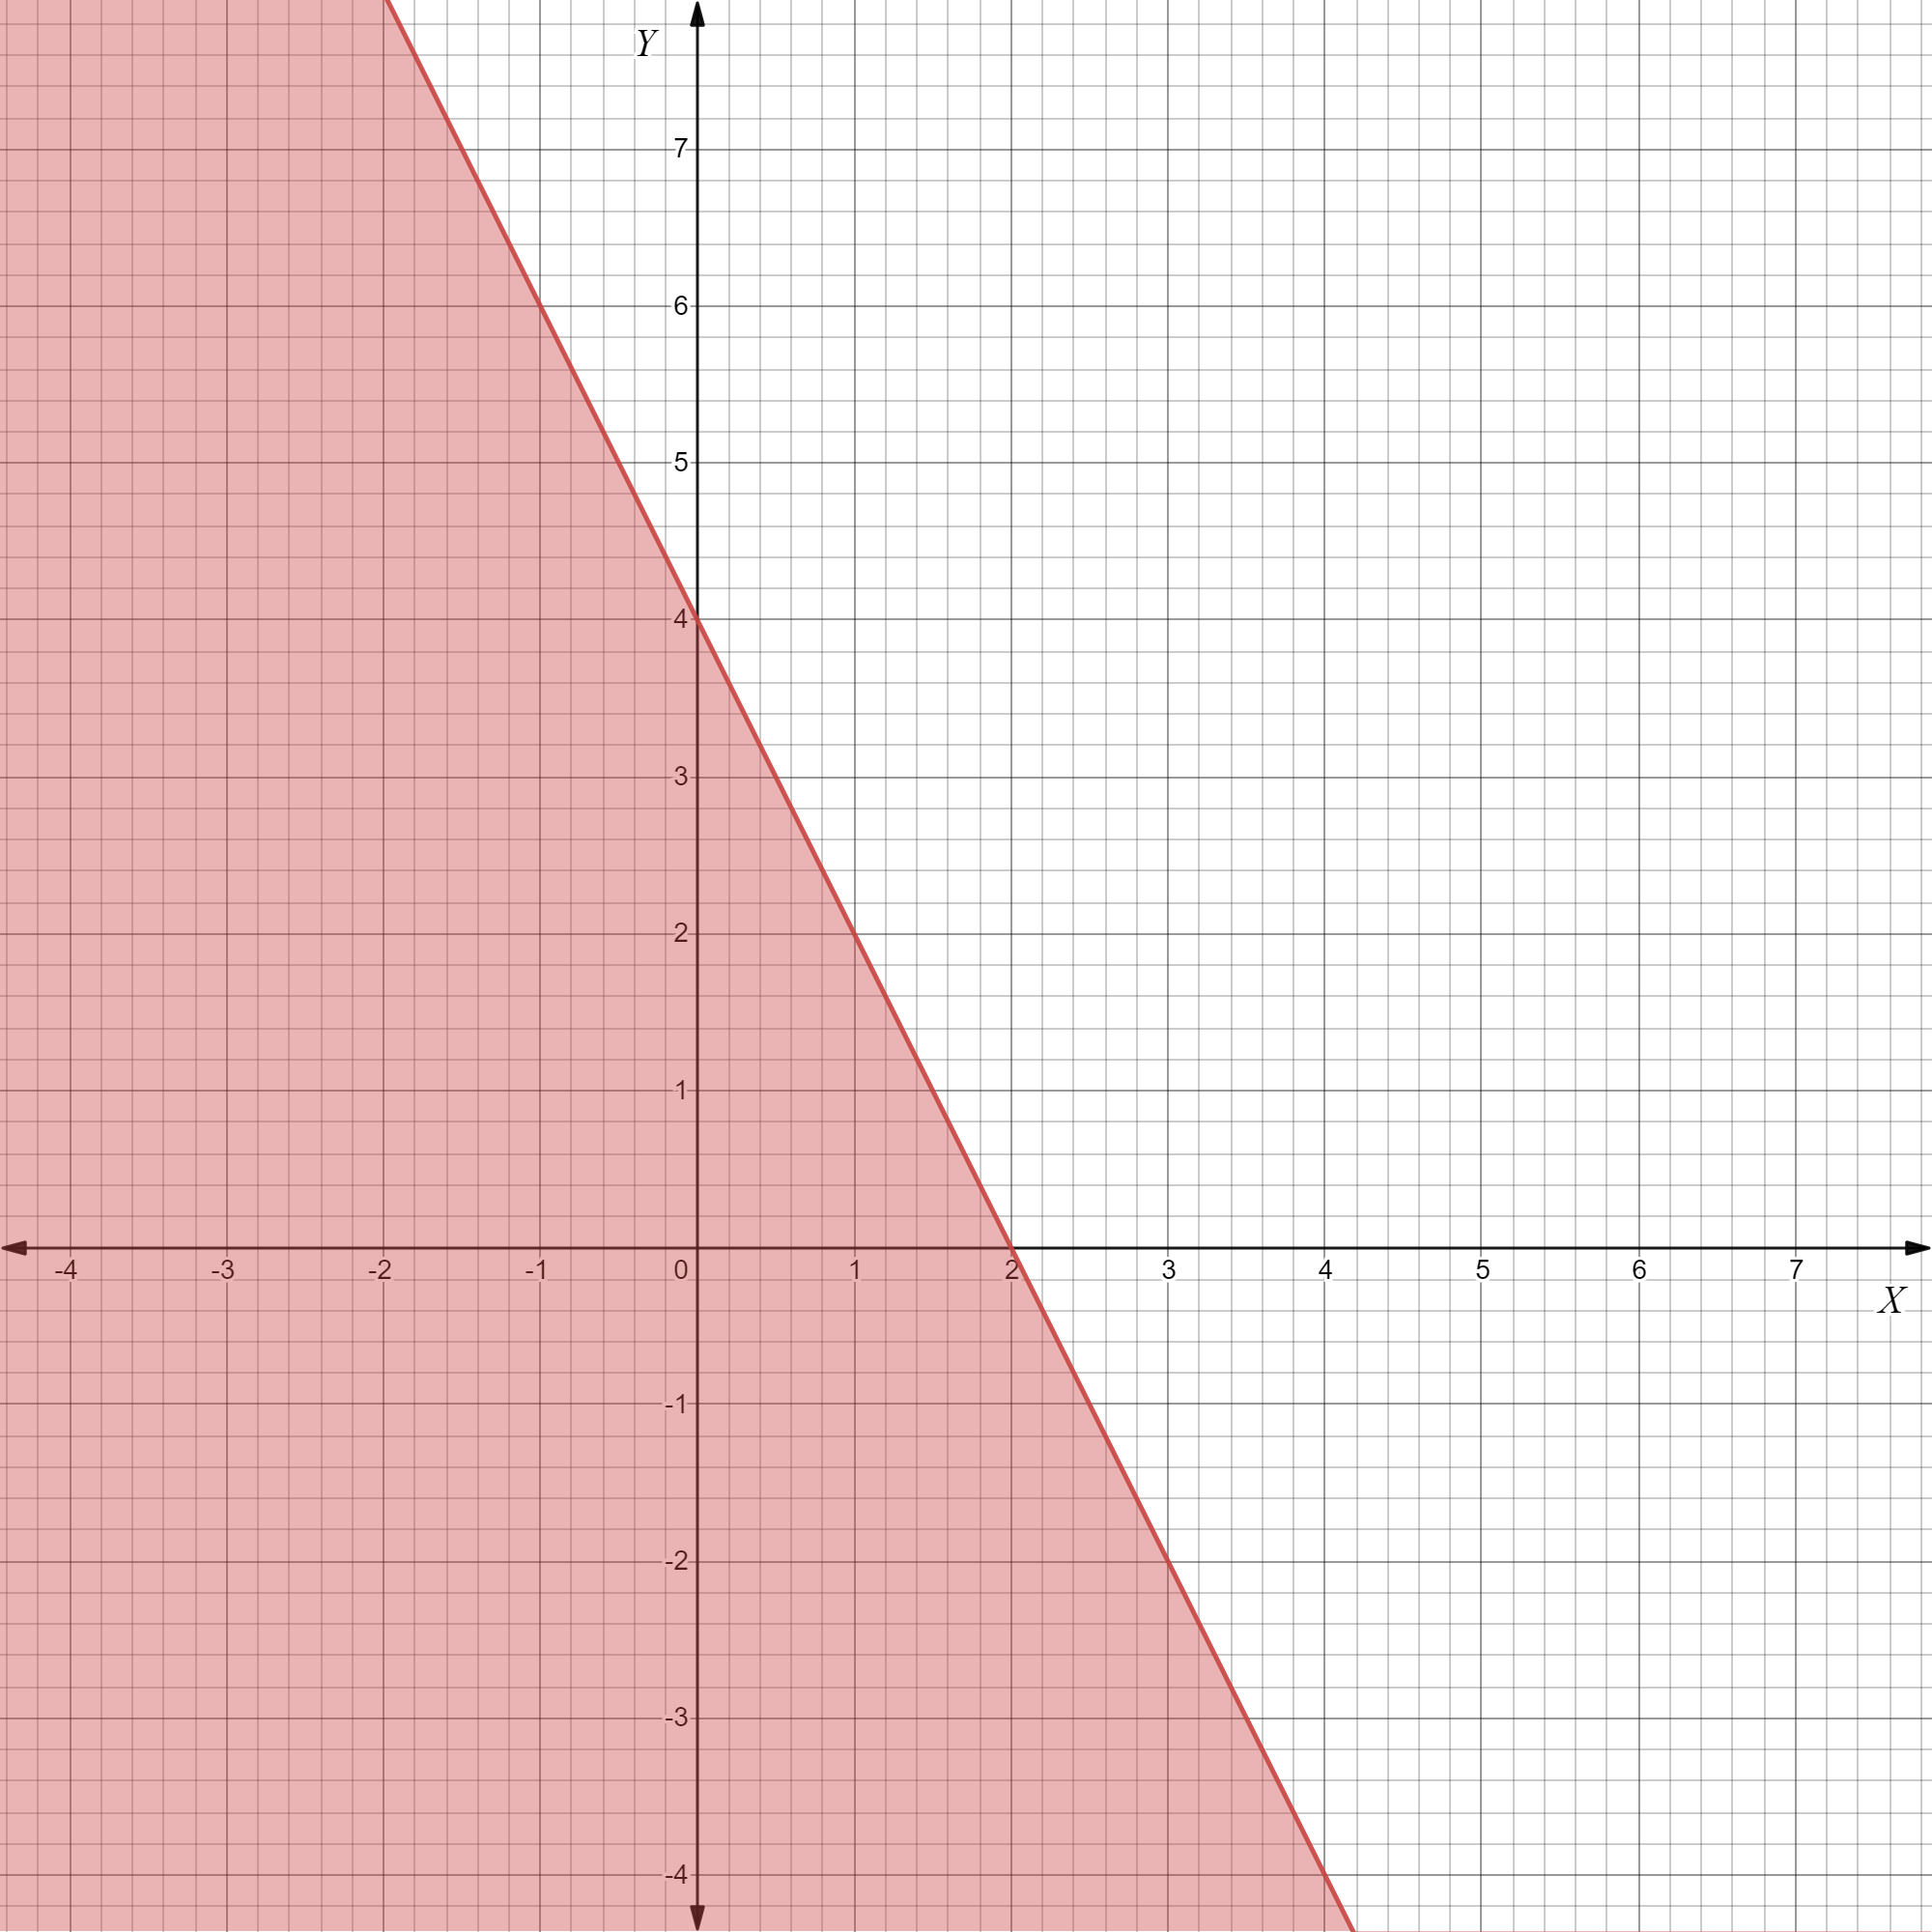
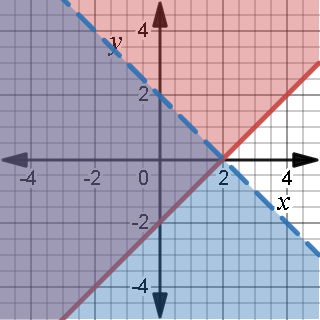
Page 166 Exercise 12 Answer
The graph provided to us is

We have to find the linear inequalities for the graph.
The general form of a line is given by y=mx+c, where m is the slope of the line and c is the intercept at the y-axis.
The slop of the line passing from the two points (x1,x2) and (y1,y2)are given by \(m=\frac{y_2-y_1}{x_2-x_1}\)
The following sequence must be followed to complete the solutions:
find the equations of the lines(blue and red).
Replace the= sign with suitable inequality signs <or>.
If the shaded region is below the line put <
If the shaded region is above the line put >.
A system of linear inequalities:
⇒ y + x < 1
⇒ y−x >−1
Represents the graph