
Big Ideas Math Algebra 1 Student Journal 1st Edition Chapter 5 Solving Systems Of Linear Equations
Page 157 Essential Question Answer
In the above-given question, It is asked how one can graph a linear inequality in two variables.
Since a solution of a linear inequality in two variables is an ordered pair(x,y) for which the inequality is true.
The graph of a linear inequality in two variables shows all the solutions of the inequality in a coordinate plane.
We will give an example of inequality to prove the above.
Consider the inequality in two variables y ≥ −x − 5.
The graph of the inequality y ≥ −x − 5 is
Since y ≥ −x−5.
Put x = −2 and y = −2 in the above inequality, and we get
−2≥−(−2)−5
⇒ −2≥2−5
⇒ −2≥−3
Hence the inequality y ≥−x−5 is true for (−2,−2).
Therefore (−2,−2) is the solution for the inequality y ≥−x−5.
1. Graph of the inequality y ≥ −x−5

2. (-2,-2) is the solution of the inequality y ≥ −x−5.
Big Ideas Math Algebra 1 Chapter 5 Exercise 5.6 Solutions
Page 157 Exercise 1 Answer
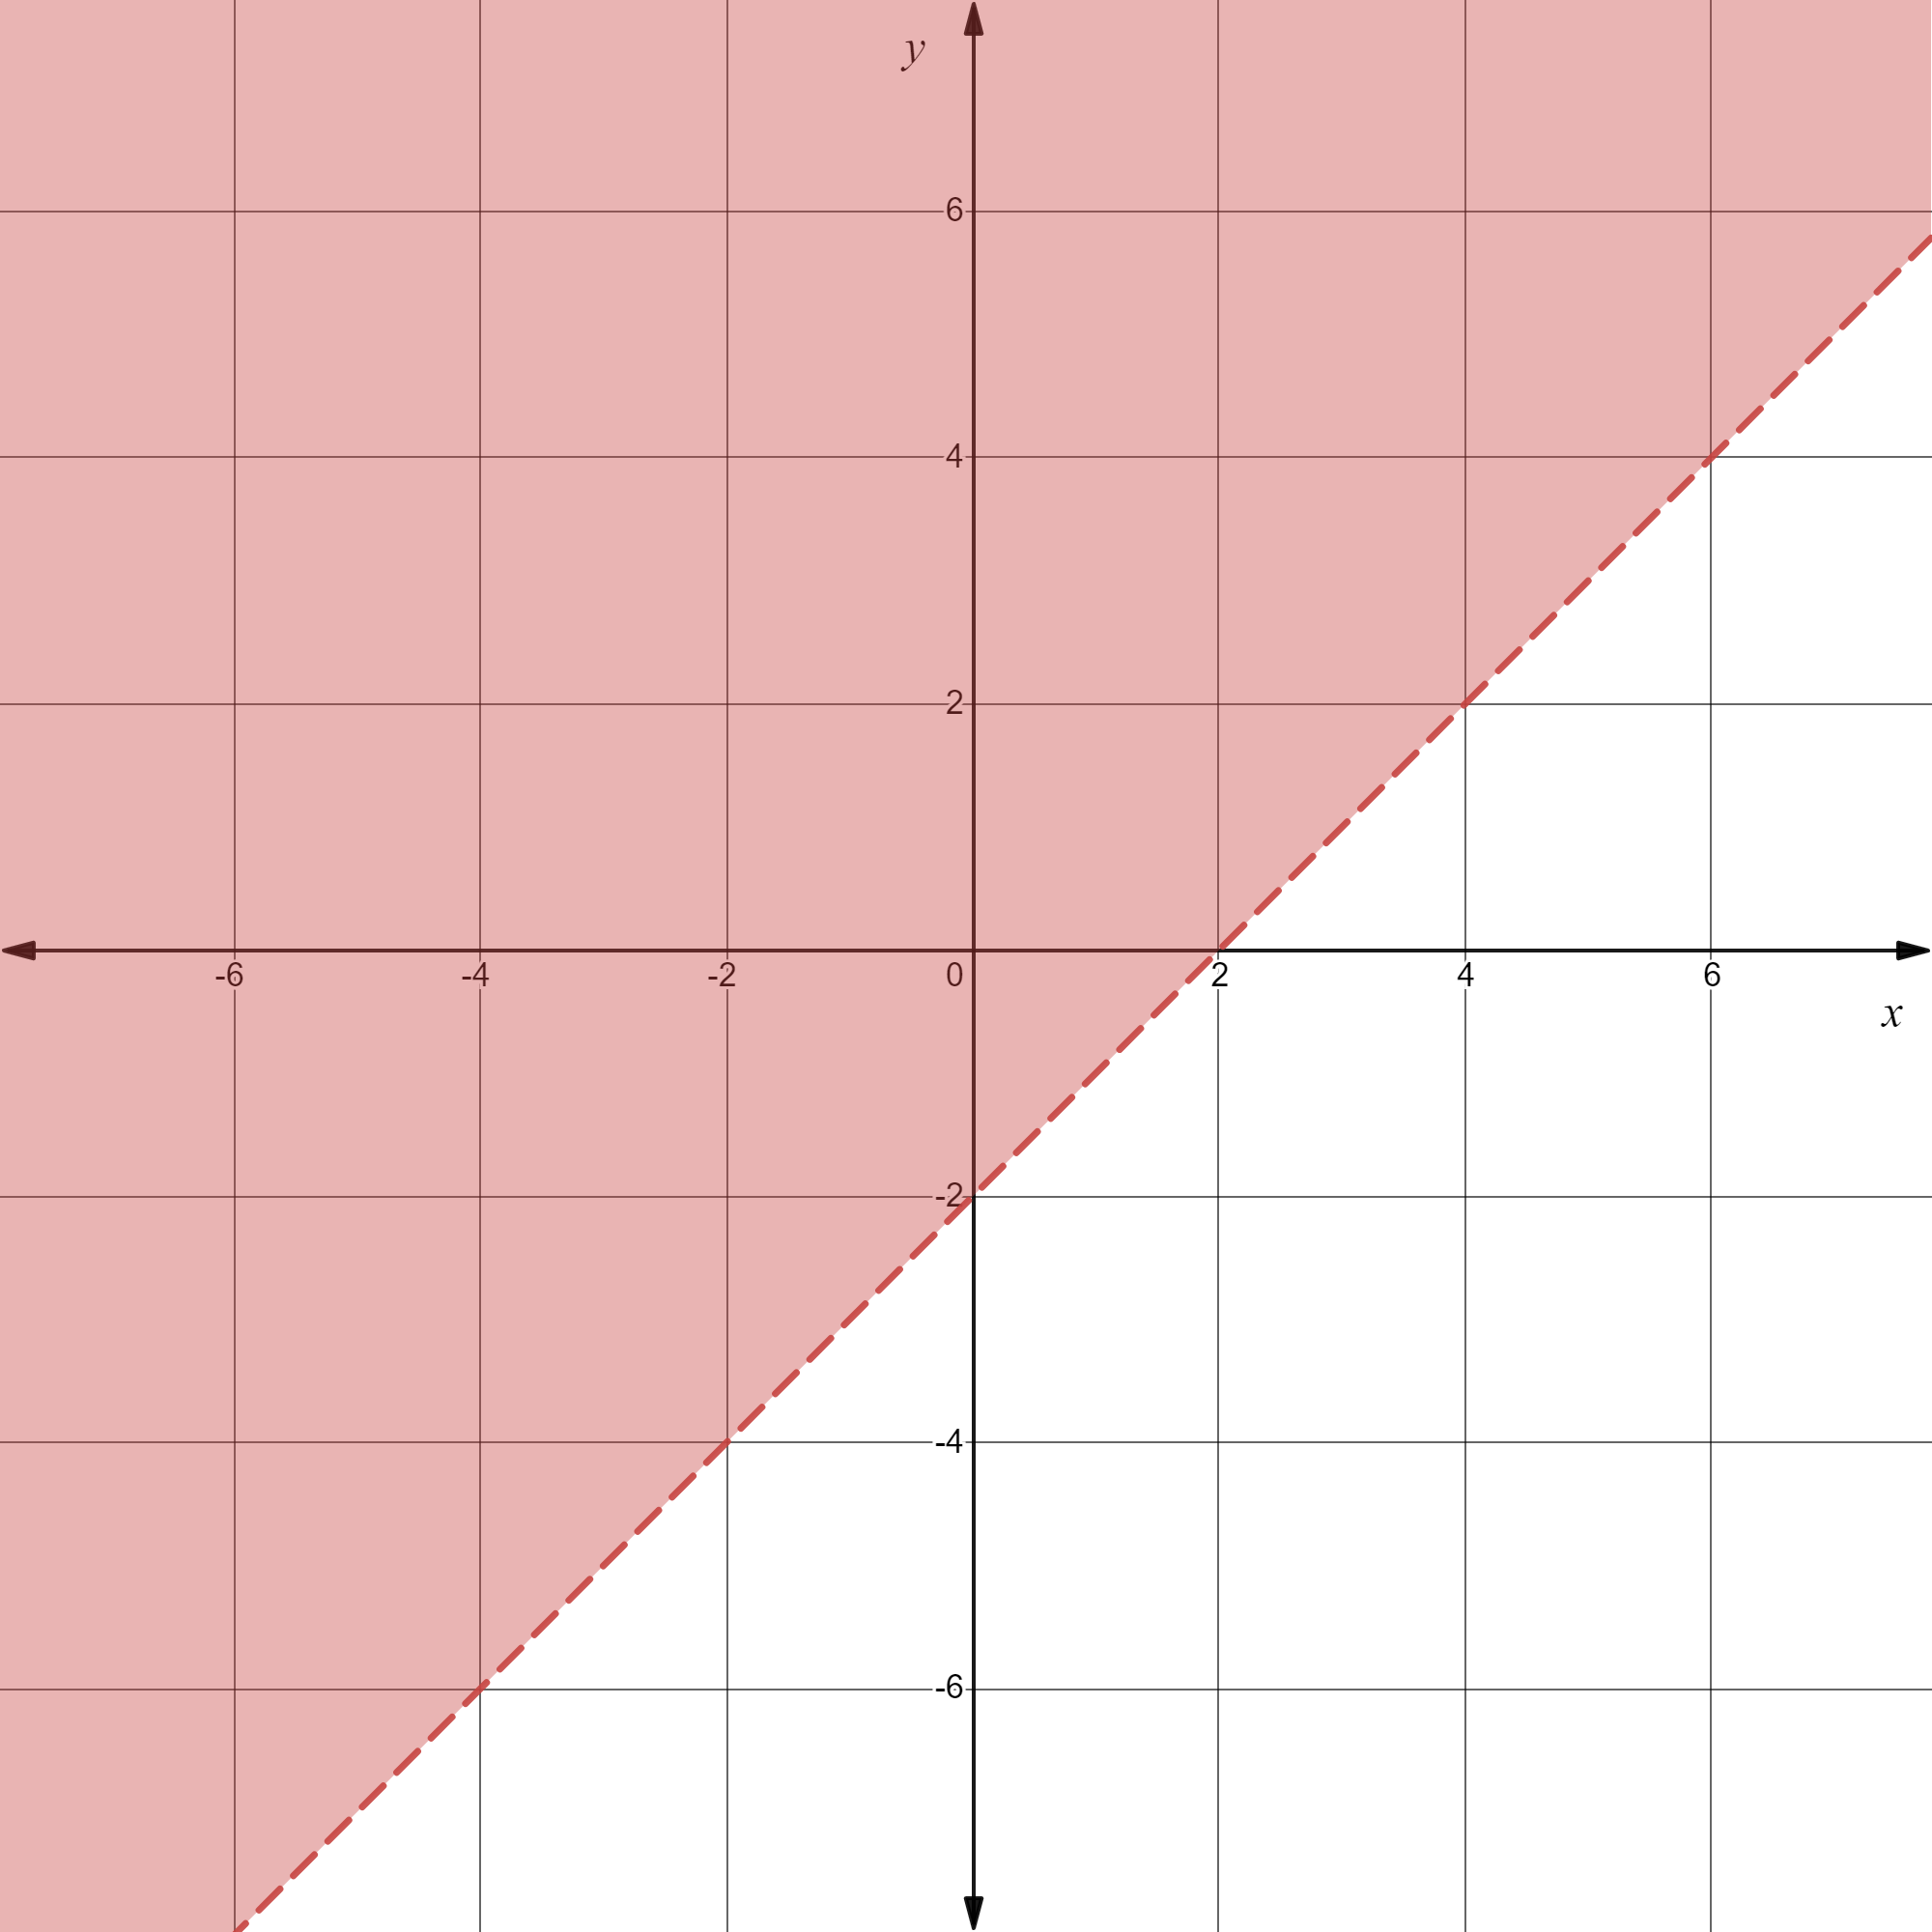
In the above-given question, we were asked to write an equation represented by the dashed line in the given graph.
To solve the above we will use the Point slope form to write an equation of a line.
We calculate the slope of the dashed line given in the graph and consider one of the points on the line.
From the given graph, we have the points (3,0) and (0,−3) on the dashed line.
Therefore the slope of the dashed line is given by
m=\(\frac{-3-0}{0-3} \)
\(\frac{-3}{-3}\)
=1
Therefore the slope(m) of the dashed line is 1.
Since the slope of the dashed line is 1 and (0,−3) is one of the points on the dashed line.
Therefore the equation of the dashed line by the point-slope form is given by
y−y1= m(x−x1) ……(1)
Put x1 = 0, y1 = −3 and m = 1 in the above equation, we get
y−(−3) = 1(x−0)
⇒ y+3 = x
⇒ y = x−3
Therefore y = x−3 is the equation of the dashed line.
An equation represented by the dashed line is y = x−3.
In the above-given question, the solutions of the inequality are represented by the shaded region below the dashed line y = x−3.
We were asked, to describe the solutions to the inequality represented by the shaded region.
We make use of the given graph to solve the above.
Since the line y = x−3 is represented by the dashed line.
Therefore the shaded region includes all points below the line y = x−3 but does not contain the points on the line y = x−3.
Hence the solutions of the inequality include points below the line y = x−3 and does not contain the points on the line y = x−3.
The solutions of an inequality represented by the shaded region include the points below the dashed line y=x−3 that does not contain the points on the line.
In the above-given question, we were asked to write an inequality that represents the above graph.
We make use of the given graph to solve this.
In the above graph, the solutions of the inequality are represented by the shaded region that is below the dashed line y=x−3.
Since the solutions of the inequality include all the points below the dashed line and no points on the dashed line.
Hence the values of y are always less than x−3.
Therefore we use strictly less than (<) sign to represent the graph.
Therefore corresponding inequality that represents the graph is y<x−3.
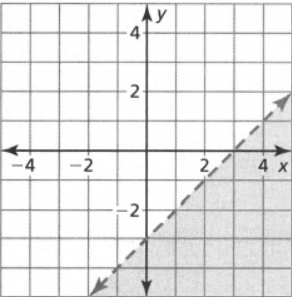
The inequality represented by the graph is y< x−3.

Big Ideas Math Algebra 1 Student Journal 1st Edition Chapter 5 Solving Systems Of Linear Equations Exercise 5.6 Page 157 Exercise 2 Answer
Given: Inequality y ≥ \(\frac{1}{4} x-3\).
We asked to enter the equation y\(=\frac{1}{4} x-3\) inside the graphing calculator.
To solve the above we simply enter the equation y=\(\frac{1}{4} x-3\) inside the calculator to get the desired result.
By entering the equation y=\(\frac{1}{4} x-3\) into the calculator, we get the graph of y=\(\frac{1}{4} x-3\)
Therefore the graph of y=\(\frac{1}{4} x-3\)after entering the corresponding equation inside the calculator is
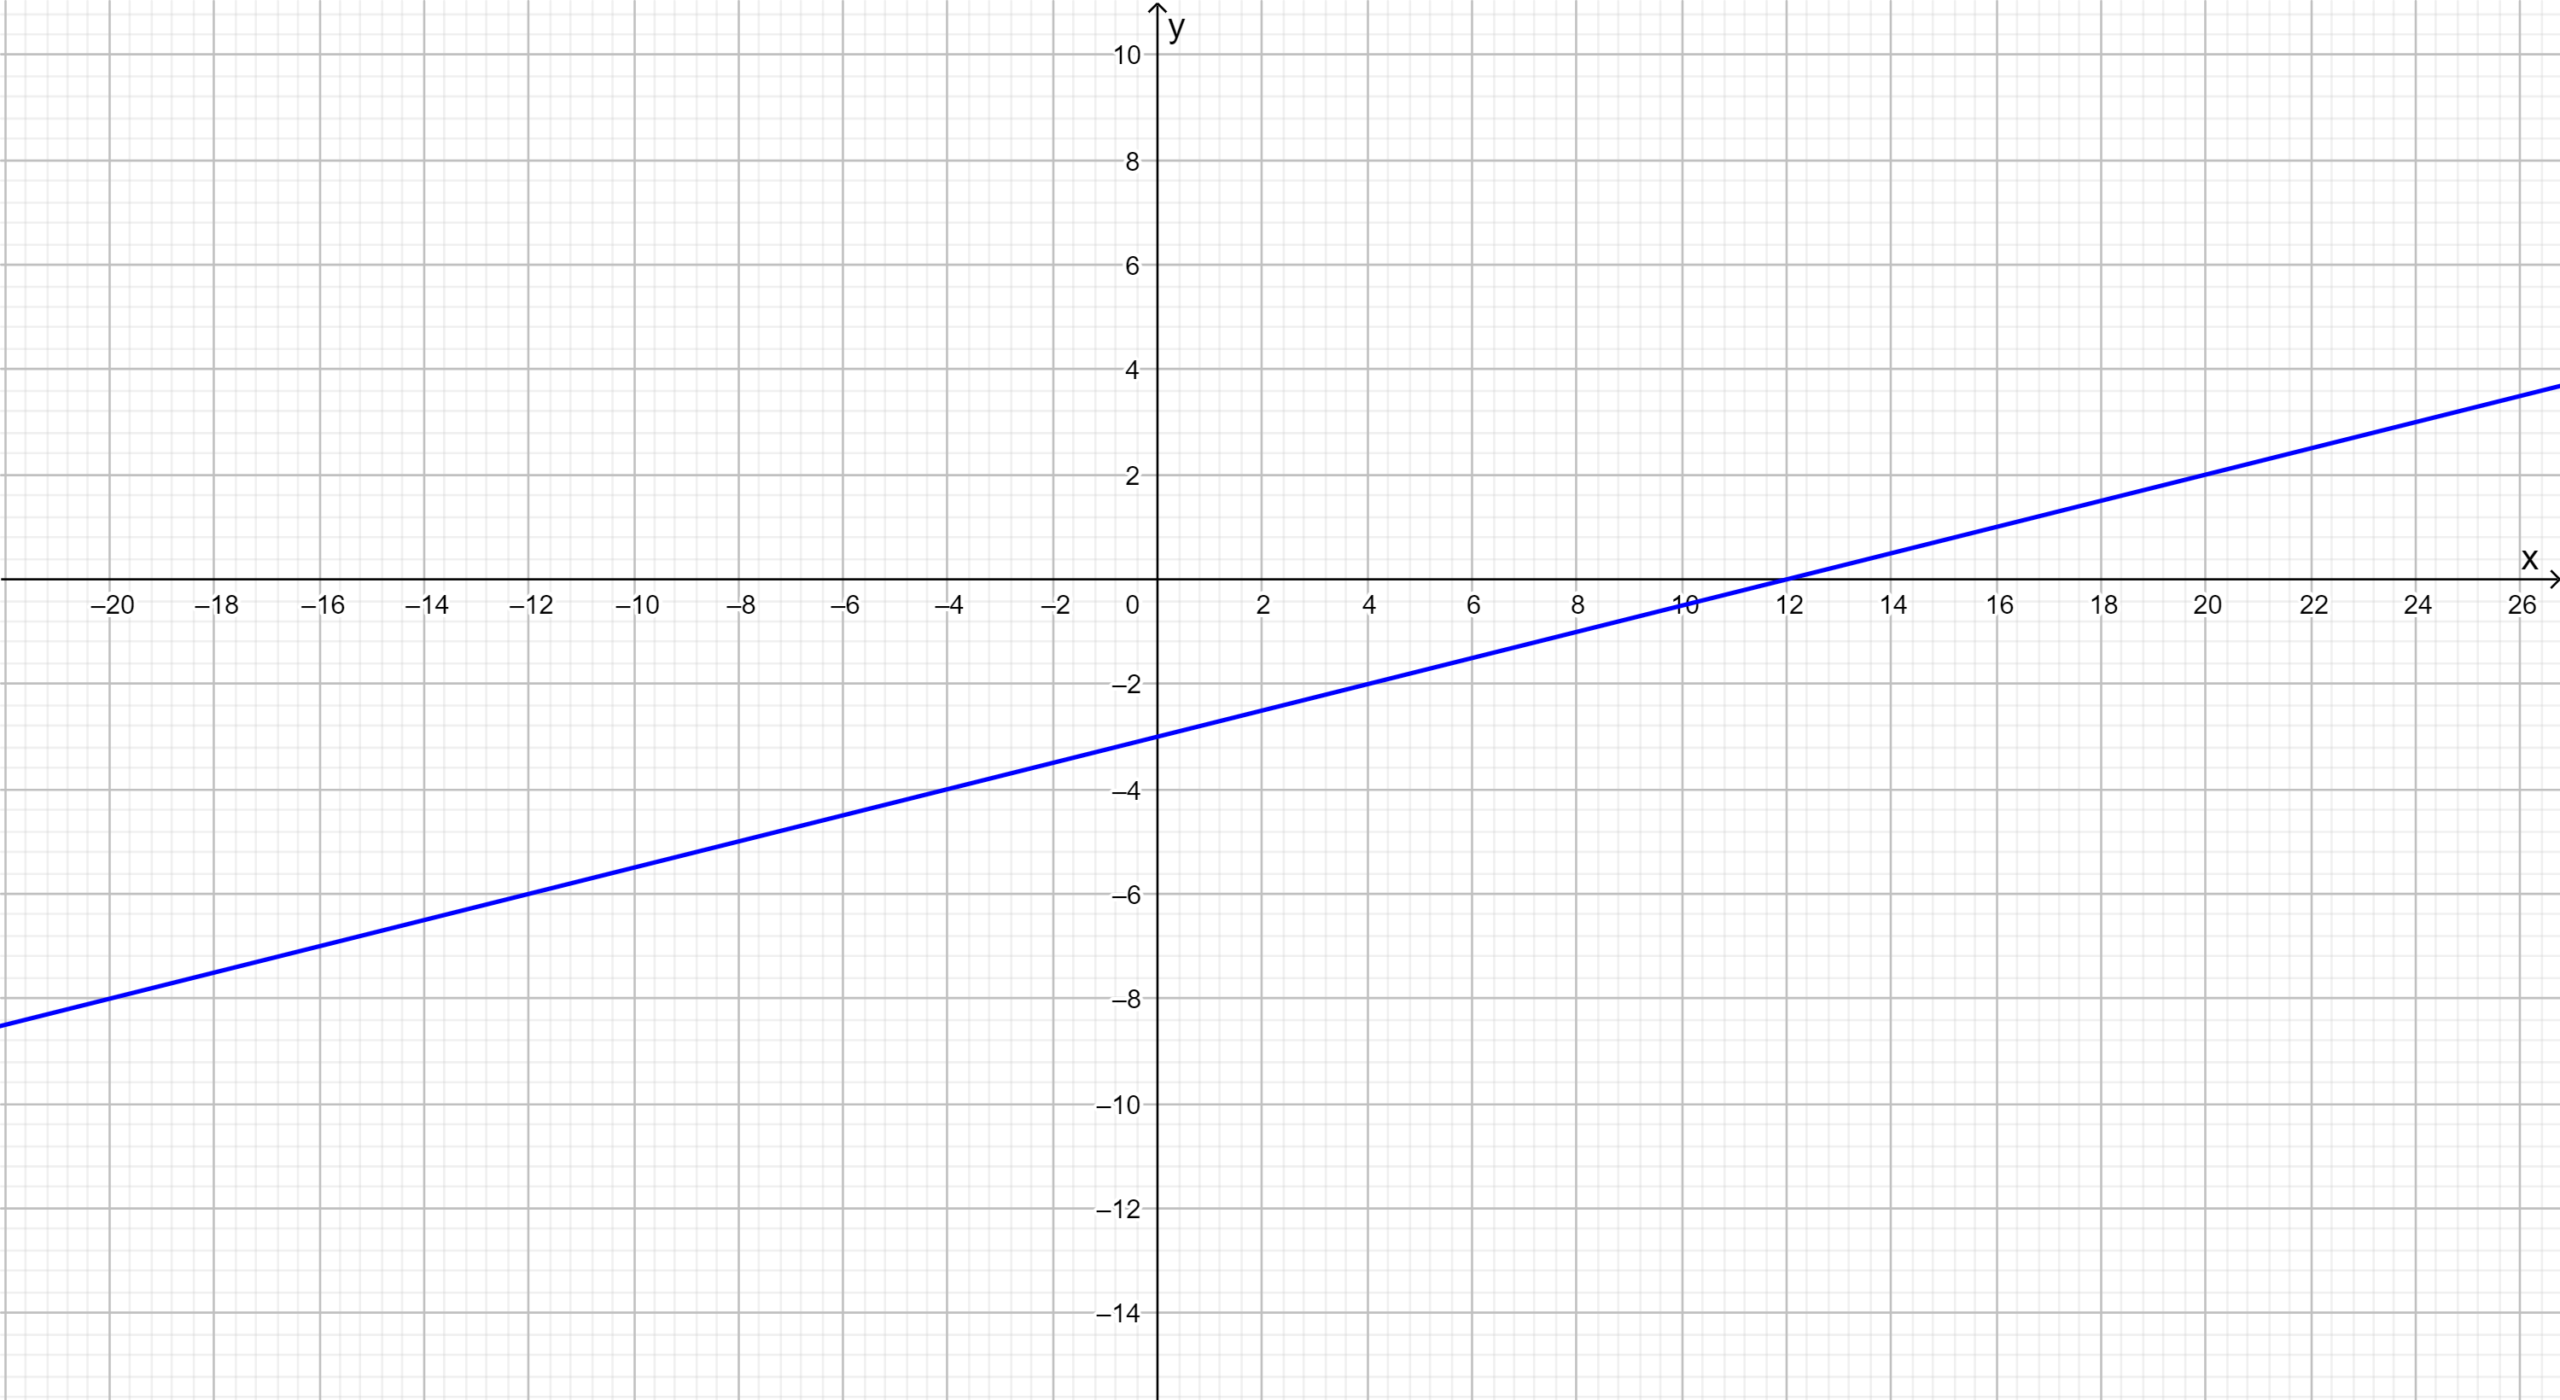
Graph of the equation y\(=\frac{1}{4} x-3\) after entering the equation y\(=\frac{1}{4} x-3\) inside the calculator is

Given: The Inequality y \(\geq \frac{1}{4} x-3\)
We asked to graph y \(\geq \frac{1}{4} x-3\).
Using a graphing calculator also to check the same by considering a point inside the region.
To solve the above we enter the equation y \(=\frac{1}{4} x-3\) inside the calculator then accordingly shade the region.
Enter the equation y=\(\frac{1}{4} x-3\) inside the graphing calculator. After entering the above equation we get the graph of y=\(\frac{1}{4} x-3\) is given by

Since inequality y \(\geq \frac{1}{4} x-3\) has the symbol≥.
Therefore the shaded region is above the graph of y=\(\frac{1}{4} x-3\)
Therefore the graph of y \(\geq \frac{1}{4} x-3\) is
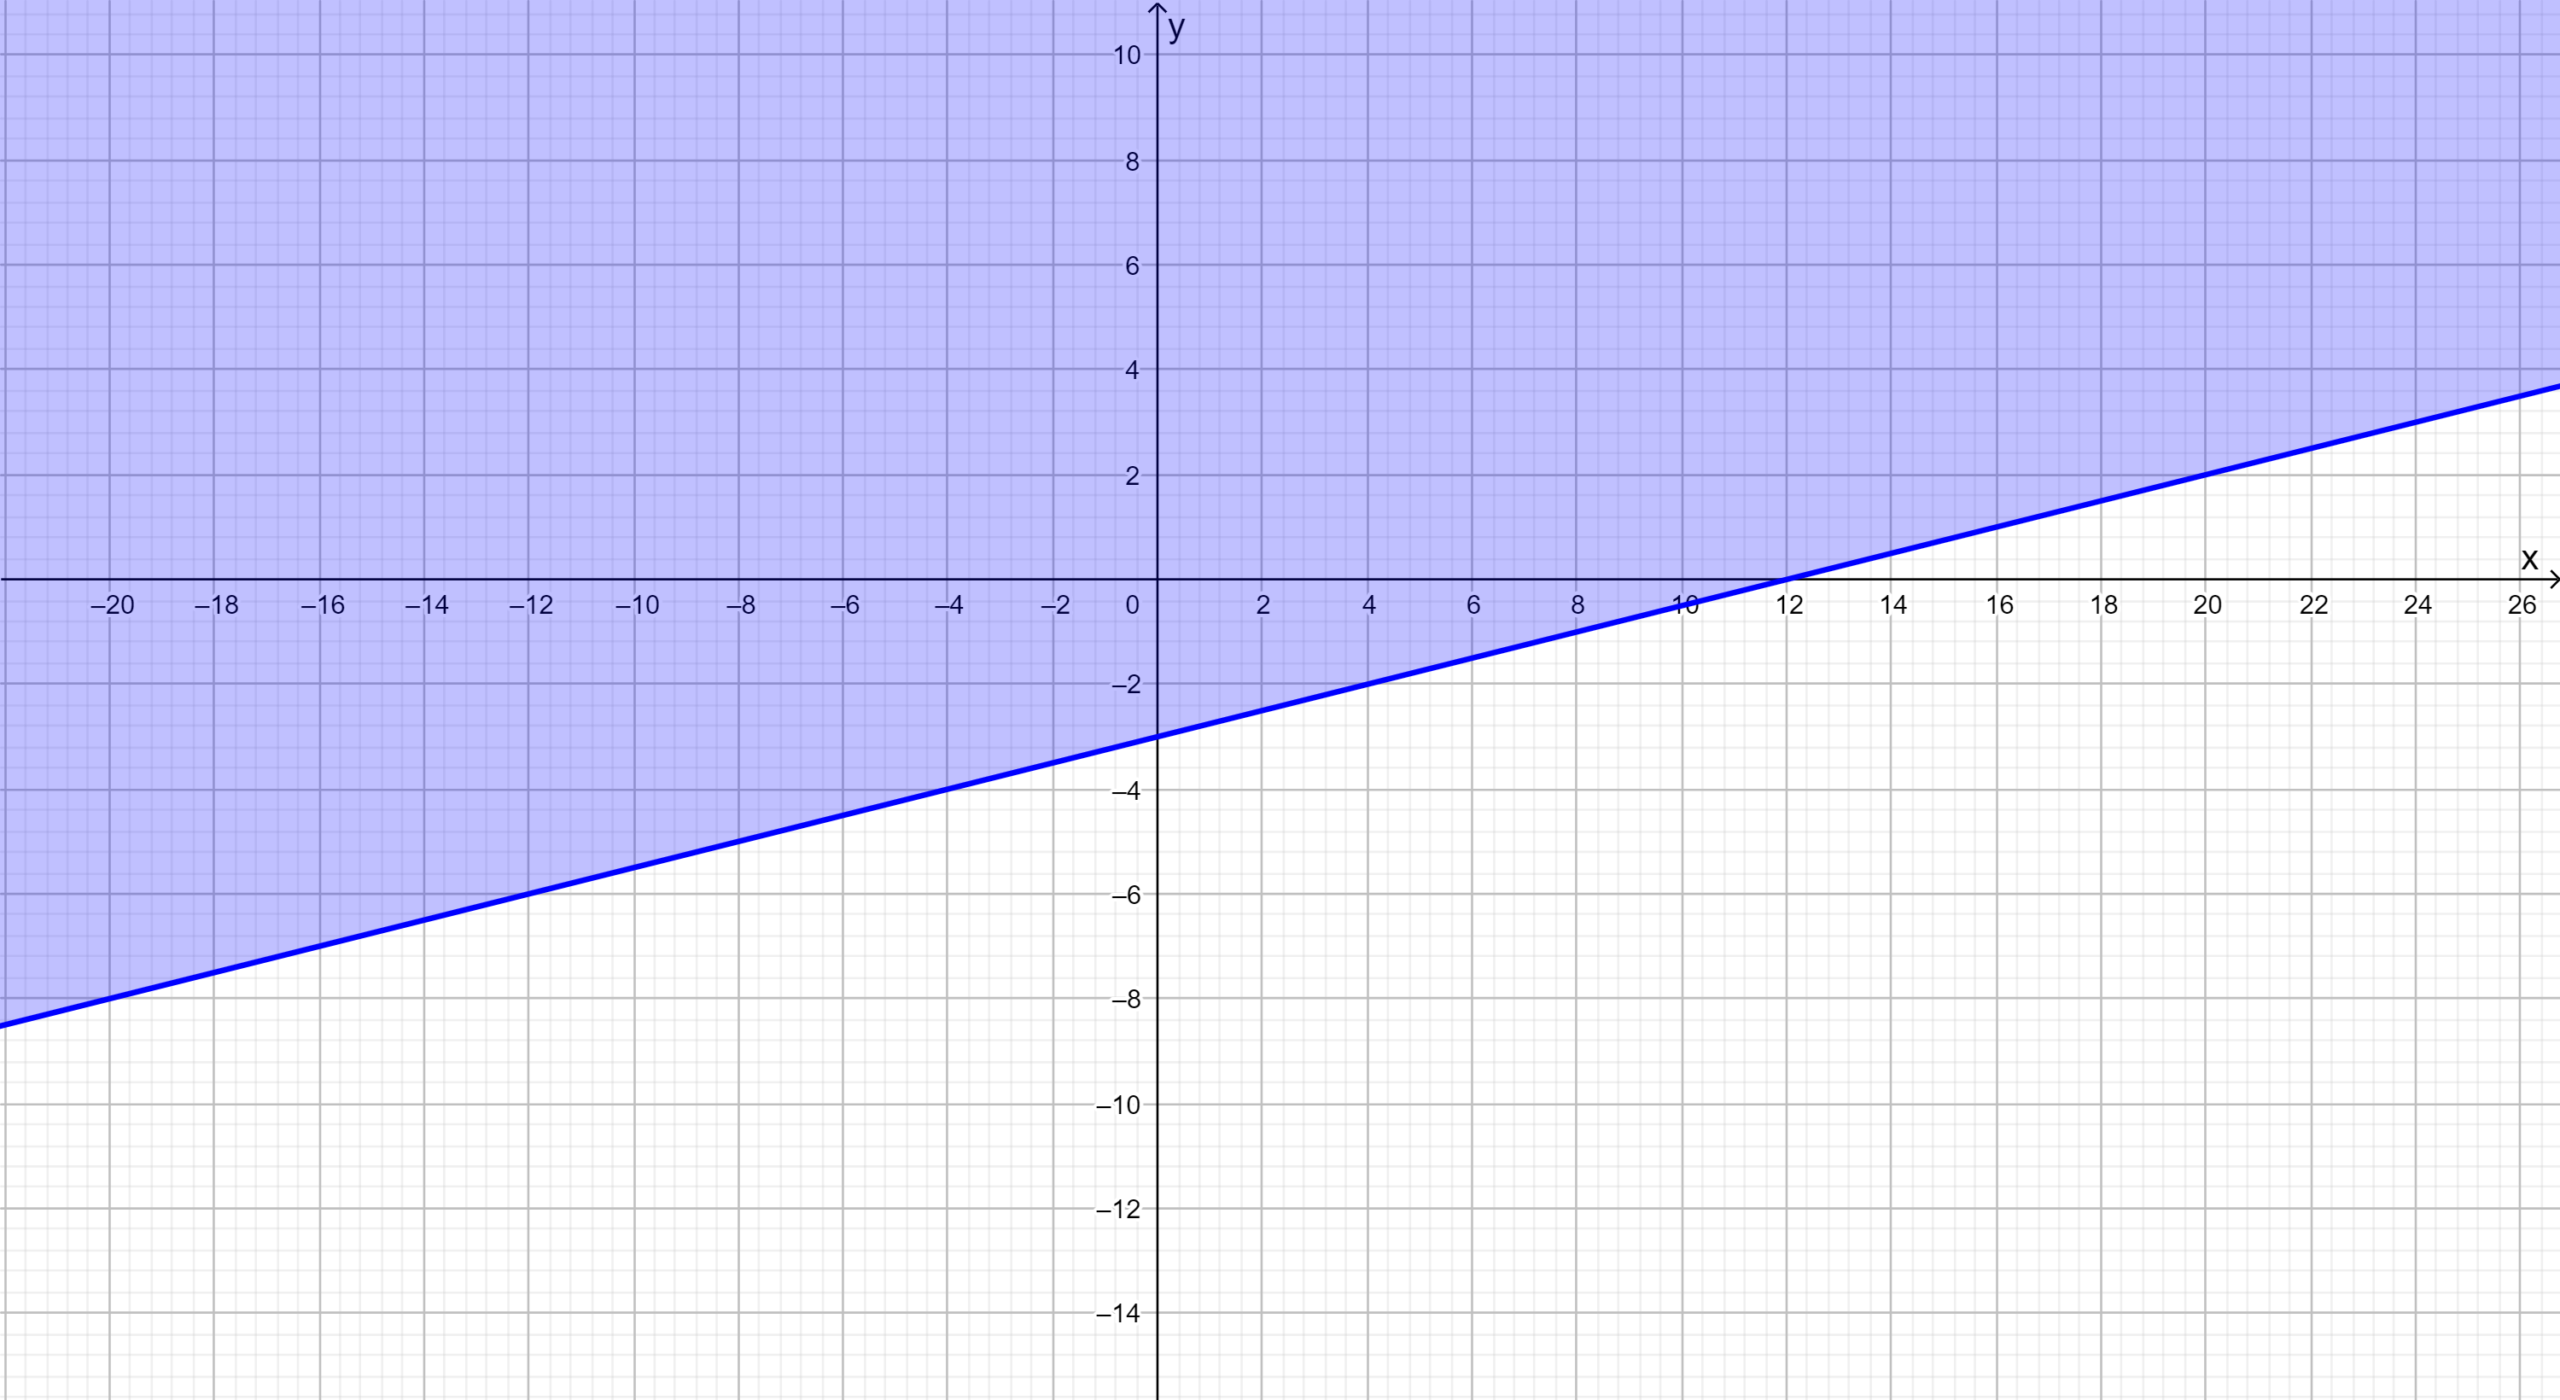
Since y\(\geq \frac{1}{4} x-3\)
Put(0,0) in the above inequality, and we get
⇒ \(\geq \frac{1}{4}(0)-3\)
⇒ 0 ≥ 0−3
⇒ 0 ≥−3
Hence the point(0,0) lies in the region y \(\geq \frac{1}{4}(0)-3\)
Therefore the point(0,0) is the solution of the inequality y\(\geq \frac{1}{4}(0)-3\)
1. Graph of y\(\geq \frac{1}{4}(0)-3\) by using a graphing calculator is

2. The inequality y\(\geq \frac{1}{4}(0)-3\) is true for(0,0).
Solving Systems Of Equations Exercise 5.6 Answers
Page 158 Exercise 3 Answer
Given: The Inequality y > x + 5.
We asked to graph the above inequality, and also to check the same using graphing calculator.
To solve the above we graph the equation y = x + 5 then accordingly shade the region.
Since the inequality y > x + 5 does not contain the equal to(=) sign.
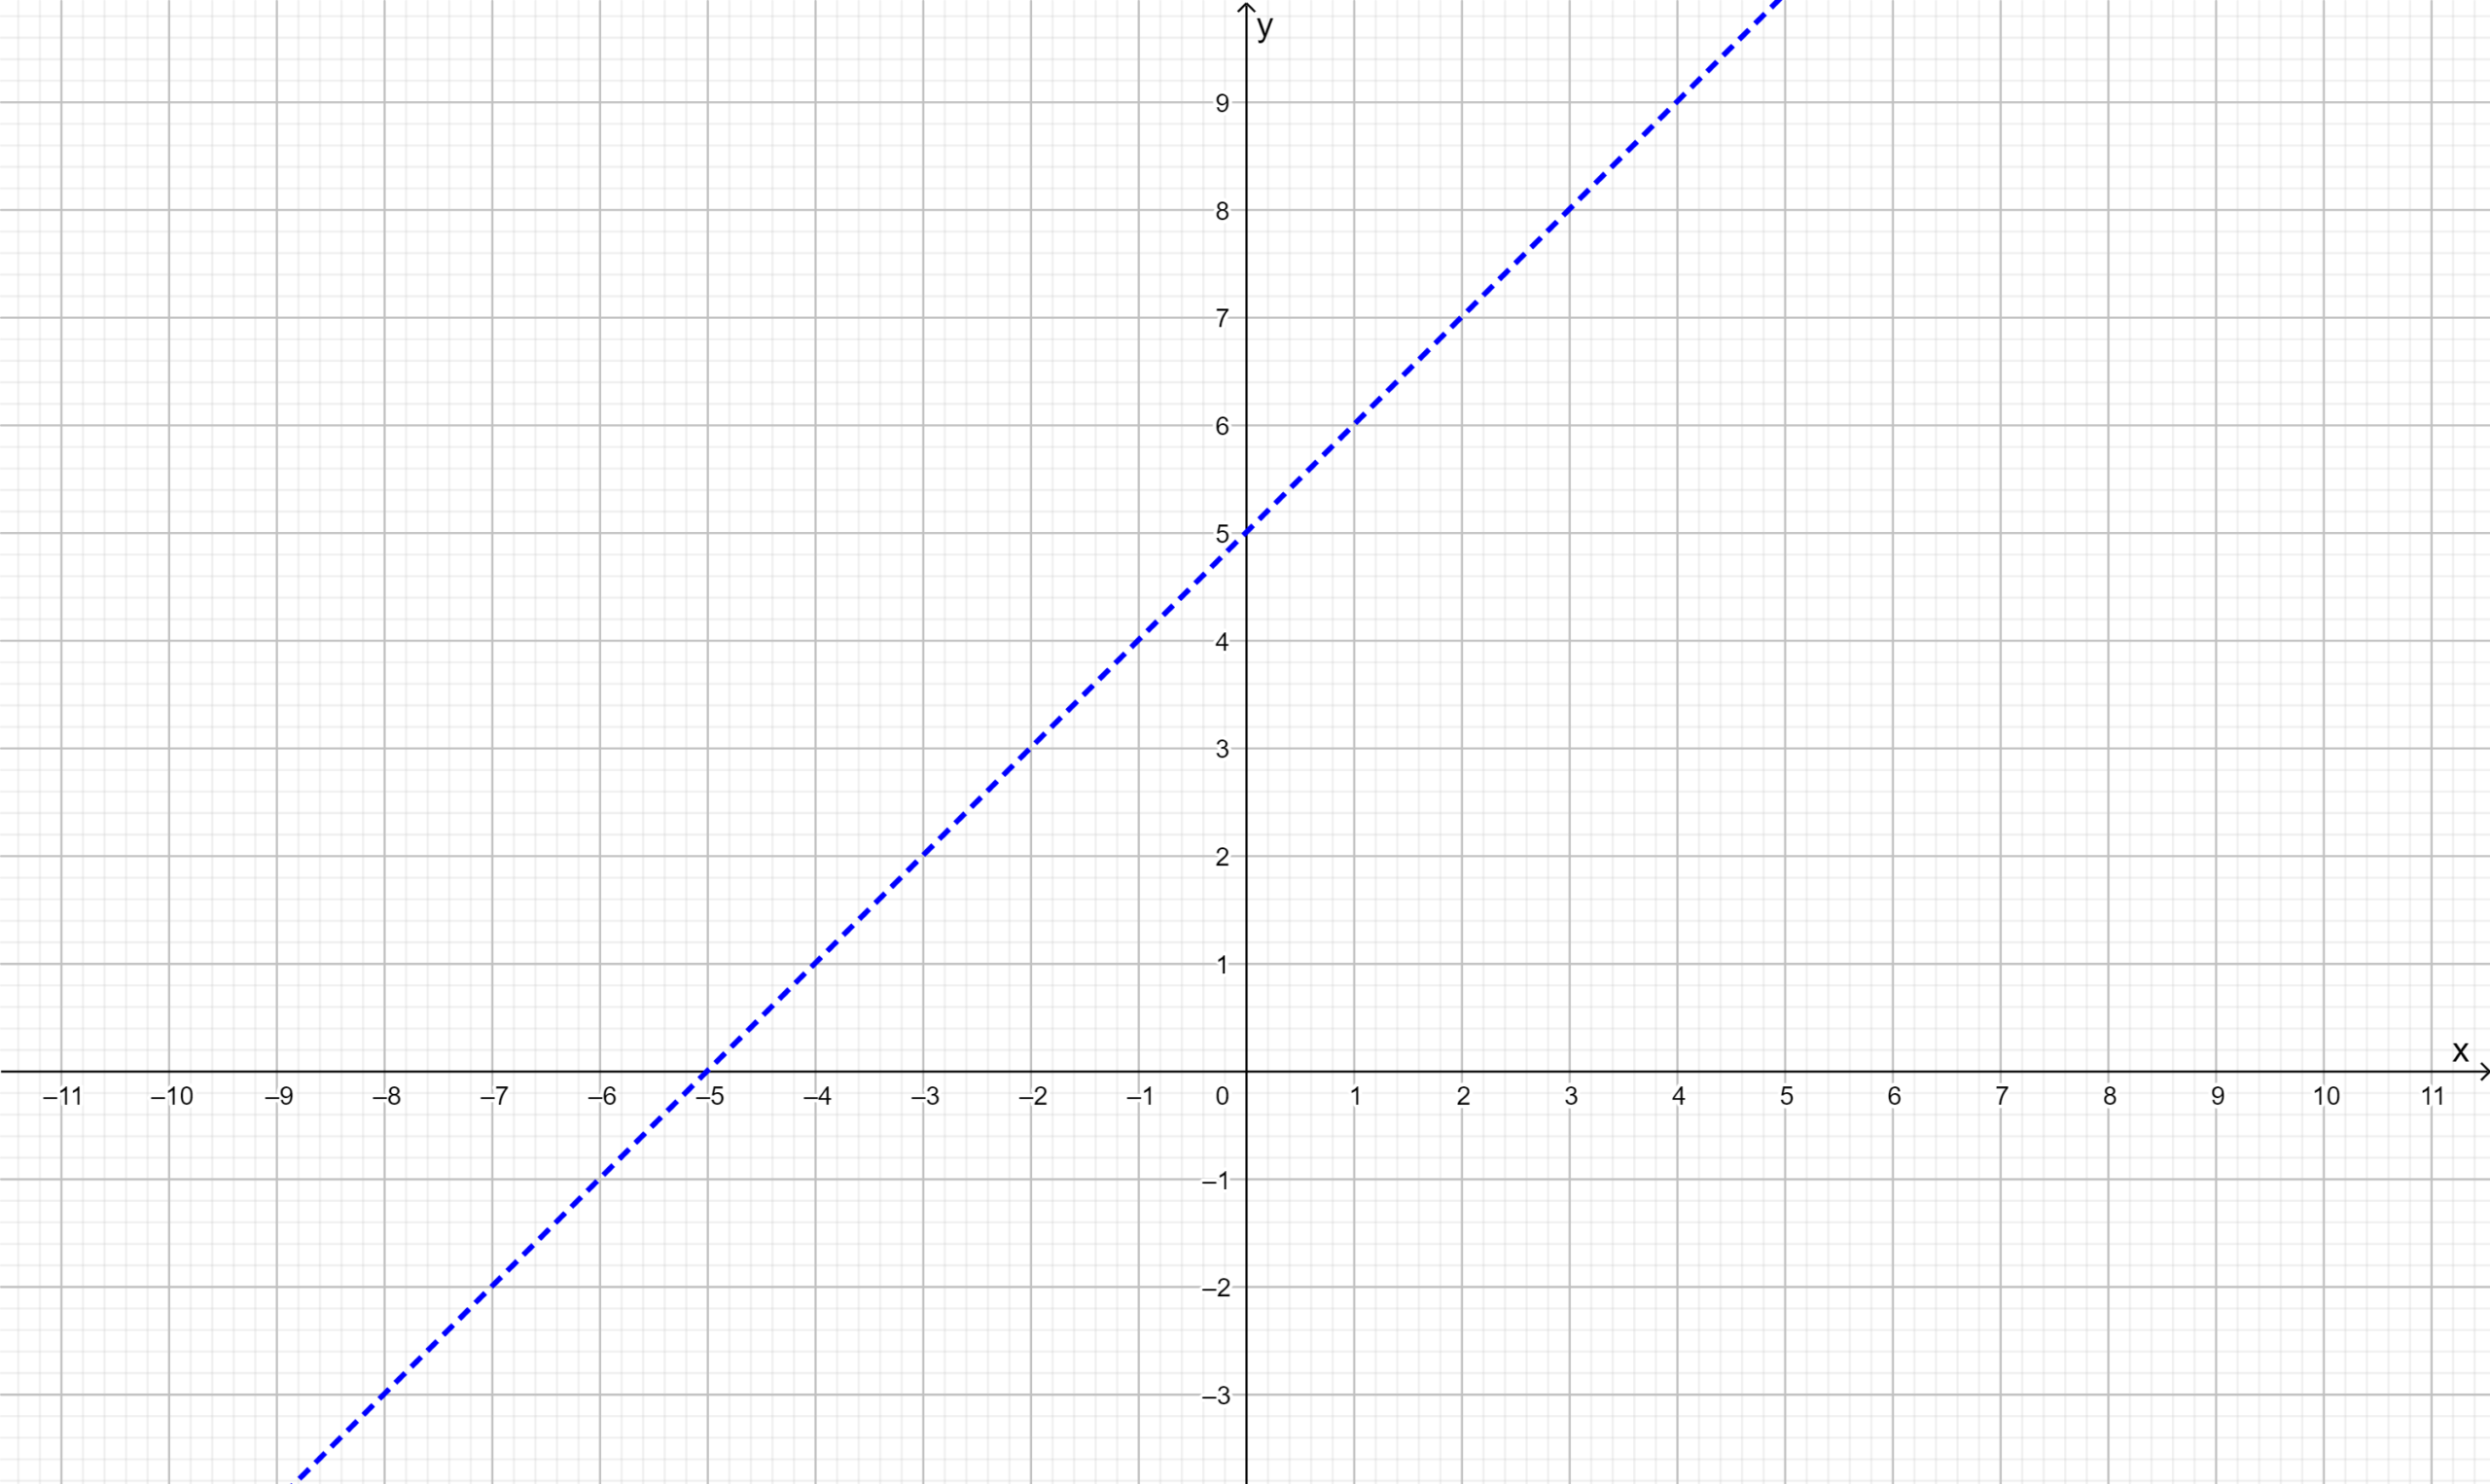
Therefore we graph the equation y = x + 5 with a dashed line.
Therefore The graph of the equation y = x + 5 is given by
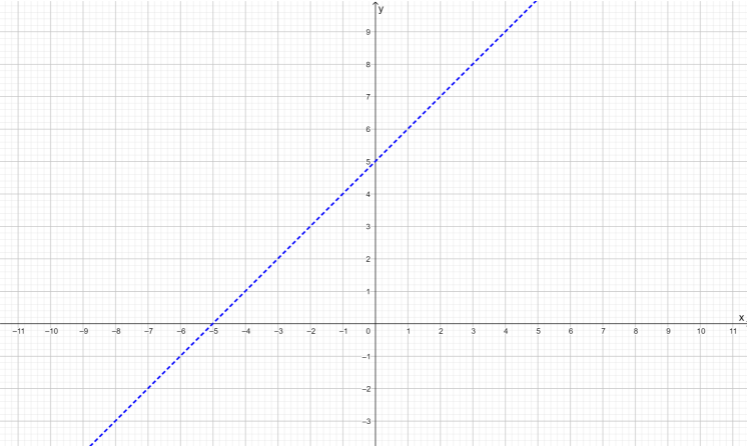
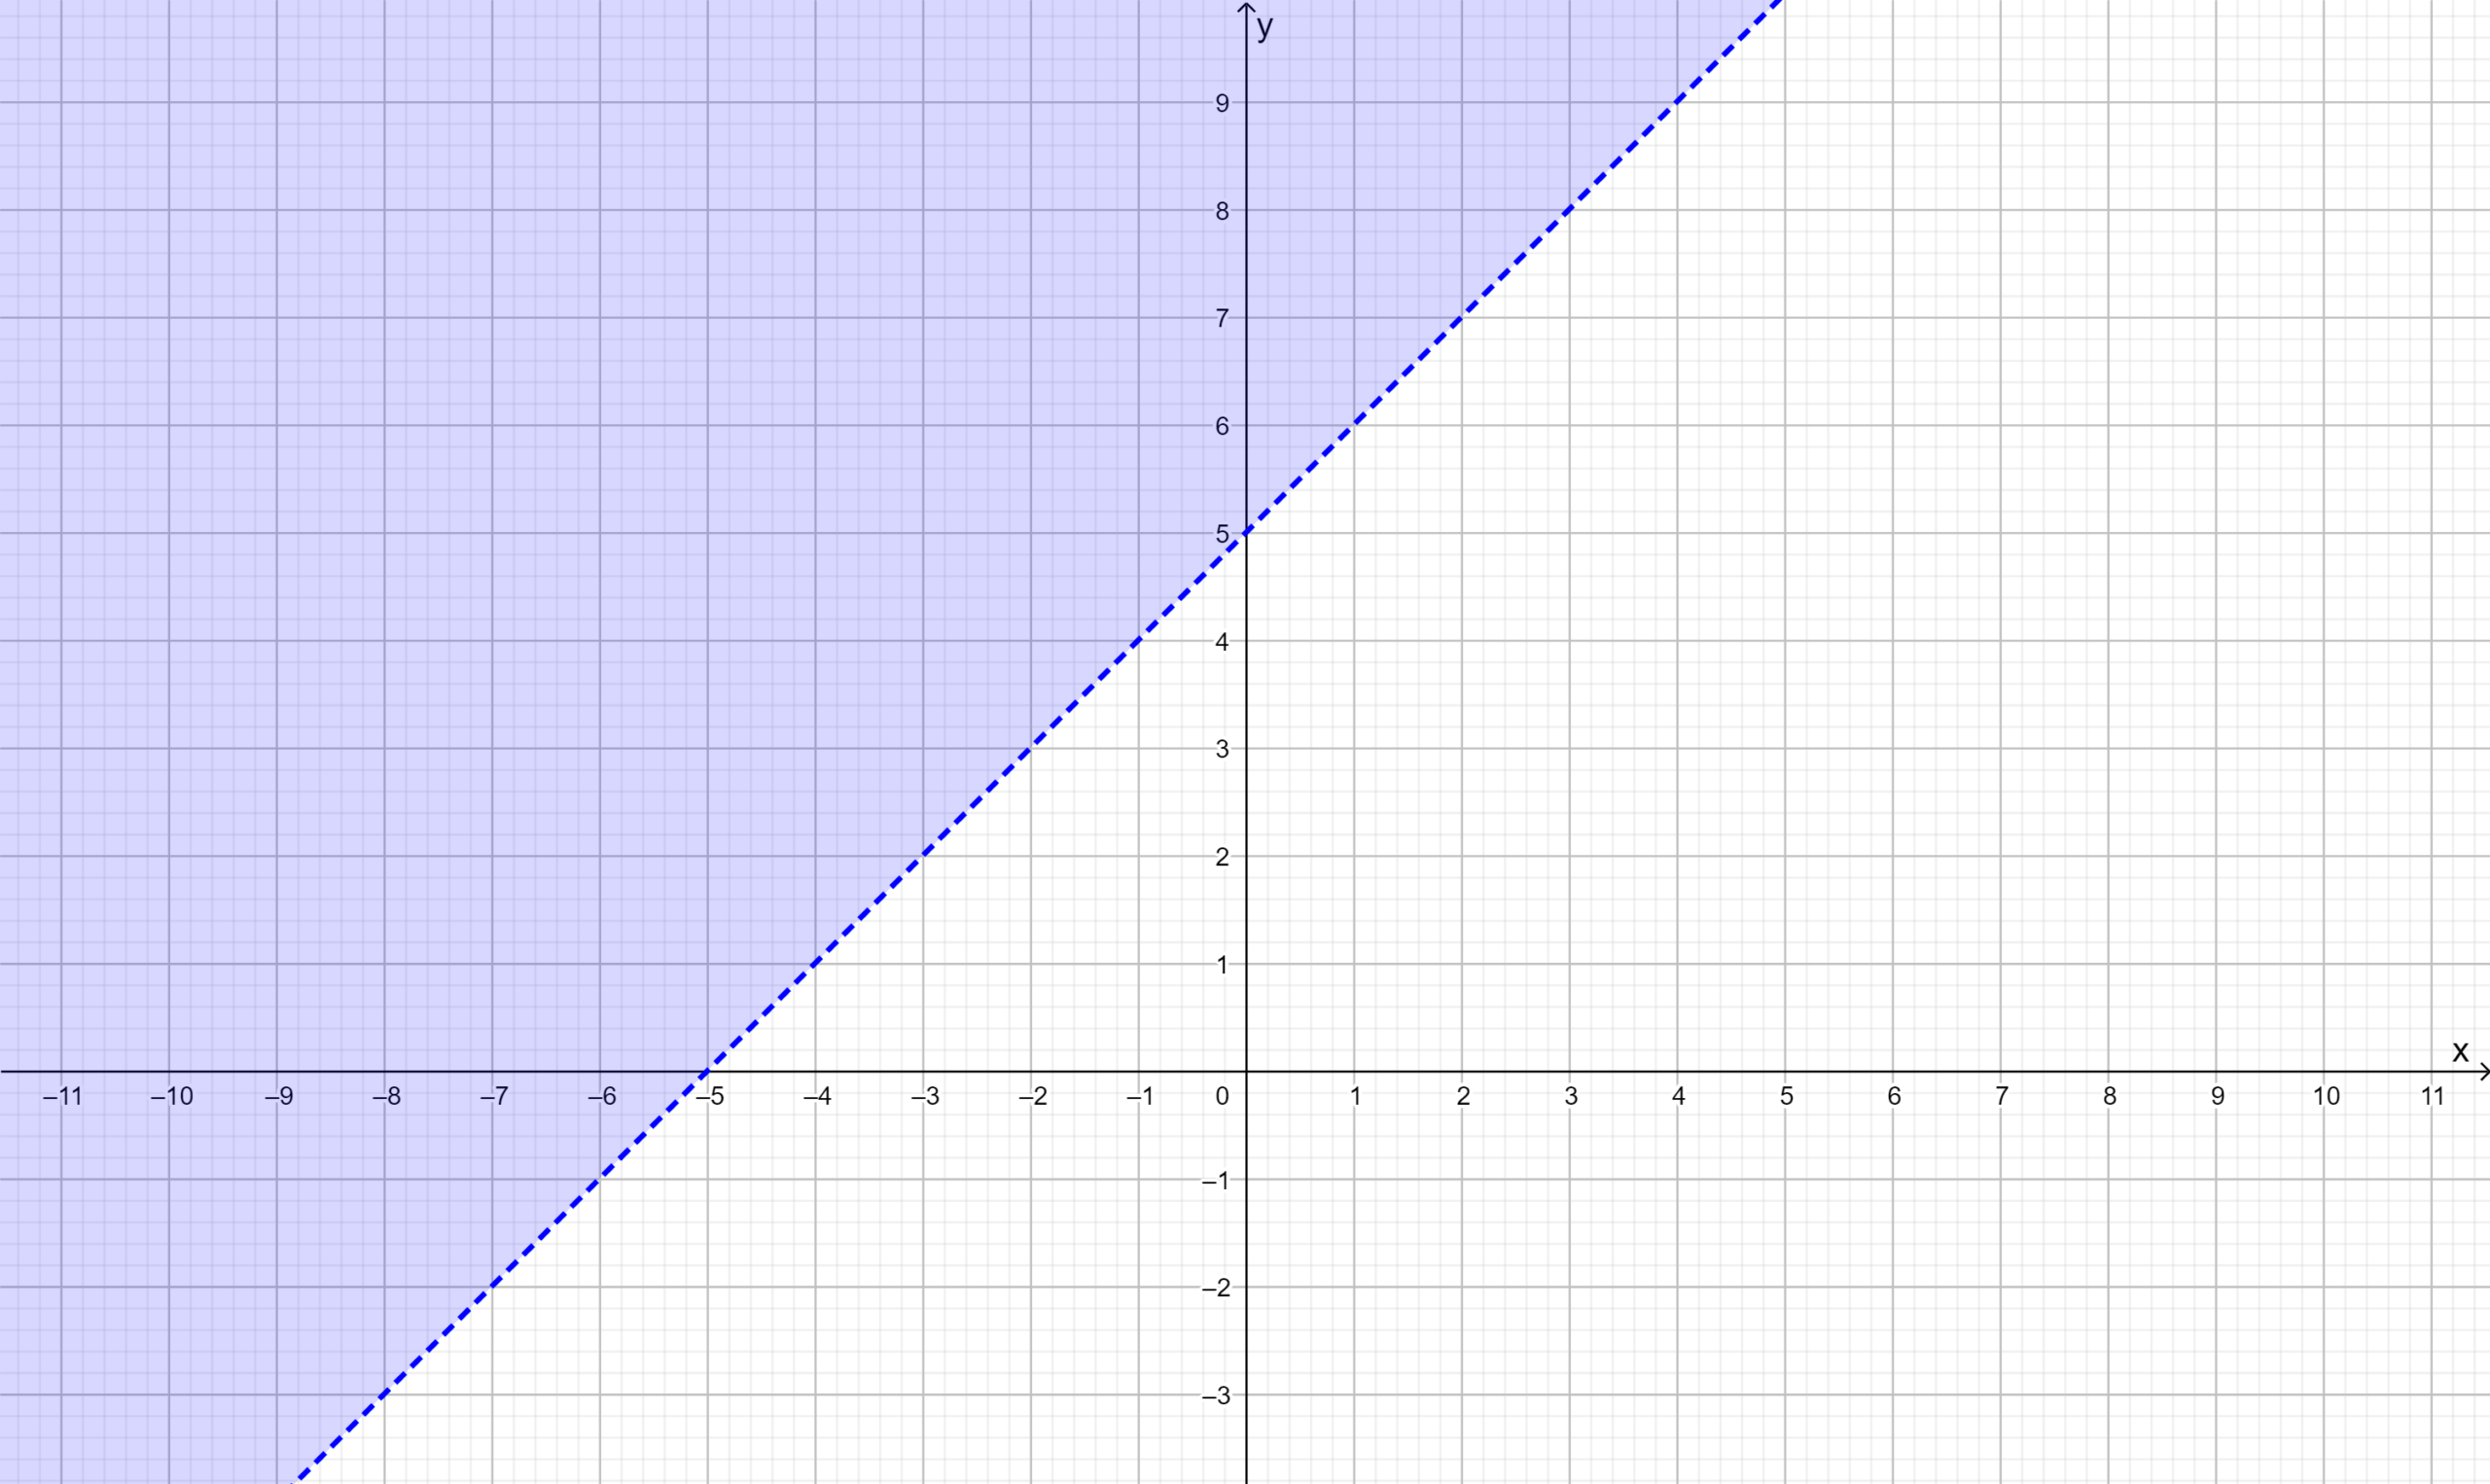
Since the inequality y>x+5 contains the strictly less then (>) sign.
Therefore the shaded region will be above the line y =x + 5 that does not contain the line.
Therefore the graph of the inequality y > x + 5 is given by
Since y > x + 5.
Put x = −1 and y = 1 in the above inequality, and we get
⇒ 1 >−1 + 5
⇒ 1 > 4
Hence(−1,1) does not satisfy the inequality y > x + 5.
Therefore(−1,1) is not a solution to the inequality y > x + 5.
1. Graph of y> x+5 is
2.Graph of y>x+5 using a graphing calculator is

3. (-1,1) is not a solution to the Inequality y > x+5
Given: The Inequality y≤\(\frac{-1}{2} x+1\)
We asked to graph the above inequality, and also to check the same using graphing calculator.
To solve the above we graph the equation y=\(\frac{-1}{2} x+1\) then accordingly shade the region.
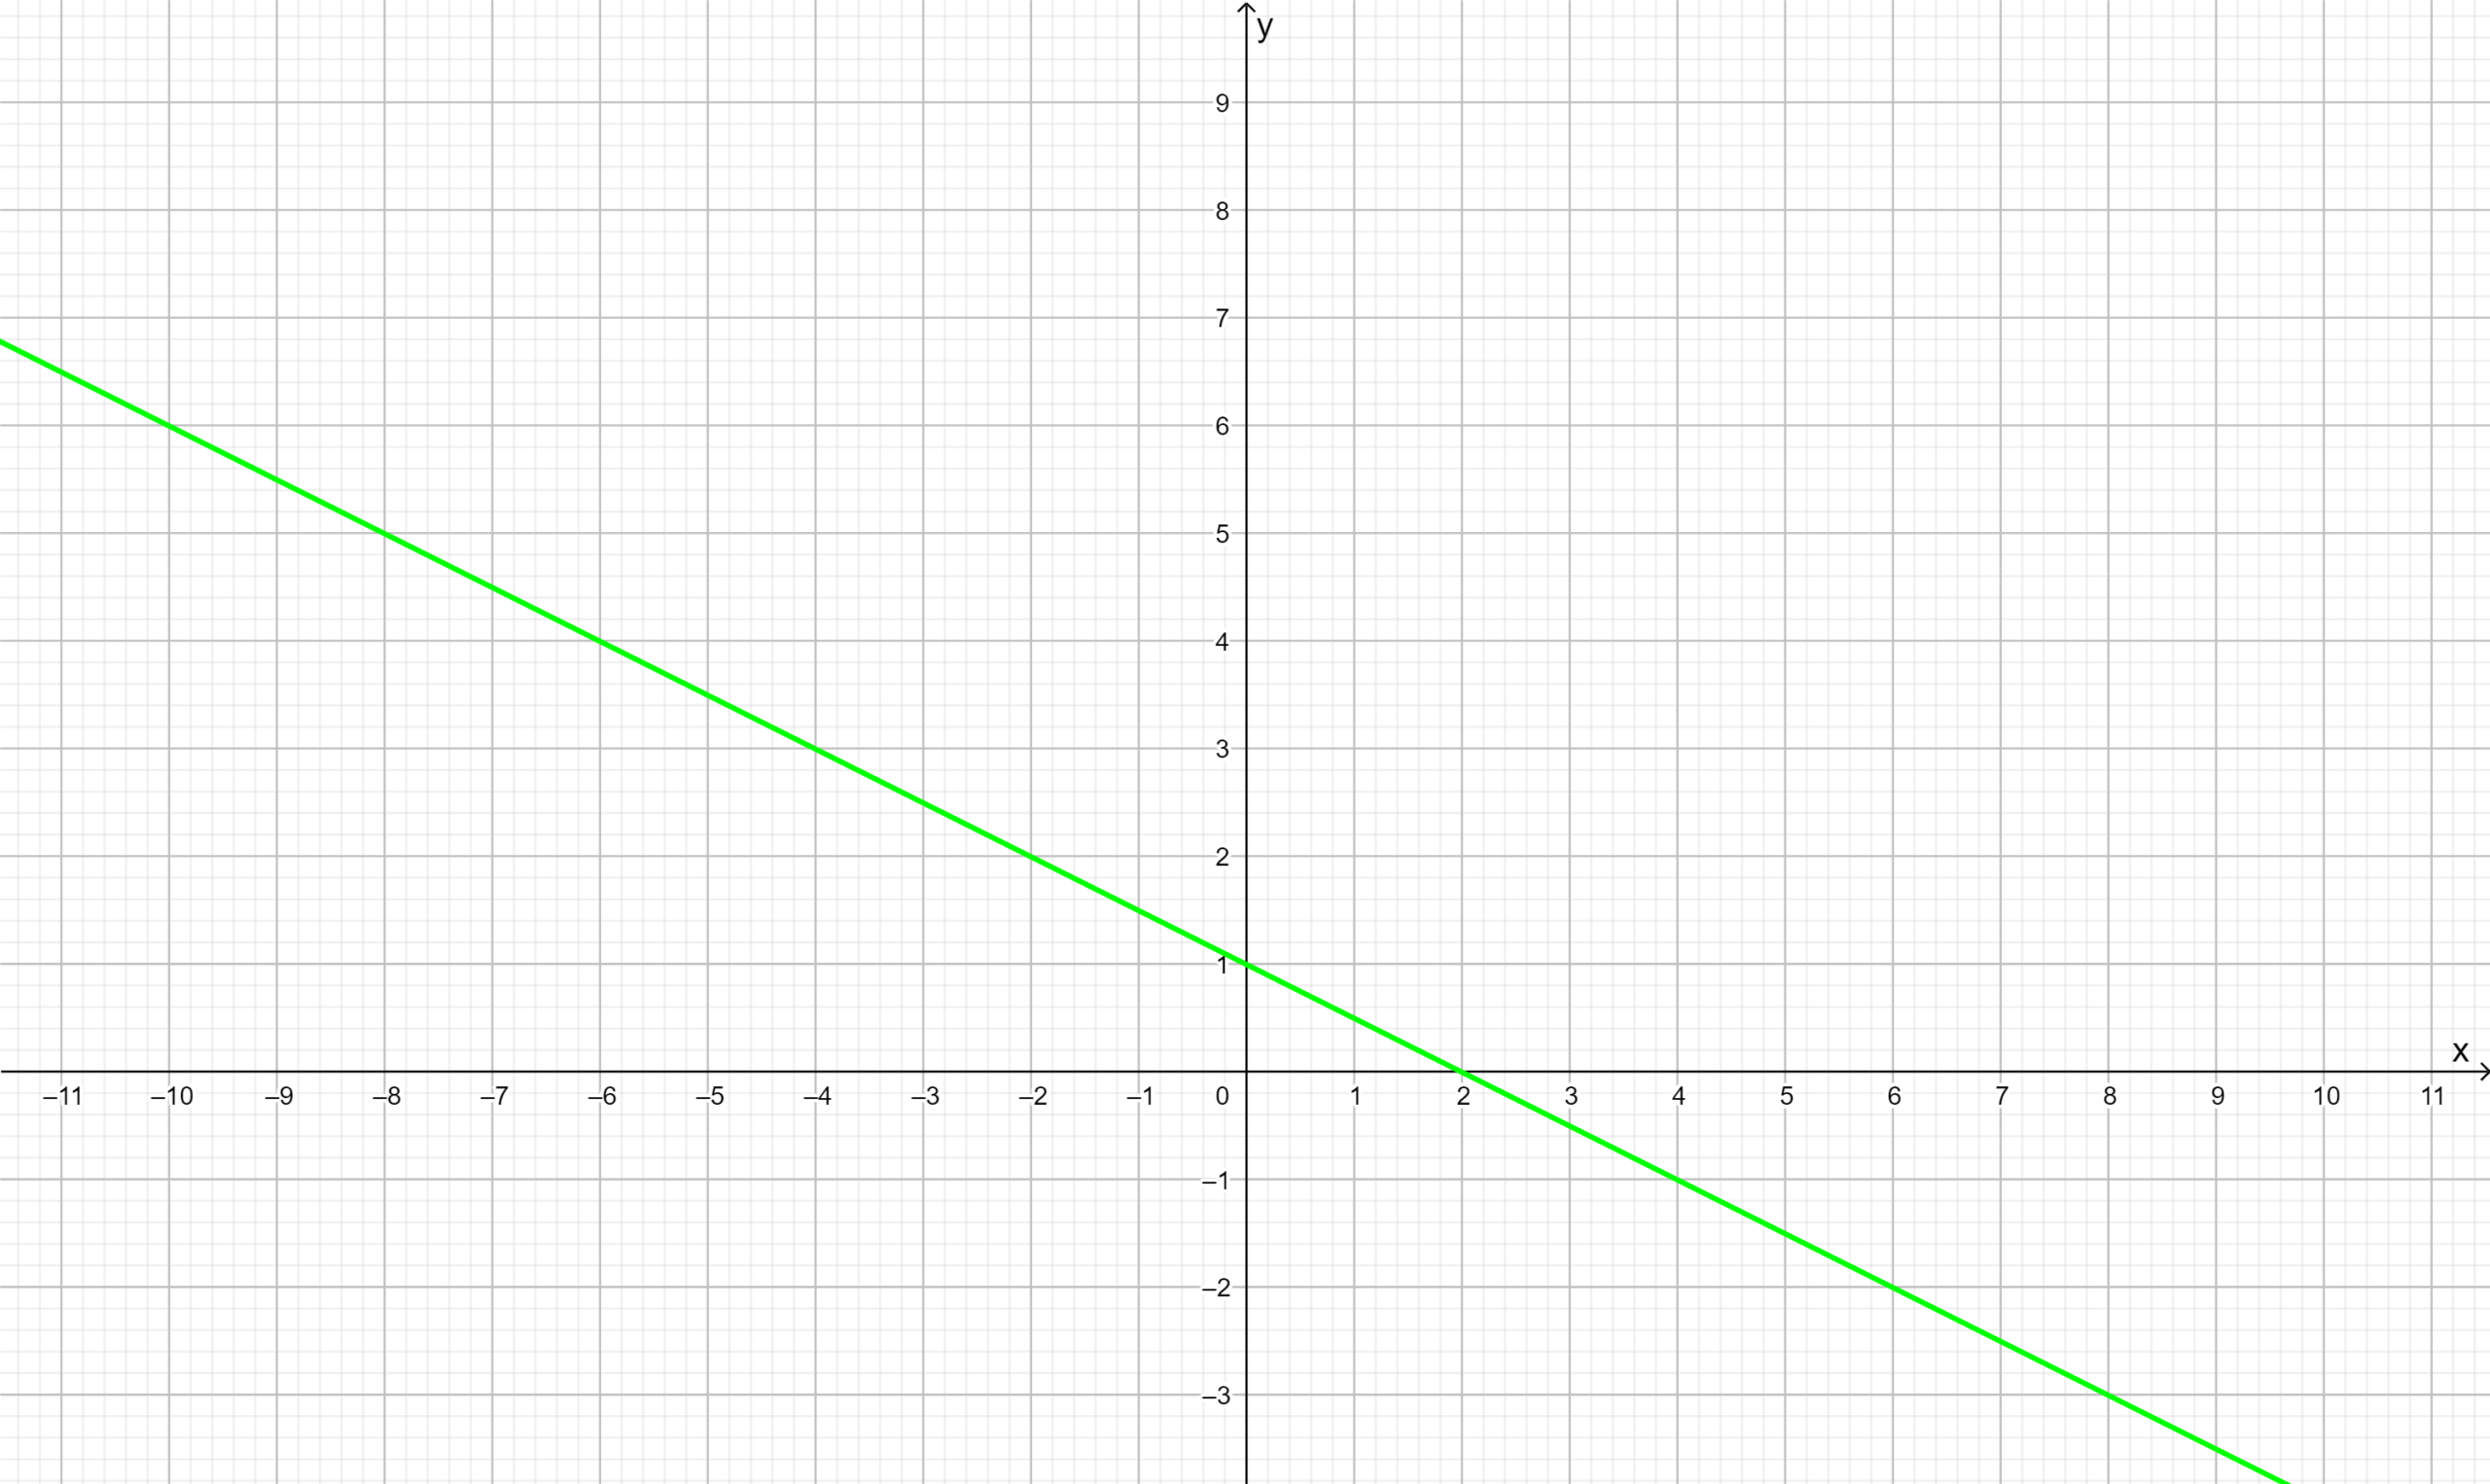
We graph the linear equation y=\(\frac{-1}{2} x+1\)
with the continuous line, since the inequality contains the equal to(=) sign.
Therefore the graph of y=\(\frac{-1}{2} x+1\) is given by

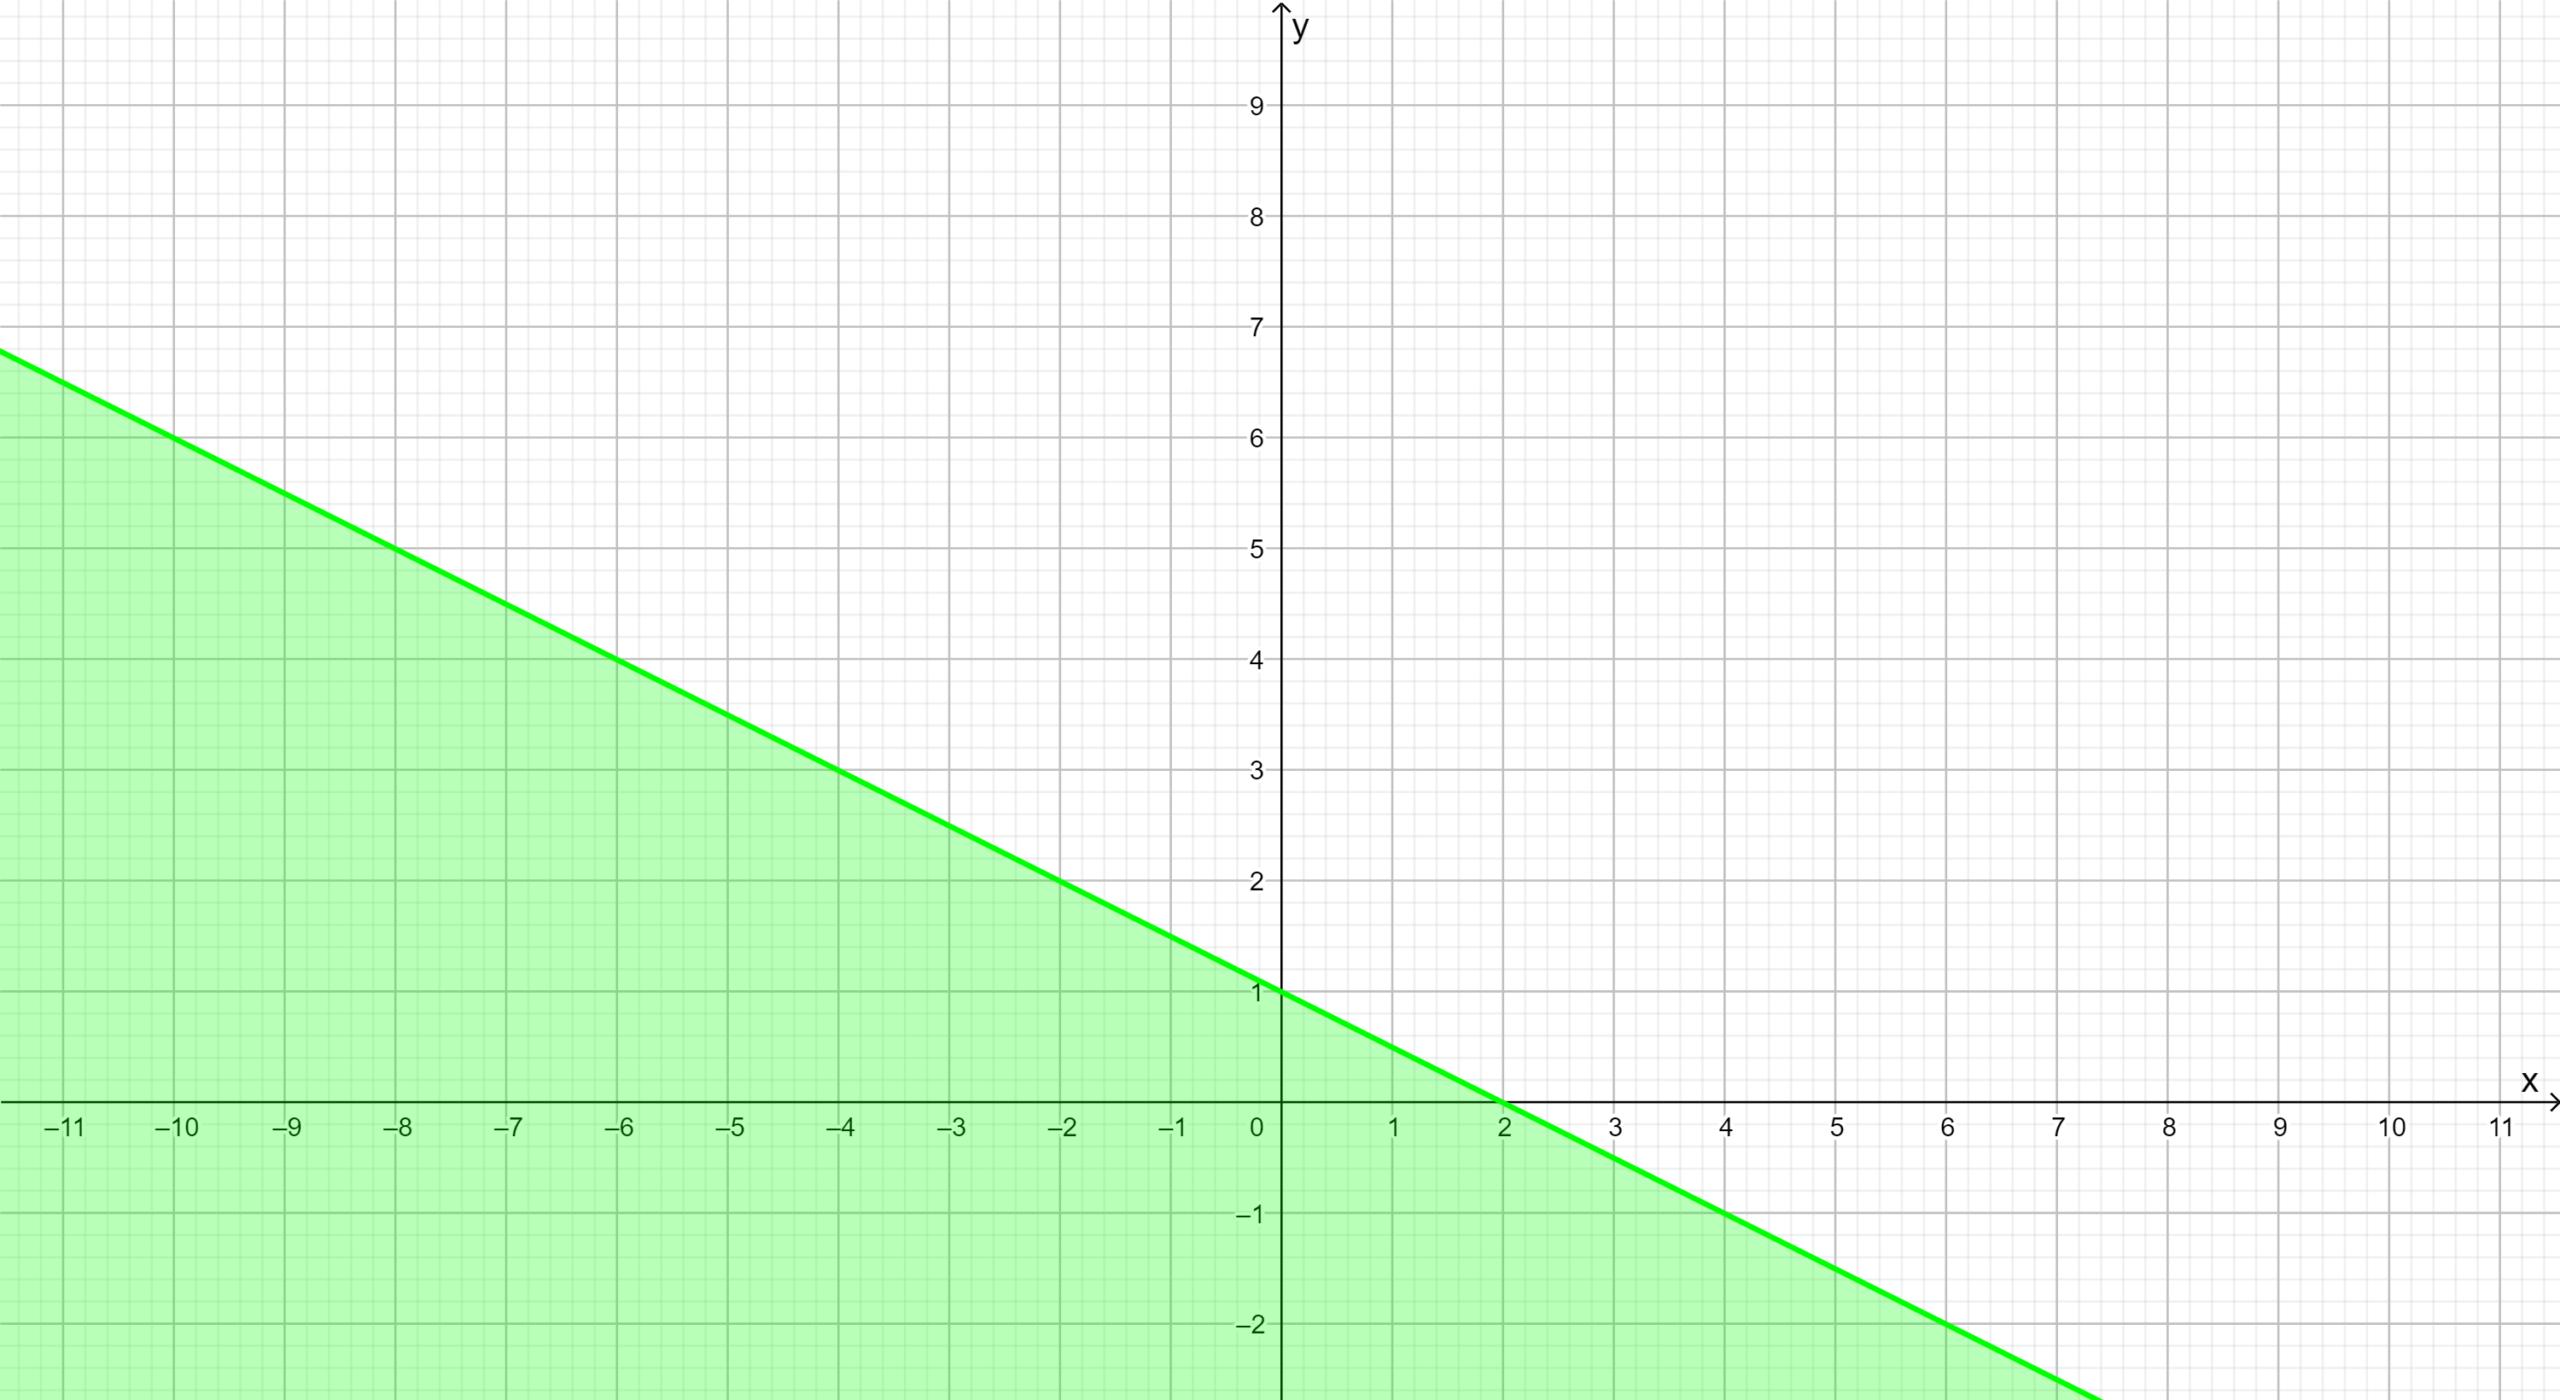
Since the inequality y≤\(\frac{-1}{2} x+1\) contains the sign≤.
Therefore the shaded region will be below the line y=\(\frac{-1}{2} x+1\)
Therefore the graph of y ≤\(\frac{-1}{2} x+1\) is given by

Since y≤ \(\frac{-1}{2} x+1\)
Put x = −1 and y = −1 in the above inequality, and we get
−1≤ \(\frac{-1}{2}(-1)+1\)
⇒ −1≤ \(\frac{-1}{2}+1\)
⇒ −1≤\(\leq \frac{3}{2} \approx 1.5 \)
Hence the point(−1,−1) satisfy the inequality y≤\(\frac{-1}{2} x+1\)
Therefore(−1,−1) is the solution for the inequality y≤\(\frac{-1}{2} x+1\).
1. Graph of y=\(\frac{-1}{2} x+1\) is
2. Graph of y≤\(\frac{-1}{2} x+1\) using a graphing calculator is
3.The inequality y≤\(\frac{-1}{2} x+1\) is true for(−1,−1).
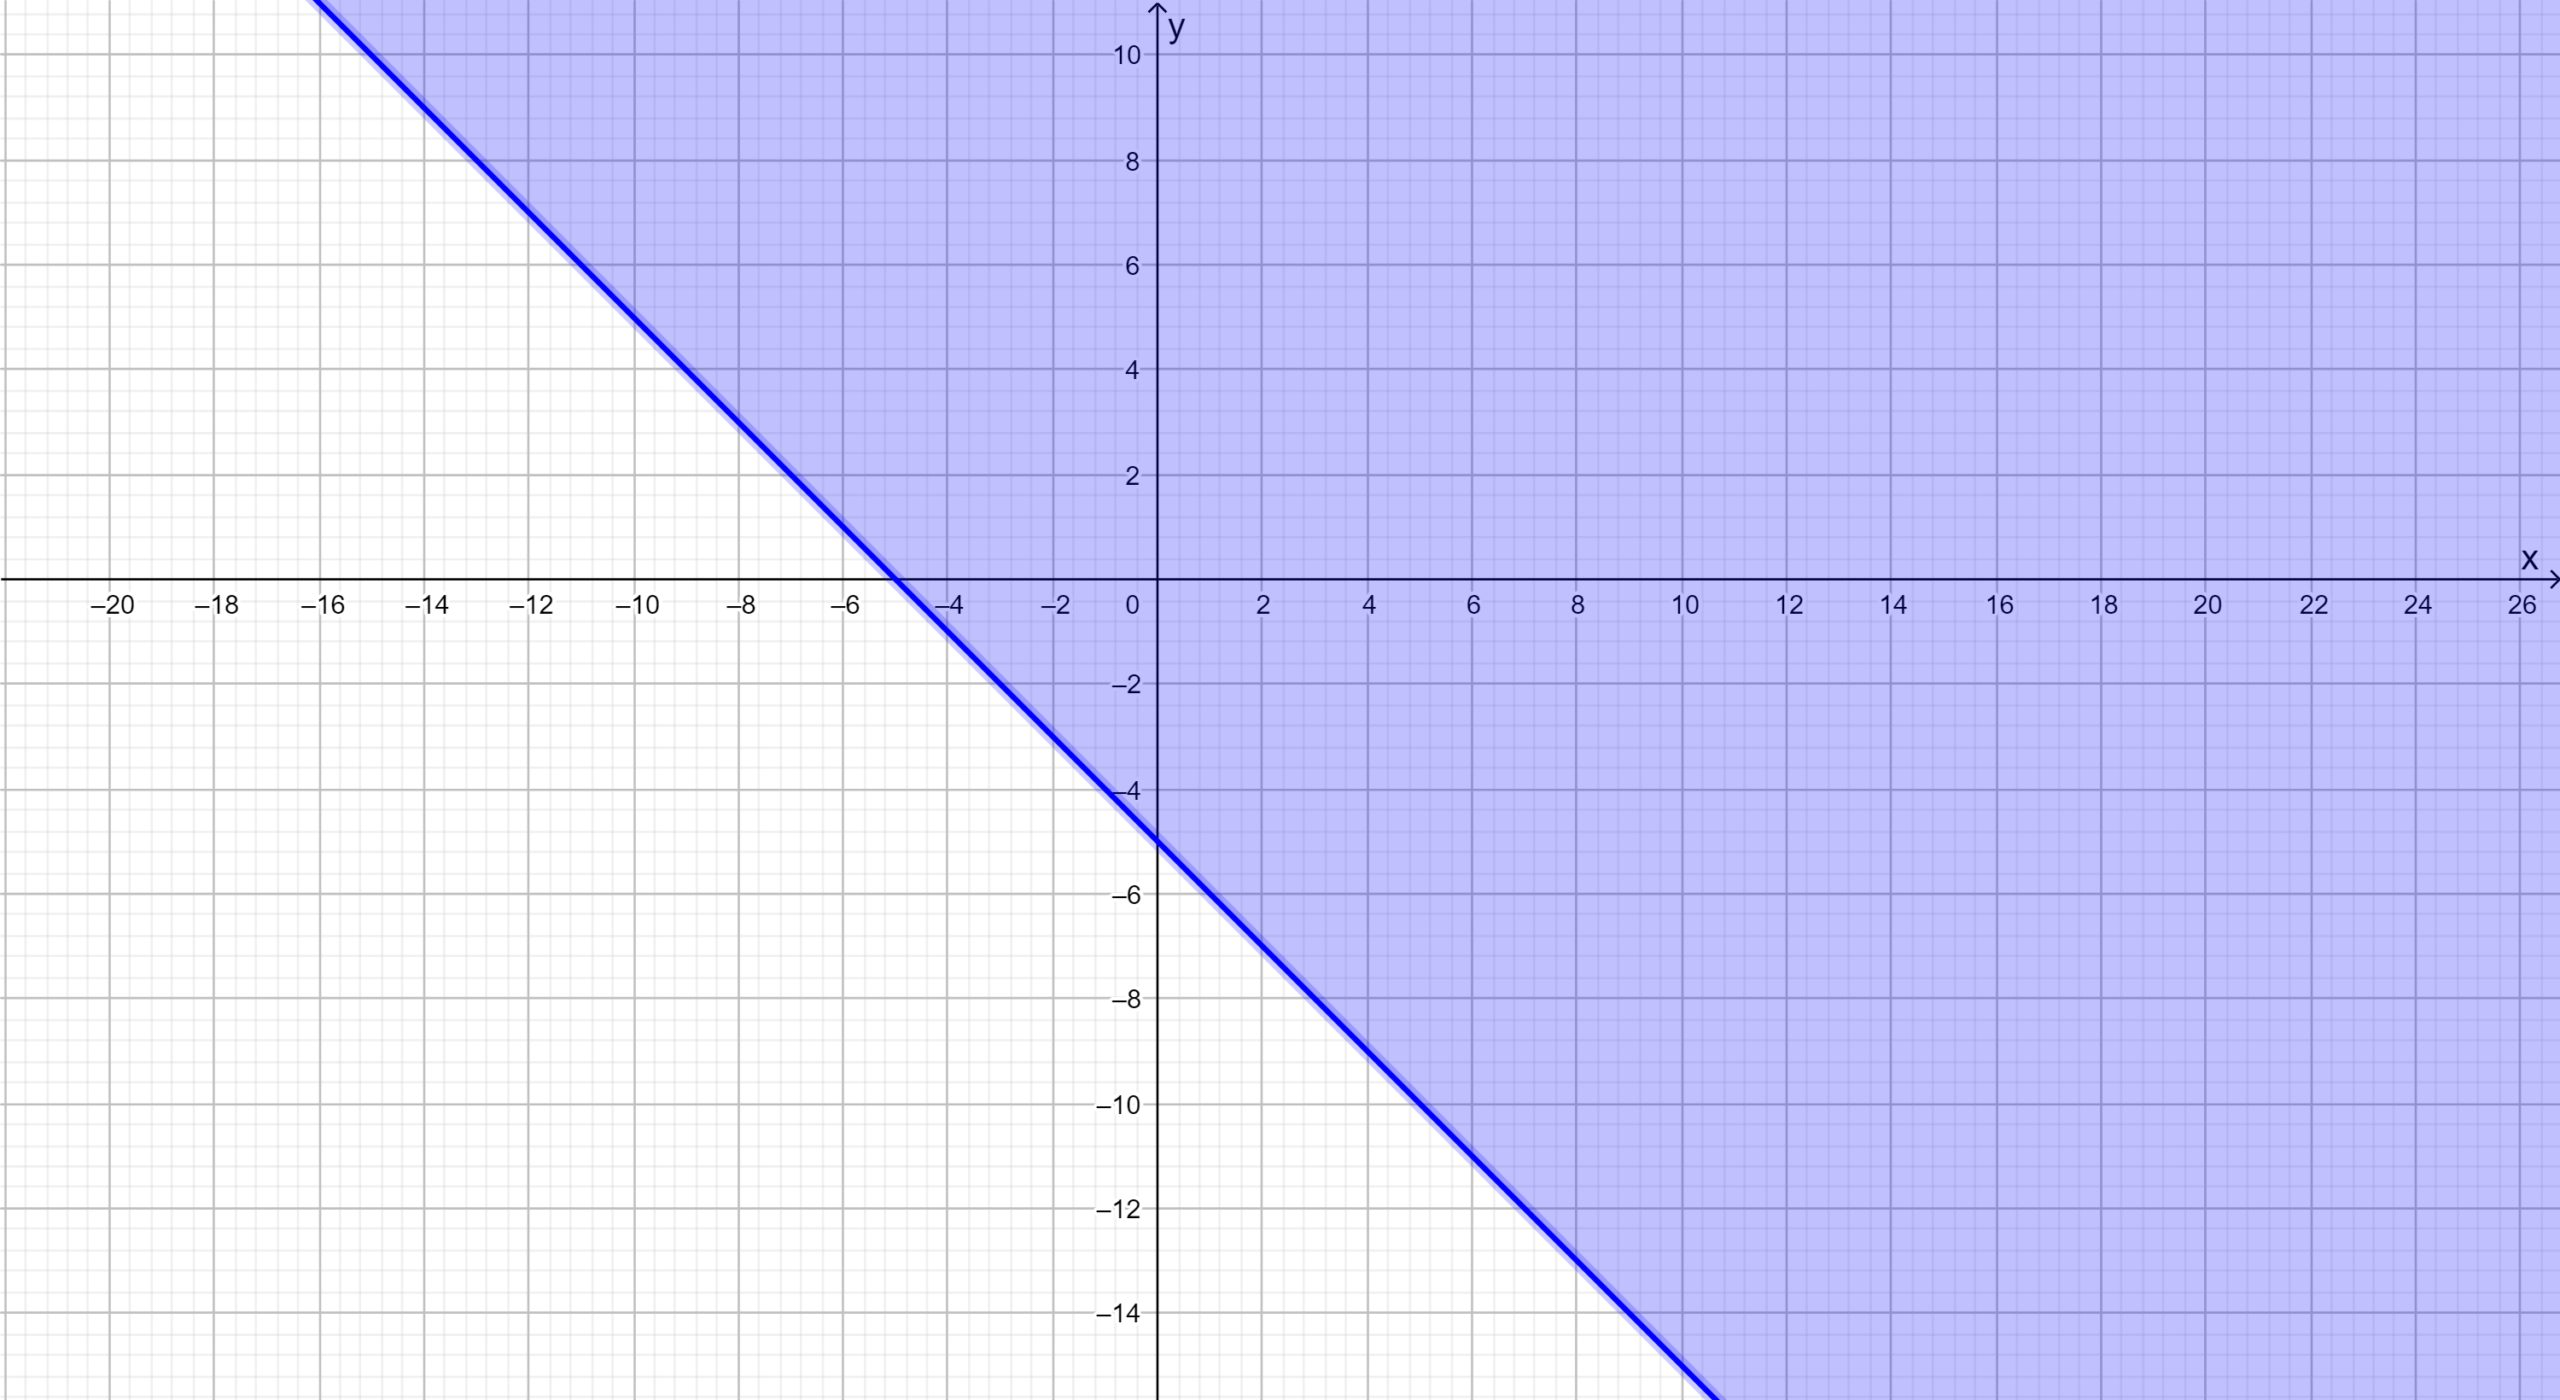
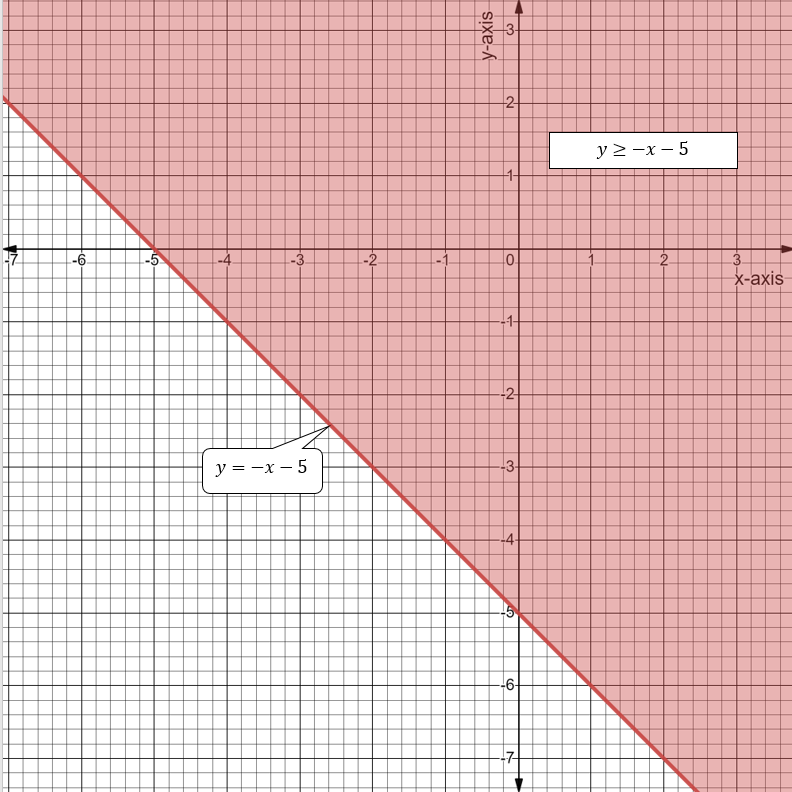
Given: The inequality is y ≥−x−5
We have to graph this inequality.
For that, we have to draw a line y = −x−5 and shade the solution region which is above the line.
We can check this solution by using a random point.
We have y ≥−x−5
To graph this inequality
First, we have to draw a line y=−x−5 and shade the solution region which is above the line. i.e.
To check this solution Let us take a random point (0,0) So here, x = 0 y = 0 Therefore
⇒ y ≥−x−5
⇒ 0≥−0−5
⇒ 0≥−5
Here,(0,0) is in the solution therefore, the solution is true.
The graph of the inequality y ≥−x−5 is

Big Ideas Math Student Journal Exercise 5.6 Explained
Big Ideas Math Algebra 1 Student Journal 1st Edition Chapter 5 Solving Systems Of Linear Equations Exercise 5.6 Page 158 Exercise 5 Answer
Let x is the number of books and y is the number of pencils.
A person has $15 and wants to buy notebooks and pencils.
If the price of a notebook is $2 and the price of a pencil is $1.
Then the items of each type the person can buy are 2x + y ≤ 15.
An example of a real-life situation that can be modeled using a linear inequality in two variables is.
A person has $15 and wants to buy notebooks and pencils.
If the price of a notebook is $2 and the price of a pencil is $1.
Then the items of each type the person can buy are 2x + y ≤ 15.
Page 160 Exercise 2 Answer
Given: The given inequality is x−y ≥ 2 and the ordered pair is (5,3).
We have to find whether the ordered pair is a solution to the inequality.
For that, we have to check whether the given ordered pair satisfies the inequality.
We have the inequality x−y ≥ 2. The given ordered pair is(5,3)i.e.
⇒ x−y ≥ 2
⇒ 5−3 ≥ 2
⇒ 2 ≥ 2
Here this solution is true.
The given ordered pair(5,3) is a solution to the inequality x−y ≥ 2
Page 160 Exercise 3 Answer
Given: The inequality is x + 2y ≤ 4 and the ordered pair is (−1,2).
We have to find whether the ordered pair is a solution to the inequality.
For that, we have to check whether the given ordered pair satisfies the inequality.
We have the inequality x + 2y ≤ 4. The given ordered pair is (−1,2) i.e.
⇒ −1 + 2 × 2 ≤ 4
⇒ −1 + 4 ≤ 4
⇒ 3 ≤ 4
Here this solution is true.
The given ordered pair(−1,2) is a solution to the inequality x + 2y ≤ 4.
Page 160 Exercise 4 Answer
Given: The inequality is 5x + y < 7 and the ordered pair is (2,−2).
We have to find whether the ordered pair is a solution to the inequality.
For that, we have to check whether the given ordered pair satisfies the inequality.
We have the inequality 5x + y < 7. The given ordered pair is (2,−2) i.e.
⇒ 5×2+(−2) < 7
⇒ 10−2 < 7
⇒ 8 < 7
Here this solution is not true.
The given ordered pair(2,−2) is not a solution to the inequality 5x + y < 7.
Page 160 Exercise 6 Answer
Given: The inequality is −x−2y ≥ 5 and the ordered pair is (−2,−3).
We have to find whether the ordered pair is a solution to the inequality.
For that, we have to check whether the given ordered pair satisfies the inequality.
We have the inequalit y−x−2y ≥ 5 .The given ordered pair is (−2,−3)i.e.
⇒ −x−2y ≥ 5
⇒ −(−2)−2(−3) ≥ 5
⇒ 2−(−6) ≥ 5
⇒ 2 + 6 ≥ 5
⇒ 8 ≥ 5
Here this solution is true.
The given ordered pair(−2,−3) is a solution to the inequality y−x−2y≥5.
Chapter 5 Exercise 5.6 Solving Systems Practice
Big Ideas Math Algebra 1 Student Journal 1st Edition Chapter 5 Solving Systems Of Linear Equations Exercise 5.6 Page 160 Exercise 7 Answer
Given: The inequality is y < 4.
We have to graph this inequality.
For that, we have to draw a line y = 4 and shade the solution region which is below the line.
We have y<4
To graph this inequality
First, we have to draw a line y=4 and shade the solution region which is below the line. i.e.

The graph of the inequality y<4 is

Page 160 Exercise 8 Answer
Given: The inequality is y >−1.
We have to graph this inequality.
For that, we have to draw a line y = −1 and shade the solution region which is above the line.
We have y >−1
To graph this inequality
First, we have to draw a line y >−1
and shade the solution region which is above the line.
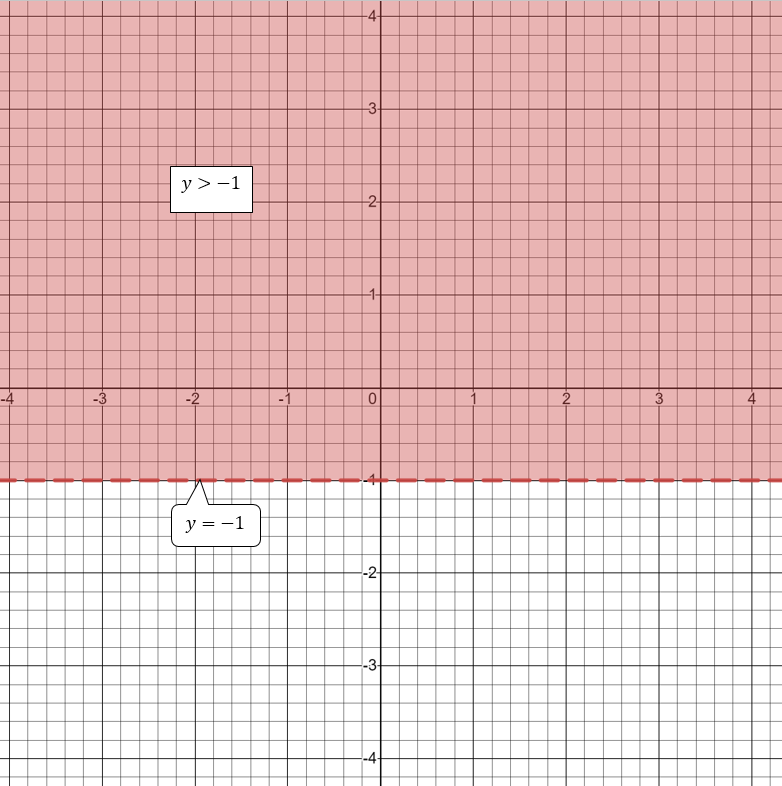
The graph of the inequality y >−1

Page 160 Exercise 9 Answer
Given: The inequality is x >3.
We have to graph this inequality.
For that, we have to draw a line x=3 and shade the solution region which is greater than x=3.
We have x >3
To graph this inequality
First, we have to draw a line x = 3 and shade the solution region greater than x = 3. i.e.

The graph of the inequality x >3 is

Big Ideas Math Algebra 1 Student Journal 1st Edition Chapter 5 Solving Systems Of Linear Equations Exercise 5.6 Page 160 Exercise 10 Answer
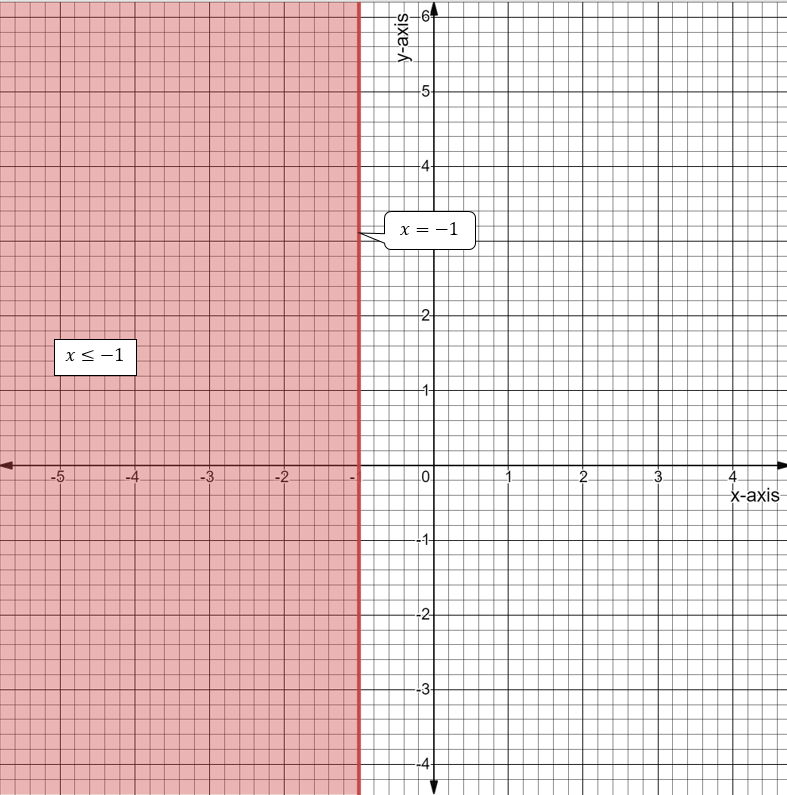
Given: The inequality is x ≤−1.
We have to graph this inequality.
For that, we have to draw a line x =−1 and shade the solution region which is less than or equal to−1.
We have x ≤−1
To graph this inequality
First, we have to draw a line x =−1 and shade the solution region less than or equal to−1. i.e.

The graph of the inequality x = −1 is
Page 160 Exercise 11 Answer
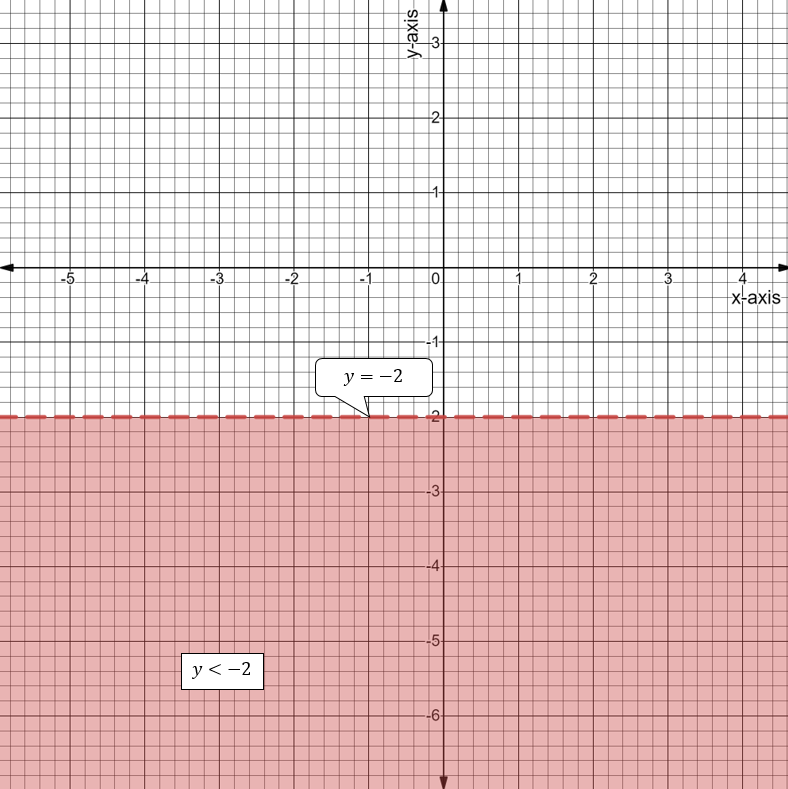
Given: The inequality is y <−2.
We have to graph this inequality.
For that, we have to draw a line y = −2 and shade the solution region which is below the line.
We have y <−2
To graph this inequality
First, we have to draw a line y <−2 and shade the solution region which is below the line. i.e.

The graph of the inequality y <−2 is
Page 160 Exercise 12 Answer
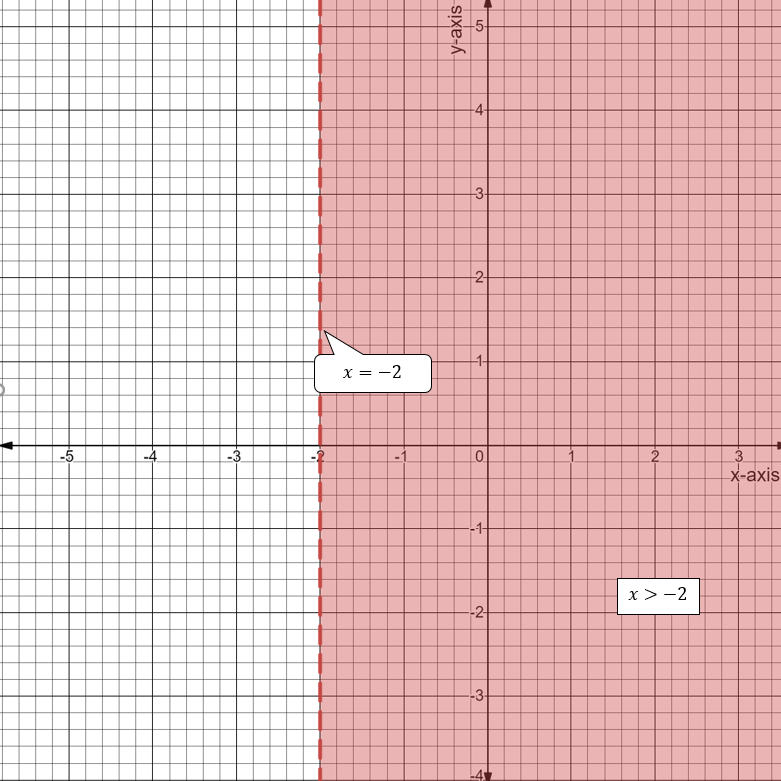
Given: The inequality is x >−2.
We have to graph this inequality.
For that, we have to draw a line x = −2 and shade the solution region which is greater than−2.
We have x >−2
To graph this inequality
First, we have to draw a line x =−2 and shade the solution region greater than−2. i.e.

The graph of the inequality x >−2 is
Big Ideas Math Algebra 1 Exercise 5.6 Guide
Big Ideas Math Algebra 1 Student Journal 1st Edition Chapter 5 Solving Systems Of Linear Equations Exercise 5.6 Page 161 Exercise 13 Answer
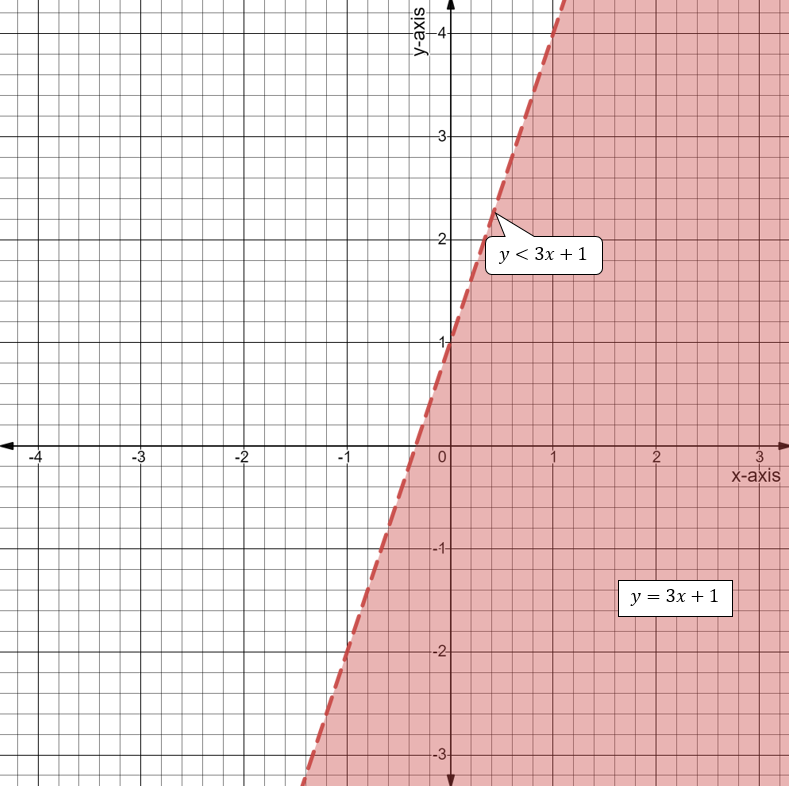
Given: The inequality is y< 3x + 1.
We have to graph this inequality.
For that, we have to draw a line y = 3x + 1 and shade the solution region which is below the line.
We have y < 3x + 1
To graph this inequality
First, we have to draw a line y = 3x + 1 and shade the solution region which is below the line. i.e.

The graph of the inequality y = 3x + 1 is
Page 161 Exercise 15 Answer
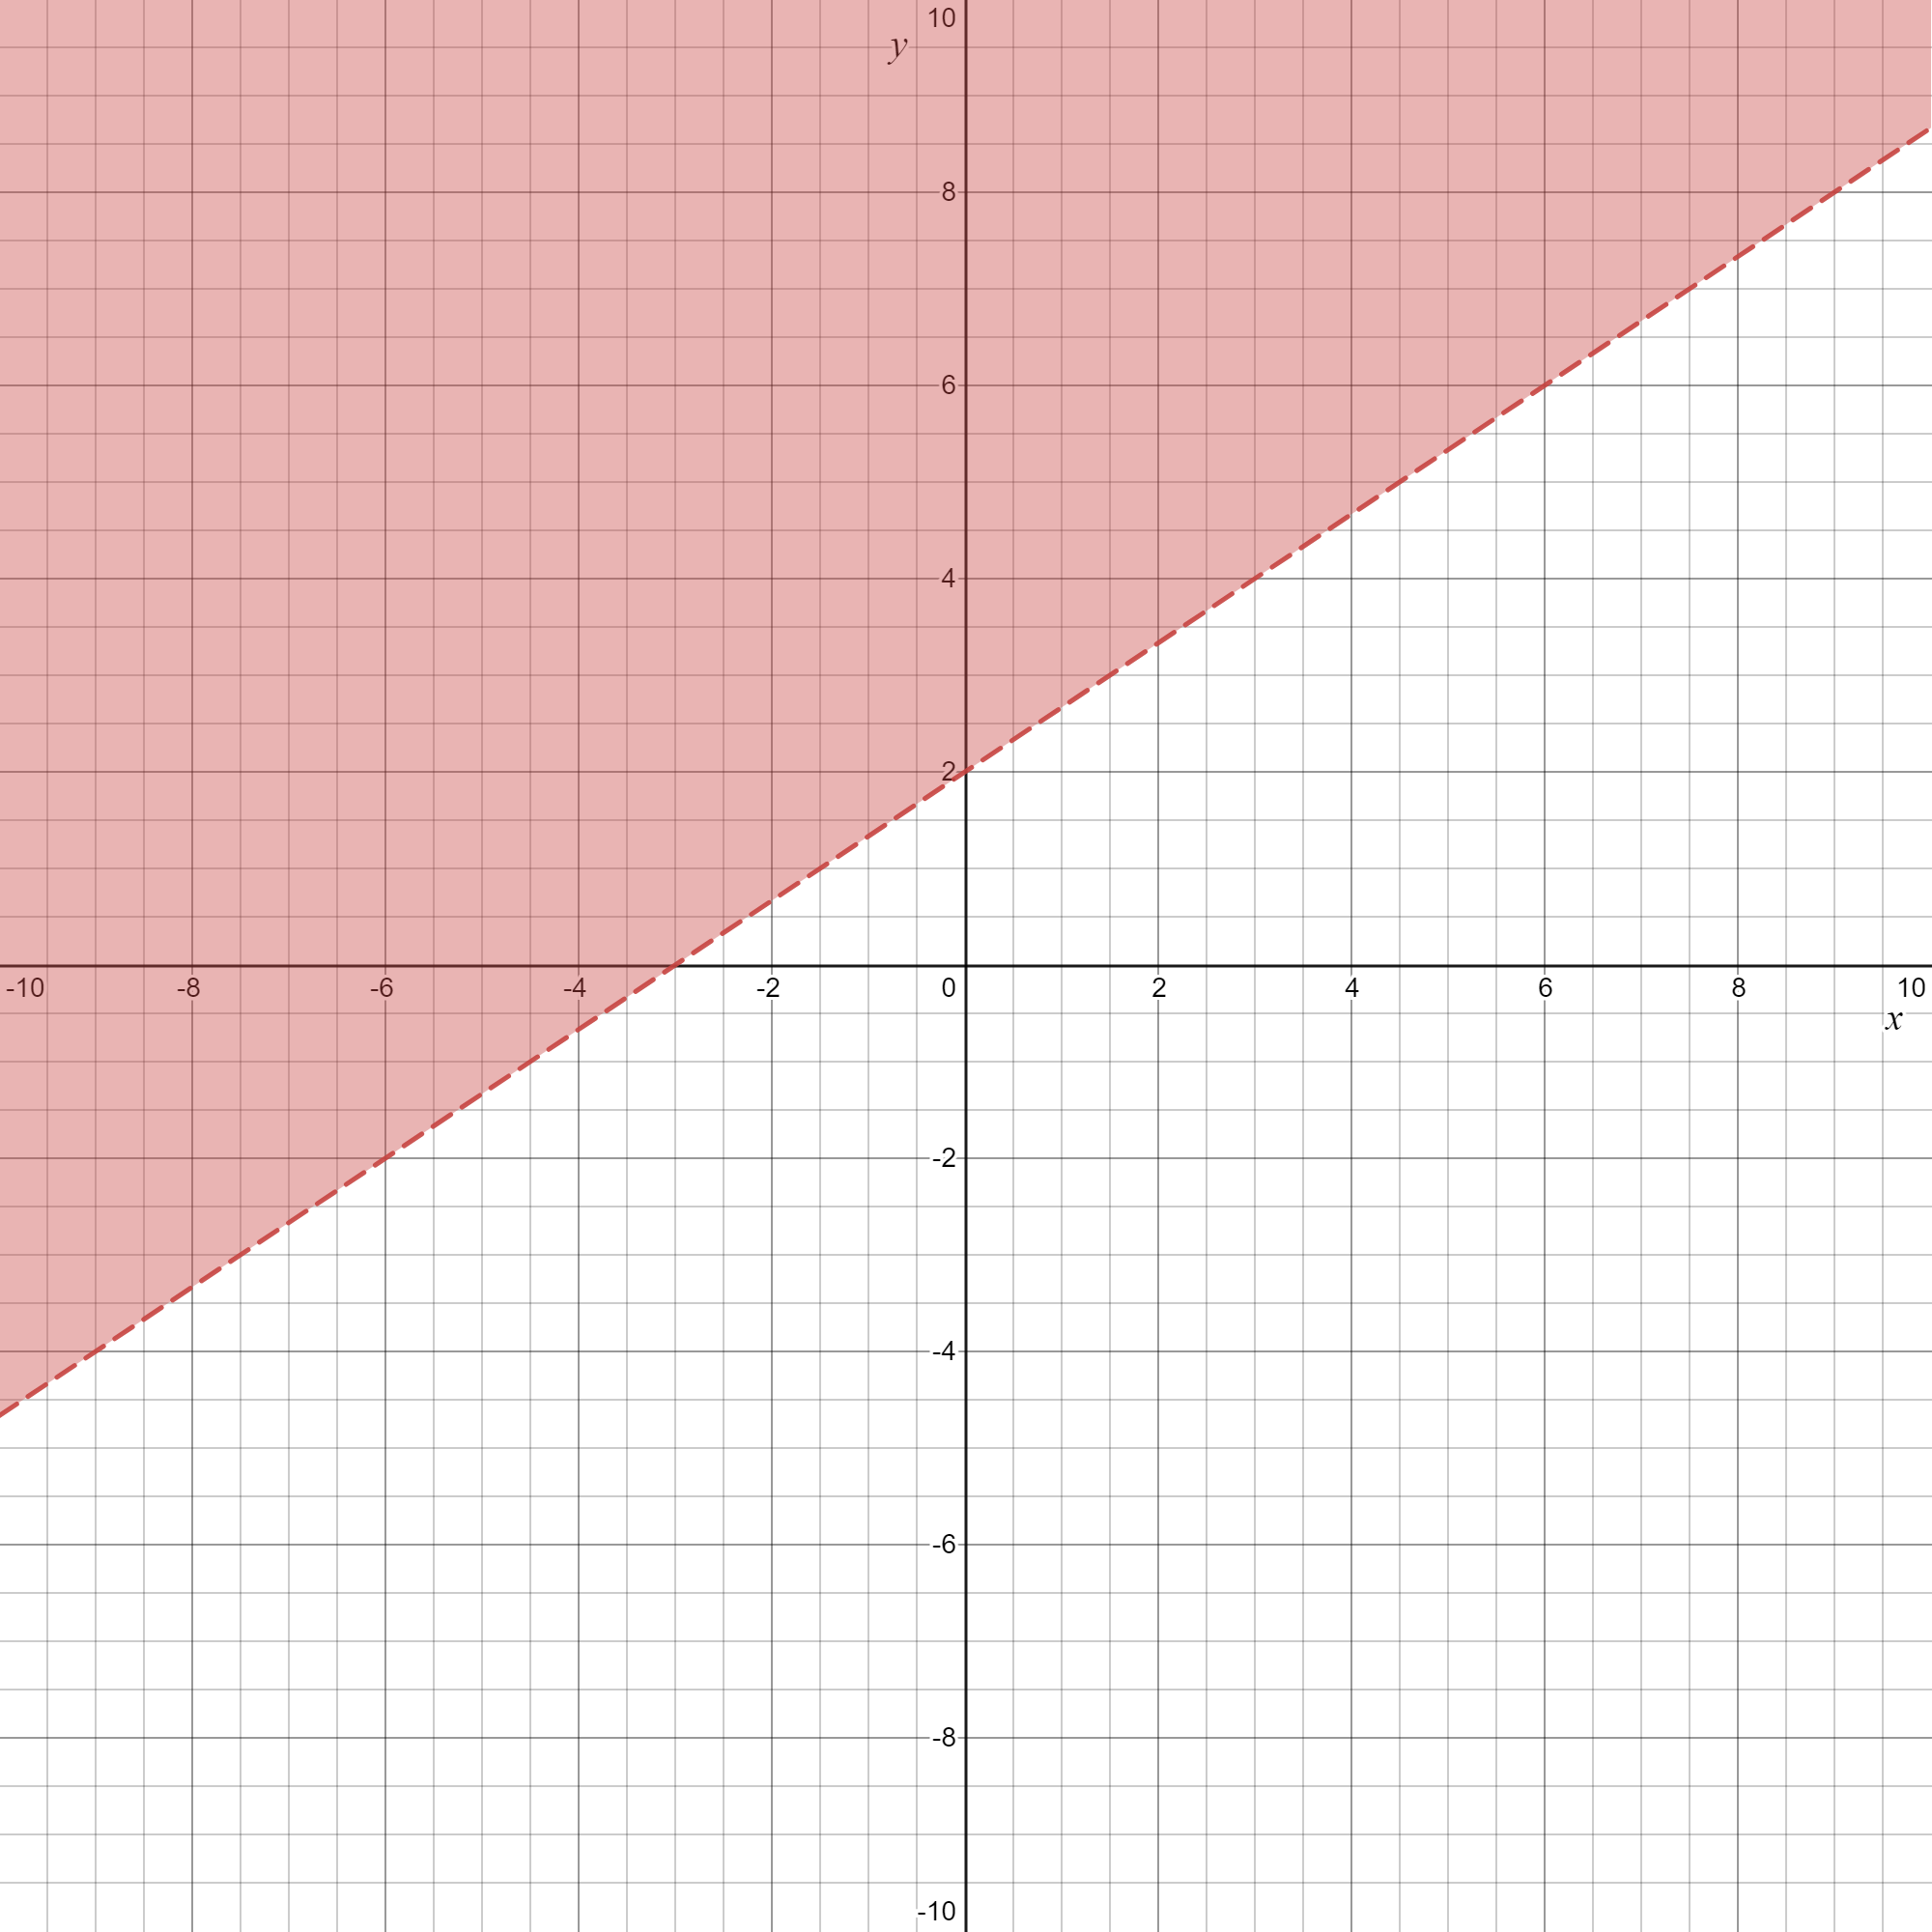
Given: x−y < 2
To find graph the inequality in a coordinate plane.
First, get y alone on one side, then consider the related equation obtained by changing the inequality.
Sign to an equality sign, then the graph of this equation is a line.
If the inequality is strict graph a dashed line and if the inequality is not strict graph a solid line.
The given inequality can be rewritten as
⇒ x−y < 2
⇒ −y < 2 − x
⇒ y > −2 + x
The related equation is y = −2 + x.
Since the inequality sign is strict, so draw a dashed line for the related equation.
Since the inequality sign is greater than, so shade the region above the boundary line.
So, the graph of the inequality x−y < 2 is
The graph of the inequality x−y < 2 in a coordinate plane is

Page 161 Exercise 16 Answer
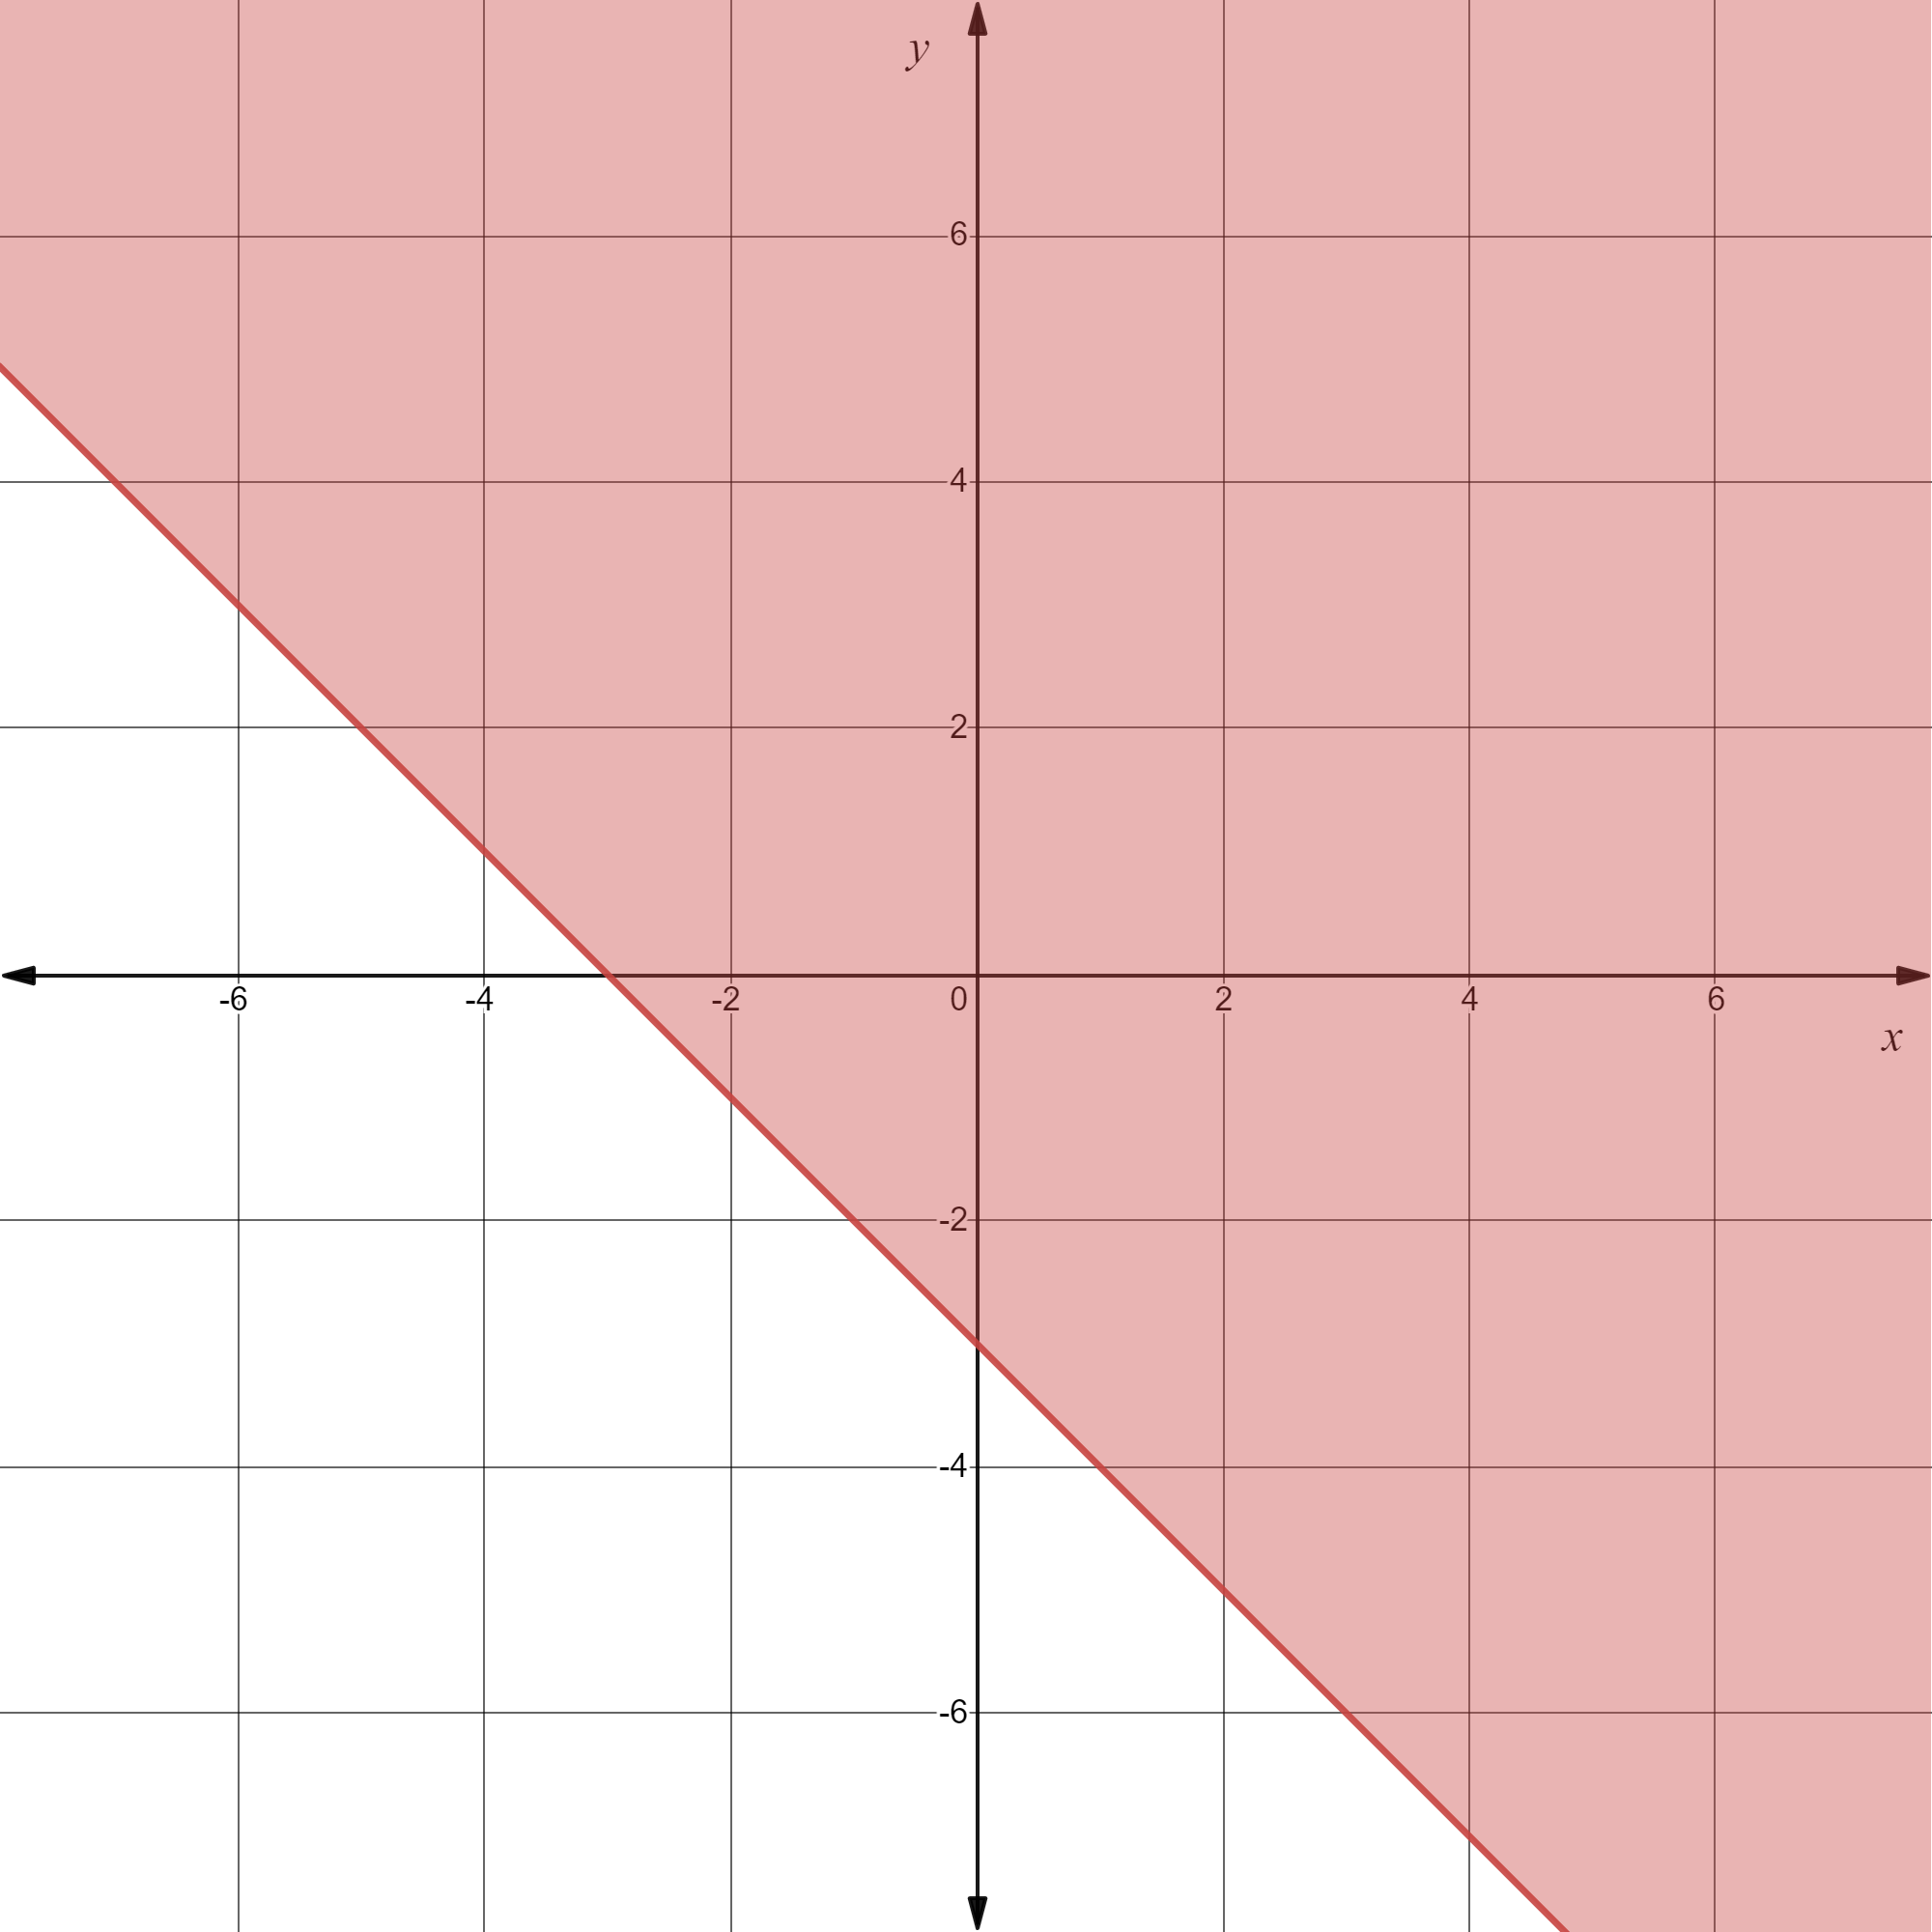
Given: x + y ≥−3
To find graph the inequality in a coordinate plane.
First, get y alone on one side, then consider the related equation obtained by changing the inequality.
Sign to an equality sign, then the graph of this equation is a line.
If the inequality is strict graph a dashed line and if the inequality is not strict graph a solid line.
The given inequality can be rewritten as
⇒ x + y ≥ −3
⇒ y ≥ −3−x
The related equation is y = −3−x.
Since the inequality sign is not strict, so draw a solid line for the related equation.
Since the inequality sign is greater than or equal to, so shade the region above the boundary line.
So, the graph of the inequality x + y ≥−3 is

The graph of the inequality x + y ≥ −3 in a coordinate plane is
How To Solve Exercise 5.6 Big Ideas Math Chapter 5
Big Ideas Math Algebra 1 Student Journal 1st Edition Chapter 5 Solving Systems Of Linear Equations Exercise 5.6 Page 161 Exercise 17 Answer
Given: x + 2y < 4
To find a graph of the inequality in a coordinate plane.
First, get y alone on one side, then consider the related equation obtained by changing the inequality.
Sign to an equality sign, then the graph of this equation is a line.
If the inequality is strict graph a dashed line and if the inequality is not strict graph a solid line.
The given inequality can be rewritten as
⇒ x + 2y < 4
⇒ 2y < 4−x
⇒ y<\(2-\frac{x}{2}\)
The related equation is y=\(2-\frac{x}{2}\)
Since the inequality sign is strict, so draw a dashed line for the related equation.
Since the inequality sign is less than, so shade the region below the boundary line.
So, the graph of the inequality x + 2y < 4 is
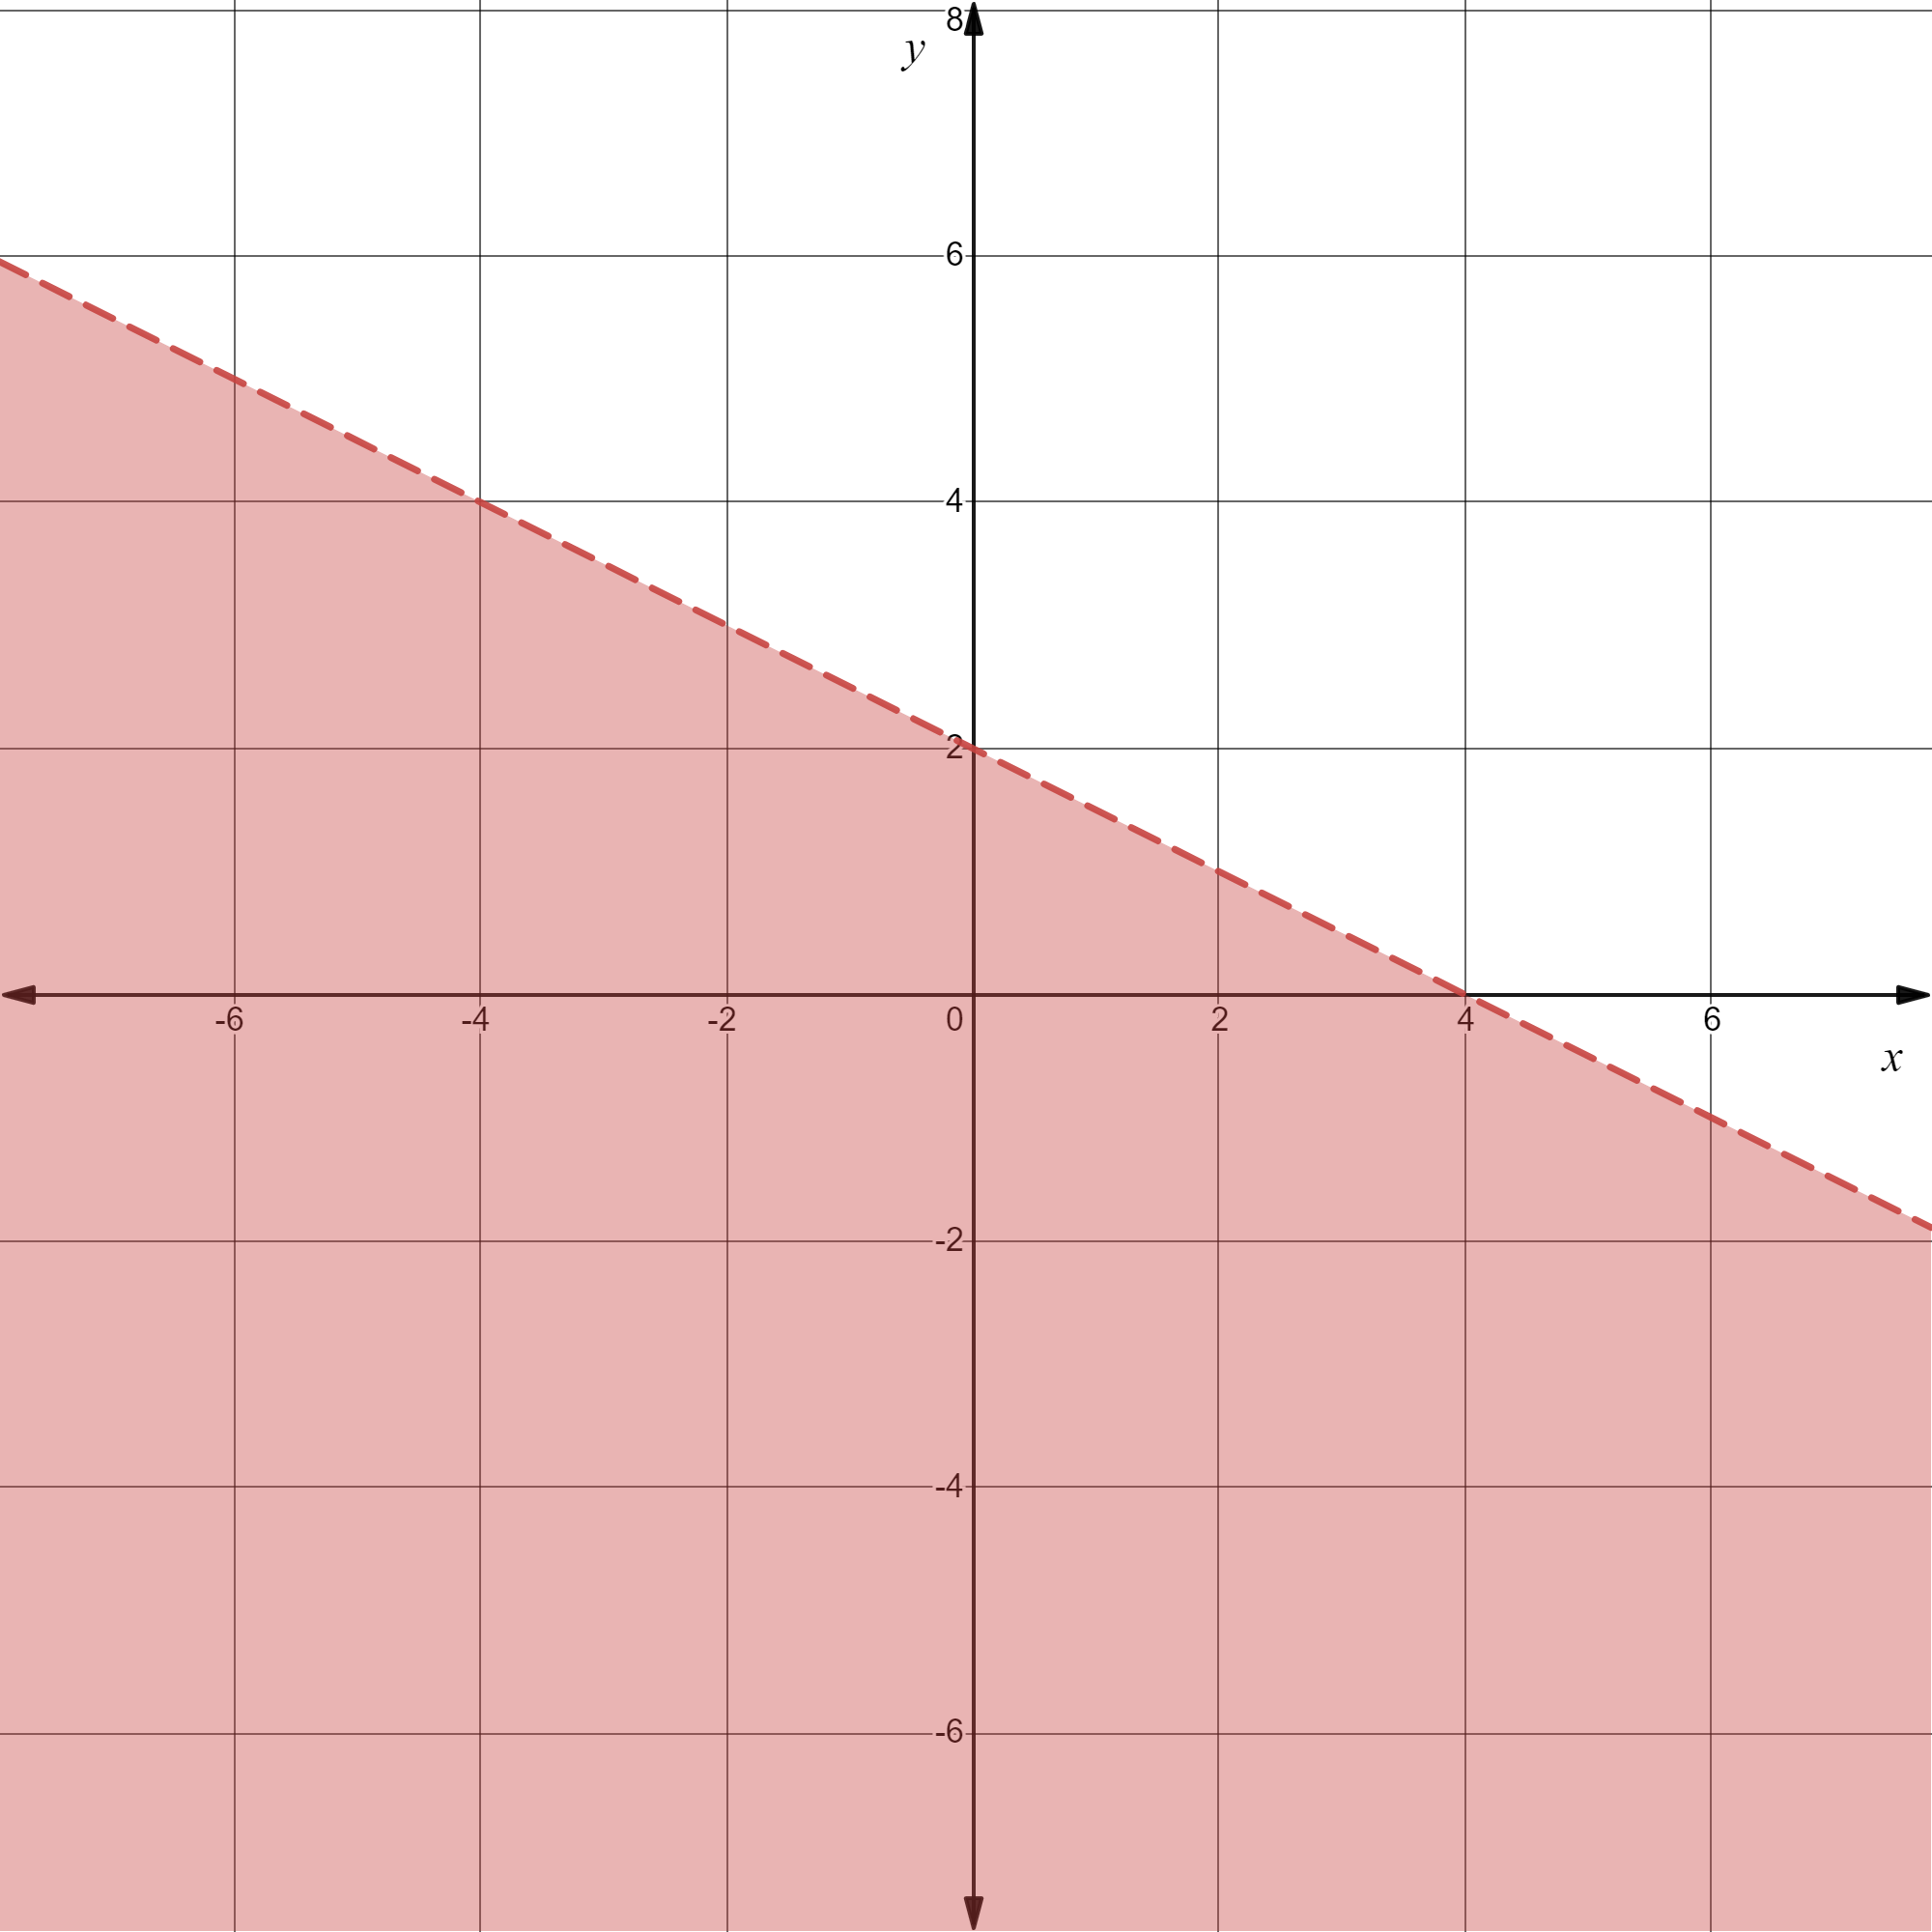
The graph of the inequality x + 2y < 4 in a coordinate plane is

Page 161 Exercise 18 Answer
Given: The linear function, −2x+3y>6.
Let’s assume it a linear equation, and Find the coordinates of the x, and y-axis intersecting points.
Plot them on the graph and draw a dotted line connecting those points.
Shade the area above that linear equation.
Let, the linear equation be −2x + 3y = 6.
Point of intersecting X – axis is (x,0)
⇒−2(x)+3(0)=6
⇒−2x=6
⇒x=−3
∴ The point of the intersecting X-axis is (-3,0)
Plot the points in graph
The graph of given inequality is

Big Ideas Math Algebra 1 Student Journal 1st Edition Chapter 5 Solving Systems Of Linear Equations Exercise 5.6 Page 161 Exercise 19 Answer
Given: Profit on sale of each digital camera x is 100 and cell phone y is 50.
By selling digital cameras and cell phones store wants to make profit at least 300.
Find a linear equation and plot the linear equation on a graph.
Find any two points justifying the equation and interpret
Let, the number of digital cameras sold be x, cellphones sold be y.
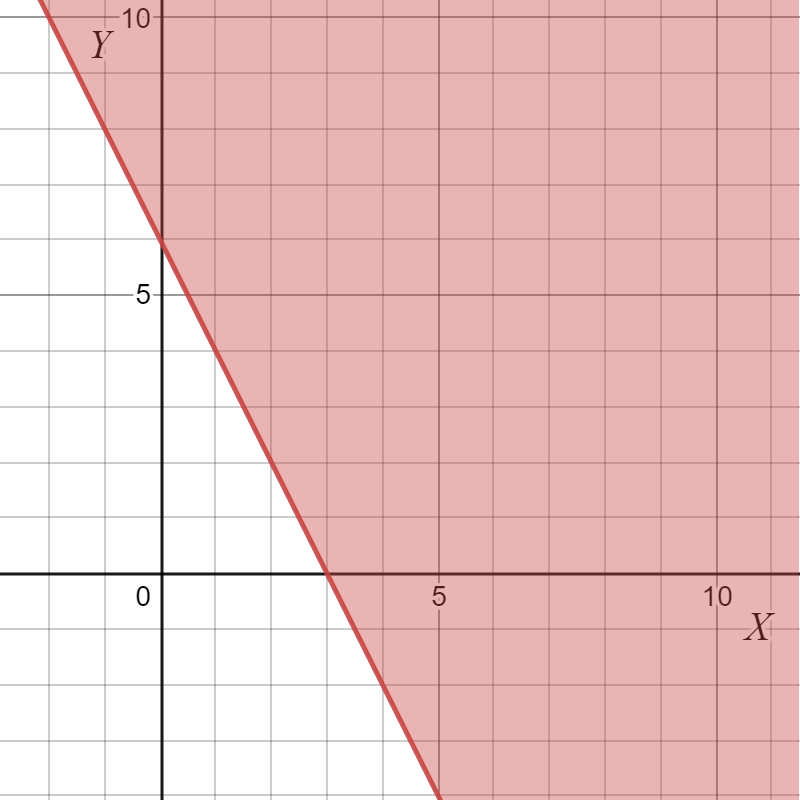
Then, the linear inequality will be 100x + 50y ≥ 300.
Plot the inequality on graph
Identify any two points covered in the shaded area
At (1,4), i.e. one unit of digital camera and 4 units of cell phones sold profit will be
=100(1) + 50(4)
=300
At (4,2), i.e. 4 units of Digital cameras and 2 units of cell phones sold profit will be
=100(4) + 50(2)
=500(>300)
A linear inequality is 100x +50y ≥ 300. Graph of the above linear inequation is
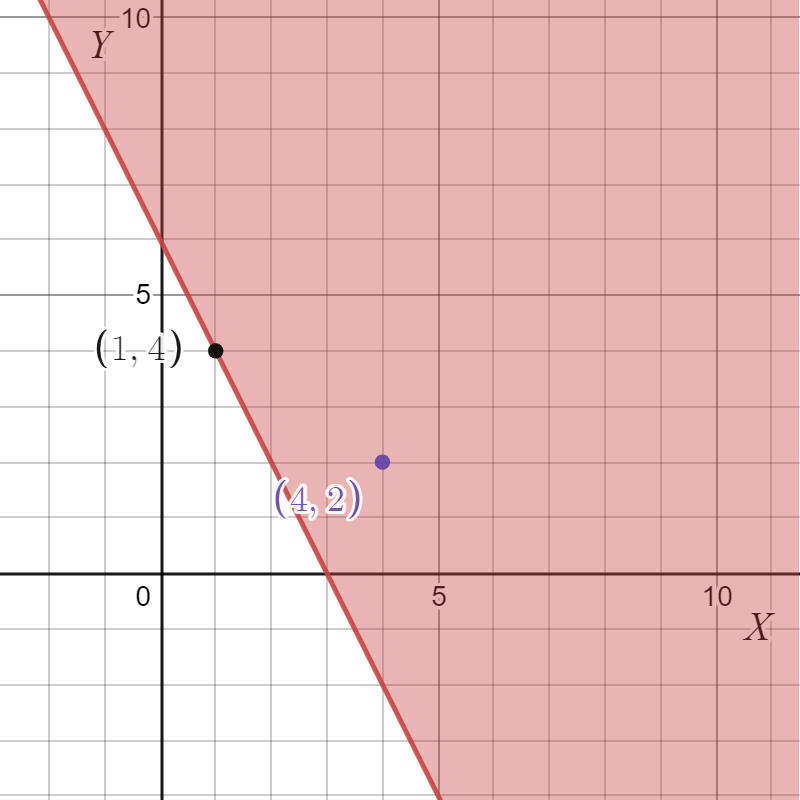
Any point covered under the shaded area will solve the given inequation
Big Ideas Math Chapter 5 Exercise 5.6 Answer Key