
Big Ideas Math Algebra 1 Student Journal 1st Edition Chapter 4 Writing Linear Functions
Page 116 Essential Question Answer
Given: scatter plot.
To find Tell how can you analytically find a line of best fit for a scatter plot.
Firstly, we will pick any two points from the scatter plot, say (x1,y1),(x2,y2) such that the line of best-fit stays close to almost all the points. Then, we will substitute these points into the slope formula:m\(=\frac{y_2-y_1}{x_2-x_1}\).
The resultant value of m will be the slope of the line of best fit. Then, we will substitute the point (x1,y1)and the slope into the point-slope form of the equation of the line y−y1=m(x−x1).
Then, we will simplify the equation to get the form of slope-intercept form of the equation of the line y=mx+b, where, m is the slope and b is the y-intercept. The resultant equation will be the line of best fit for a scatter plot.
We can find the line of best fit for a scatter plot analytically using the slope formula and the point-slope form of the equation of the line and then, finally simplifying the equation to get the slope-intercept form of the equation of the line.
Big Ideas Math Algebra 1 Chapter 4 Writing Linear Functions Solutions
Big Ideas Math Algebra 1 Student Journal 1st Edition Chapter 4 Writing Linear Functions Page 116 Exercise 1 Answer
Given:
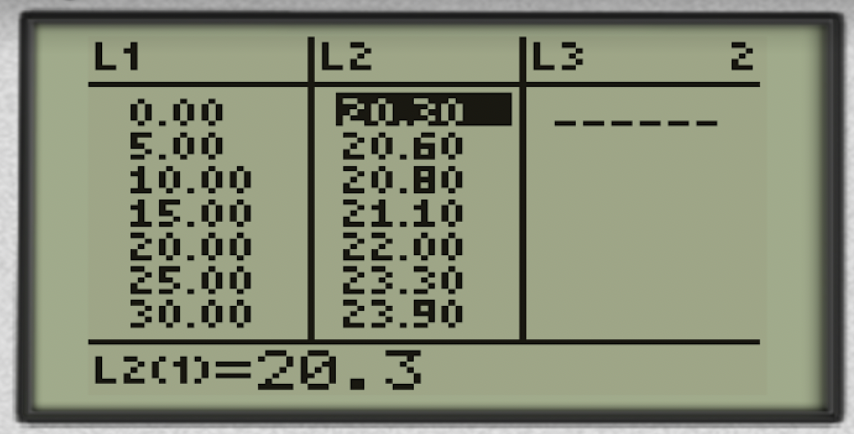
The scatter plot shows the median ages of American women at their first marriage for selected years from 1960 through 2010.

The data from the scatter plot is shown in the table. Note that 0,5,10, and so on represent the number of years since 1960.
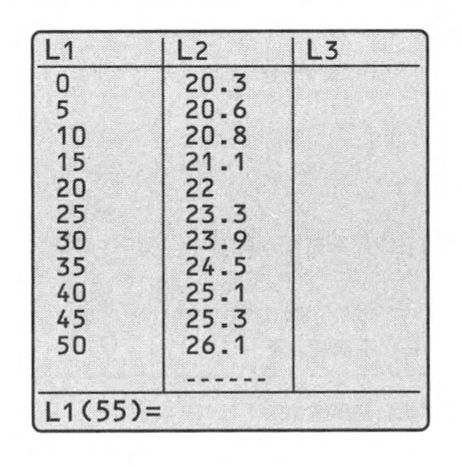
To find Tell what does the ordered pair (25,23.3) represent.
From the scatter plot, we can see that the x-coordinate represents the number of years since 1960.
Thus, 25 in the given ordered pair represents the year 1960+25=1985.
Also from the scatter plot, we can see that the y-coordinate represents the median ages of American women at their first marriage. Thus, 23.3 in the given ordered pair represents the median age of women in the year 1985 at their first marriage.
The ordered pair represents that the median age of American women at their first marriage for the year is 1985 is 23.3
Given:
The scatter plot shows the median ages of American women at their first marriage for selected years from 1960 through 2010.
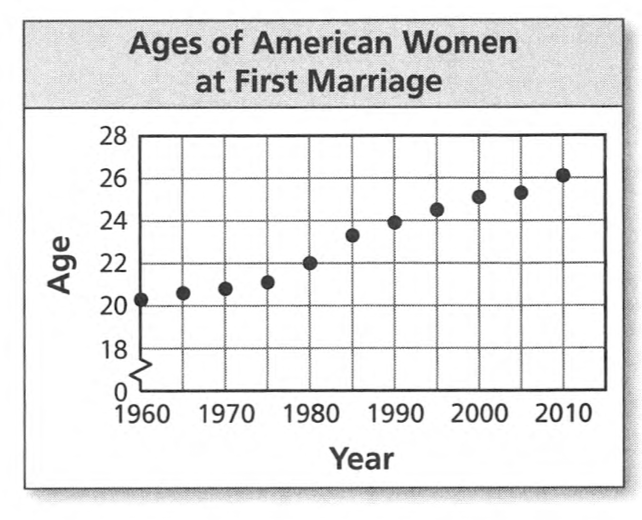
The data from the scatter plot is shown in the table. Note that 0,5,10, and so on represent the number of years since 1960.

To find Use the linear regression feature to find an equation of the line of best fit.
We will first input the given data in the table in our graphing calculator.
Then, we will use the linear regression feature of the graphing calculator.
Inputting the data from the given table into the graphing calculator, we get the following data
Now, using the linear regression feature in the graphing calculator, we get the line of best fit as y=0.13x+19.85
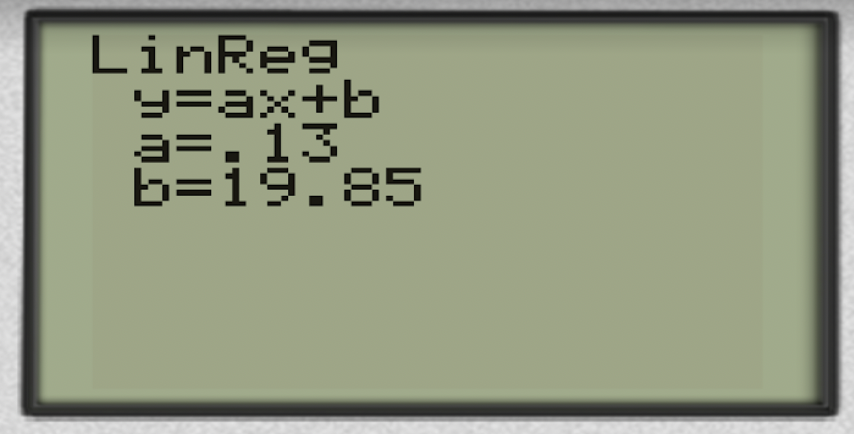
We have the equation of the line of best fit for the given data as y=0.13x+19.85 which is found using the linear regression feature in the graphing calculator.
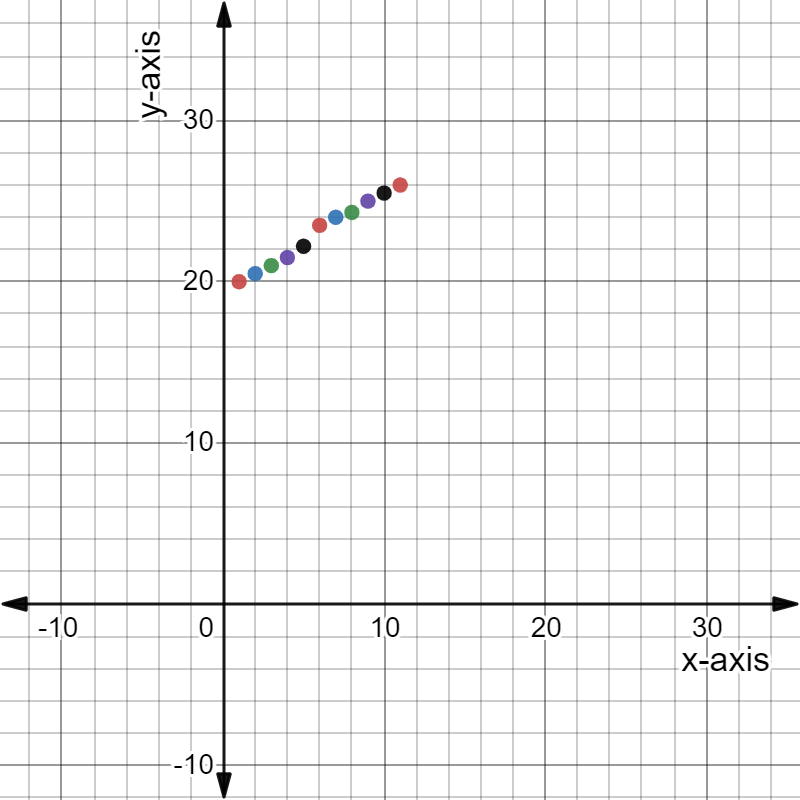
Given:
A scatter plot has been.
It has been asked to find an equation of the line of best fit.
For this, a line is drawn and then its equation needs to be found out.
The scatter plot in the graph paper looks like
Now finding the slope of the line that best suits
m\(=\frac{y_2-y_1}{x_2-x_1}\)
m=\(\frac{21-20}{3-1}\)
m\(=\frac{1}{2}\)
Now the line cuts the y-axis at(0,20)
The y−intercept must be 20 from the above graph
So, the line best suits are y\(=\frac{1}{2} x+20\)
And the graph looks like
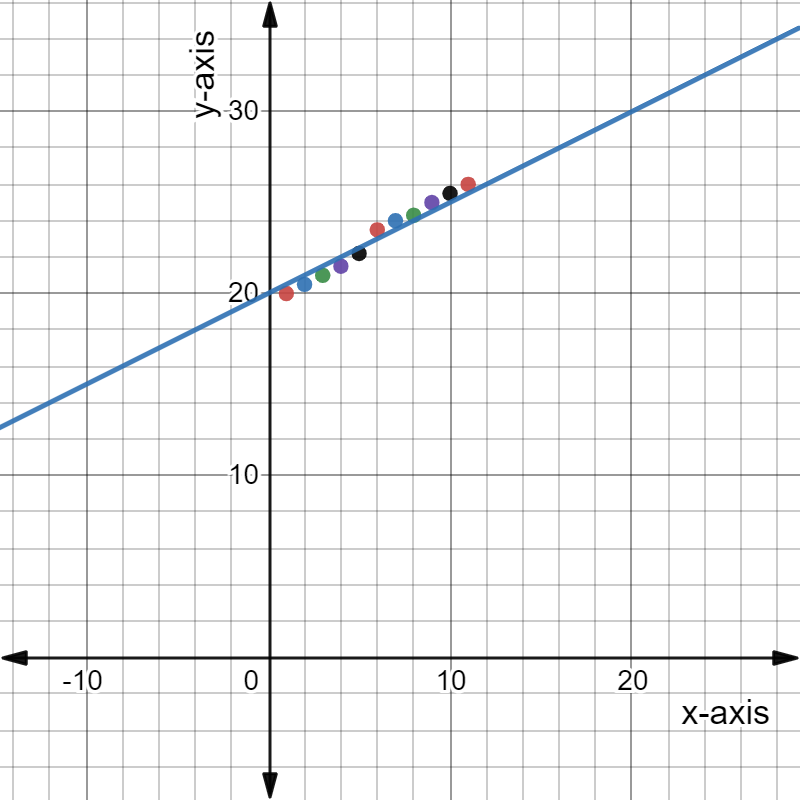
The equation of the line that best suits the scatter plot is y\(=\frac{1}{2} x+20\) and its looks like

Writing Linear Functions Chapter 4 Big Ideas Math
Big Ideas Math Algebra 1 Student Journal 1st Edition Chapter 4 Writing Linear Functions Page 117 Exercise 2 Answer
To find a line that best suits the scatter plot is
To draw a line such that the number of points below that line and the number of points above the line must be almost equal.
A line best fits the scatter plot is the number of points above and below the line should be almost equal.
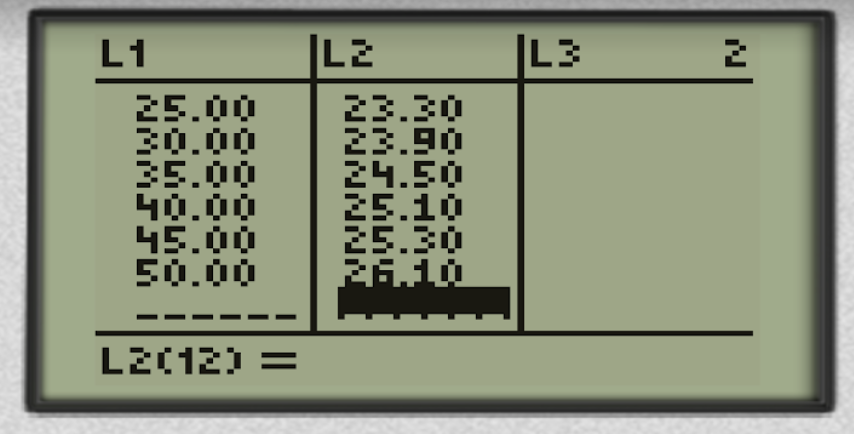
Page 119 Exercise 1 Answer
A table and an equation has been given.
It has been asked to find to determine whether the model is a good fit for the data in the table.
For this, the graph needs to be plotted using the graphing calculator and then the point from the table needs to be put and see it best suits the line of the equation or not.
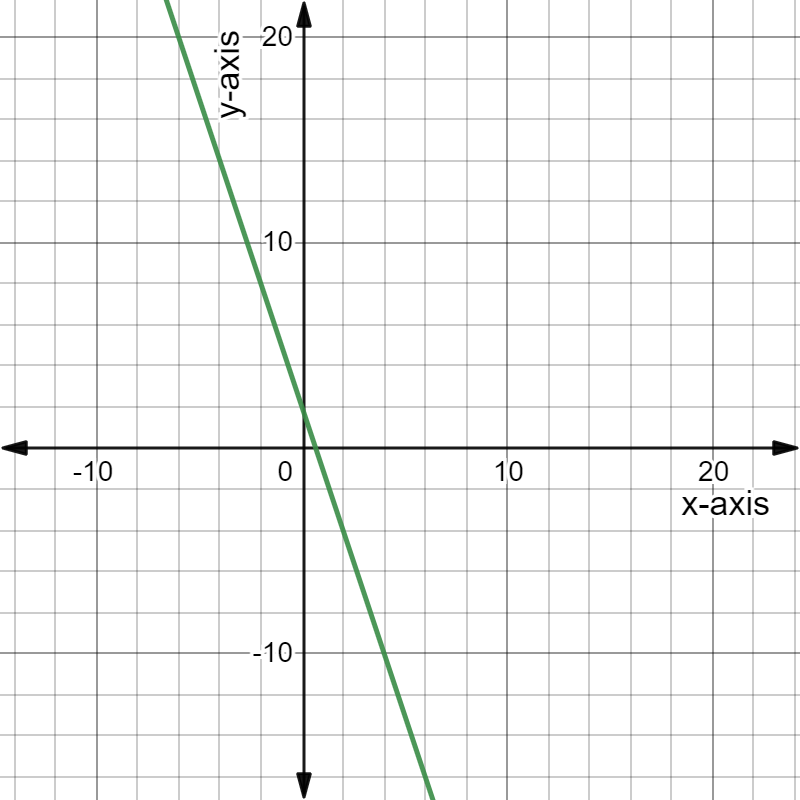
Now plotting the equation y=−3x+2 using the graphing calculator
Now plotting all the points from the given table
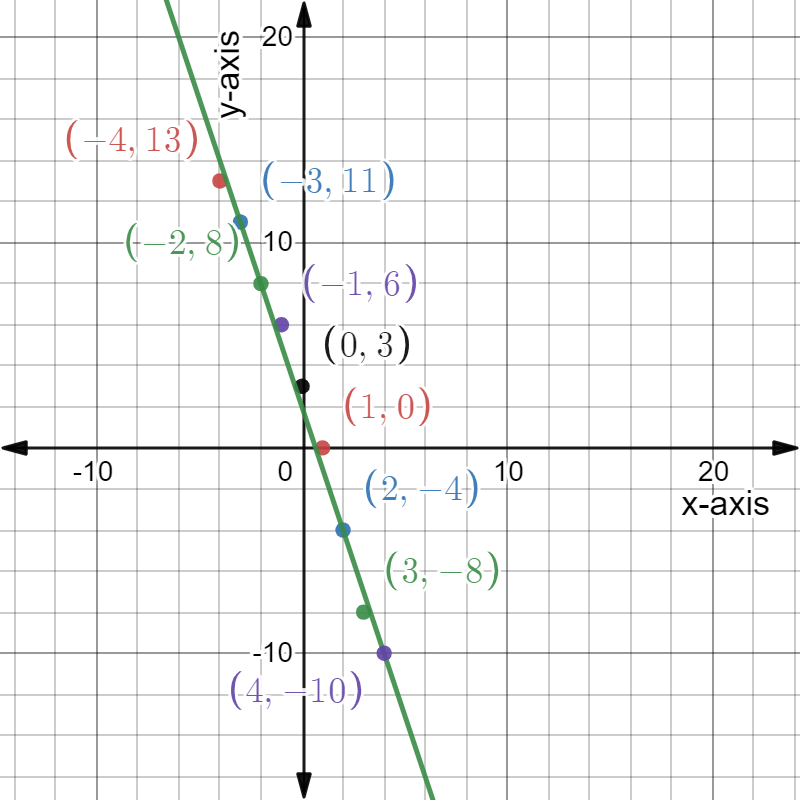
The point best fit the line So it best fits the equation of the line
After analysis, it has been found that the given table is the best fit for the equation y=−3x+2 and it can be seen in the diagram below

Algebra 1 Student Journal Chapter 4 Writing Linear Functions Answers
Big Ideas Math Algebra 1 Student Journal 1st Edition Chapter 4 Writing Linear Function Page 120 Exercise 2 Answer
A table and an equation has been given.
It has been asked to find to determine whether the model is a good fit for the data in the table.
For this, the graph needs to be plotted using the graphing calculator and then the point from the table need to be put and see it best suits the line of the equation or not.
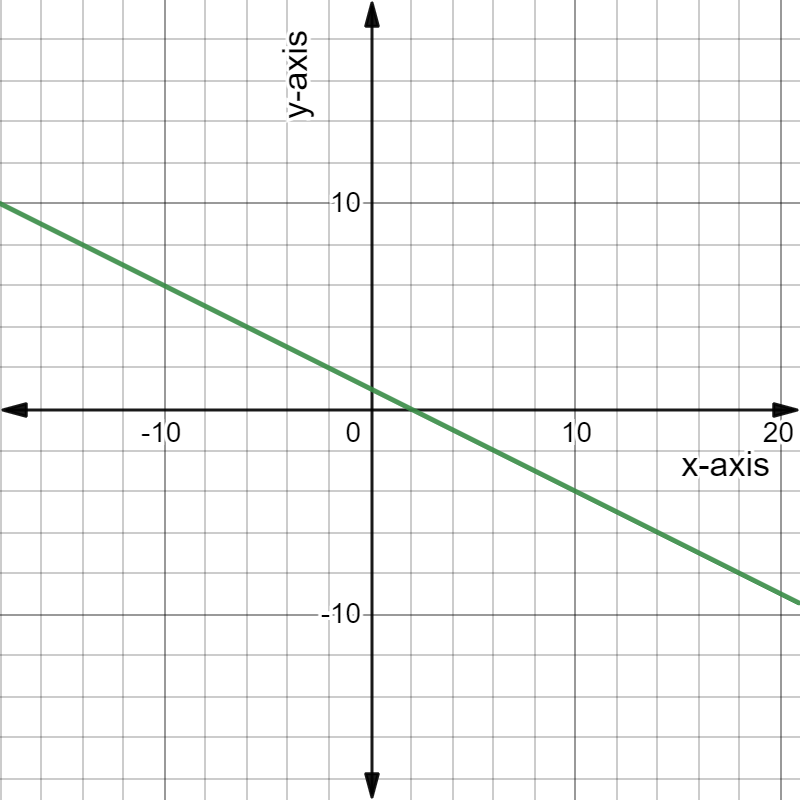
Now plotting the equation y=−0.5x+1 using the graphing calculator
Now plotting all the points from the given table
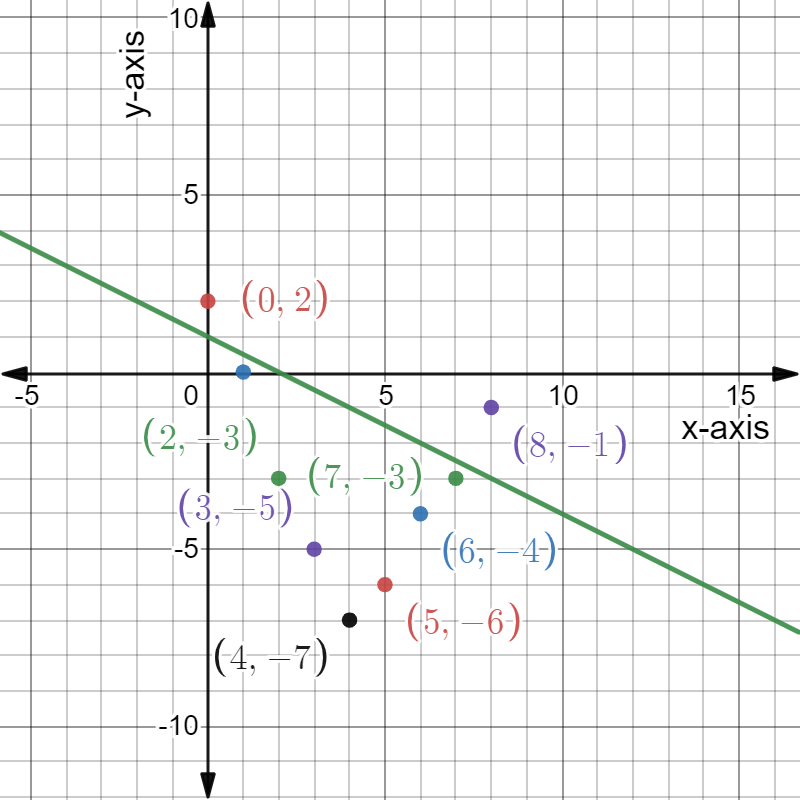
The point above the line is only one and the rest all are below it. So this does not fit the equation.
After analysis, it has been found that the given table does not best fit the equation y=−0.5x+1 and it can be seen in the diagram below

Chapter 4 Writing Linear Functions Step-By-Step Big Ideas Math