
Big Ideas Math Algebra 1 Student Journal 1st Edition Chapter 4 Writing Linear Functions Exercise 4.4
Page 112 Exercise 2 Answer
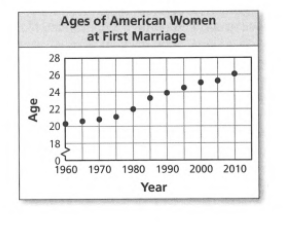
Given: The scatter plot shows the median ages of American women at their first marriage for selected years from 1960 through 2010.

Hence, We have to draw a line that approximates the data. and write an equation of the line.
Firstly, We will observe the given graph carefully, then we draw line approximates from the given data.
After that, locate the points in the graph so that to find the equation of the line,
Using two-point slope formula that is \(\frac{y_2-y_1}{x_2-x_1}=\frac{y-y_1}{x-x_1}\).

From the given graph. The line approximates the data is
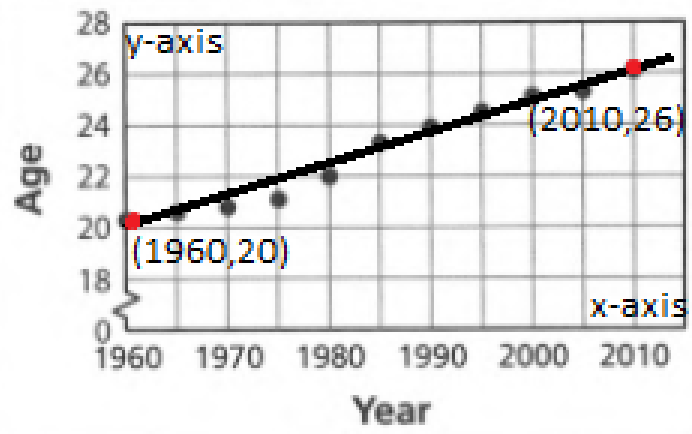
From the above step graph points are(1960,20),(2010,26)
By using the two-point slope formula \(\frac{y_2-y_1}{x_2-x_1}=\frac{y-y_1}{x-x_1}\)
Where,x1 =1960, x2=2010, y1 =20, y2=26.
On putting the values we get
\(\frac{26-20}{2010-1960}=\frac{y-20}{x-1960}\)3x−25y=5380
An equation of the line is And, the graph is

Given: The scatter plot shows the median ages of American women at their first marriage for selected years from 1960 through 2010.

Big Ideas Math Algebra 1 Chapter 4 Writing Linear Functions Answer Key
Hence, We have to write a conclusion from the equation we wrote From the above solution we get 3x−25y=5380
This equation tells that on increasing the x,y is also increasing. But the rate differs. that is, 3x=25y+5380
This means that as the years increase the ages is also increase.
The conclusion is on increasing the years, the age of American women at first marriage is also increasing.
Given: The scatter plot shows the median ages of American women at their first marriage for selected years from 1960
through 2010.
Hence, We have to predict the median age of American women at their first marriage in the year 2020.
We will take the help from the above solution, Then put the value of x which is equal to 2020 and we will get the age that is y.
The median age of American women at their first marriage in the year 2020 is 27 years.
Big Ideas Math Algebra 1 Student Journal 1st Edition Chapter 4 Writing Linear Functions Exercise 4.4 Page 114 Exercise 1 Answer
Given:
Hence, We have to find the weight of the baby when the baby is four months old.
Firstly, We will observe the given graph carefully
Then, from the given graph
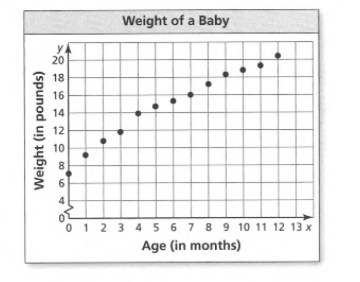
x−axis denotes the age of the baby and y-axis denotes the weight of the baby.
Therefore, for a 4-month-old baby’s weight according to the graph is 14 pounds.
The weight of the baby when the baby is four months old is 14
pound.
Given:

Hence, We have to find the age of the baby when the baby weighs 17.2 pounds.
Firstly, We will observe the given graph carefully, Then, from the given graph
x-axis denotes the age of the baby, and y−axis denotes the weight of the baby.
Therefore, if the baby’s weight is 17.2 pounds then the baby’s age from the graph is 8 months.
The age of the baby when the baby weighs 17.2 pounds is 8 months.
Big Ideas Math Student Journal Exercise 4.4 Solutions
Given:

Hence, We have to find What tends to happen to the weight of the baby as the age increases.
Firstly, We will observe the given graph carefully, Then, from the given graph.
As we know x-axis denotes the age of the baby and y−axis denotes the weight of the baby.
So, as the age of the baby increases then the weight of the baby also increases but not linearly, as we see in the graph that in some points the flow or linear increment is not followed.
The age of the baby increases similarly the weight of the baby is also increases but not linearly, as we see in the graph that in some points the flow or linear increment is not followed.
Page 115 Exercise 2 Answer
Given:
A graph with many coordinates

To find, the correlation of the coordinates.
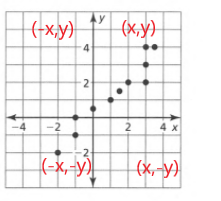
We label the coordinates according to their quadrant positions
Mark the signs of different coordinates in different quadrants

Since the y values increase as the x values increase, there is a positive correlation.
For the given graph,x and y show a positive correlation.
Big Ideas Math Algebra 1 Student Journal 1st Edition Chapter 4 Writing Linear Functions Exercise 4.4 Page 115 Exercise 3 Answer
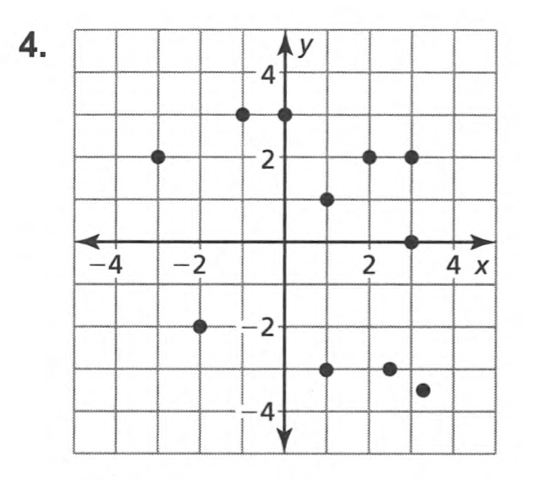
Given:
A graph with points in three quadrants
To find If x and y show a positive, a negative, or no correlation
We arrange them with respect to the position of their coordinates
From the graph
There are 2 points in the first quadrant, so the points are of the form (x,y)
There are 4 points in the second quadrant, so the points are of the form (−x,y)
There are no points in the third quadrant
There are 2 points in the fourth quadrant, so the points are of the form (x,−y)
In the first quadrant, there are 2 points on the horizontal axis, so the coordinates are of the form (x,0)
In the second quadrant, there is 1 point on the vertical axis, so the coordinates are of the form (0,y)
Since the y values decrease as the x values increase, there is a negative correlation.
For the given graph,x and y show a negative correlation.

Writing Linear Functions Practice Problems Chapter 4
Page 115 Exercise 4 Answer
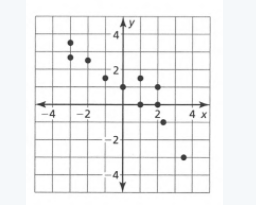
Given:
To find Tell whether x and y show a positive, a negative, or no correlation.
We can see from the above graph that there is no pattern between the x -values and the y -values.
Also, the points are scattered all over the coordinate plane.
Since the points represent the ordered pairs (x,y), thus, we can see that there is no correlation between x-values and y-values.
We can see clearly that if x increases, then, we cannot see any pattern in the y-values. Similarly, if y increases, then, we cannot see any pattern in the x-values.
The values of x and y show no correlation.
Big Ideas Math Algebra 1 Exercise 4.4 Answers
Big Ideas Math Algebra 1 Student Journal 1st Edition Chapter 4 Writing Linear Functions Exercise 4.4 Page 115 Exercise 5 Answer
Given:
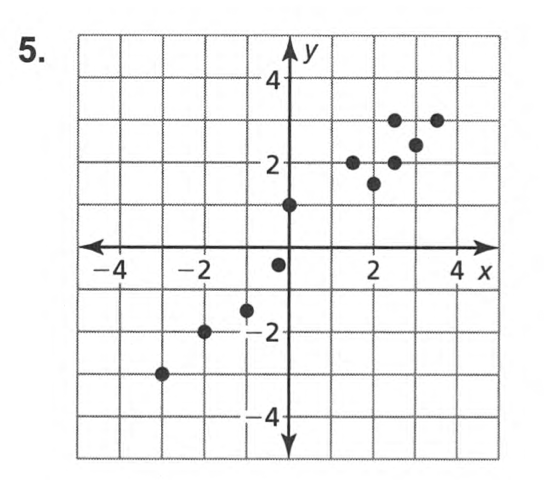
To find Tell whether x and y show a positive, a negative, or no correlation. We can see from the above graph that as x increases, the value of y also increases.
Also, the points are moving from left to right in the coordinate plane. Since the points represent the ordered pairs (x,y), thus, we can see that there is a positive correlation between x -values and y-values.
The values of x and y show a positive correlation.