
Big Ideas Math Algebra 1 Student Journal 1st Edition Chapter 3 Graphing Linear Functions Exercise 3.6
Page 84 Essential Question Answer
Given: The linear functions f(x)=x
g(x)=f(x)+c
h(x)=f(cx)
To find the comparison between the graphs of linear functions,
We will sketch the graph of the functions and then compare.
On graphing the functions, we will get
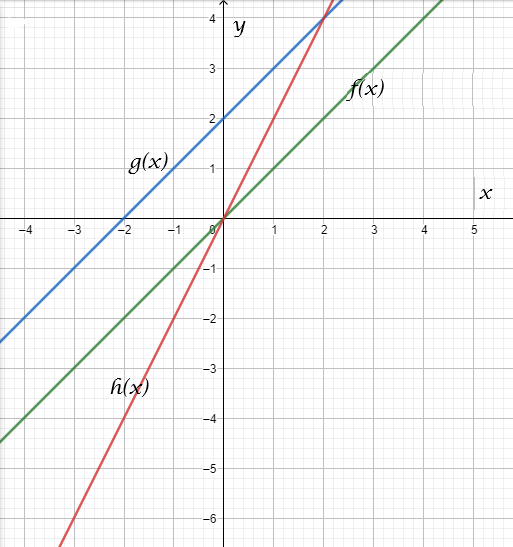
From the graph, we can see that f(x), and g(x) have different y-intercepts, and h(x), and f(x) have different slopes.
The slope of h(x) is c times the slope of f(x).
And the y−intercept of g(x) is c units more than f(x).
The linear function f(x)=x while comparing to the graphs of
g(x)=f(x)+c and
h(x)=f(cx), has different slopes and intercepts.
Read and Learn More Big Ideas Math Algebra 1 Student Journal 1st Edition Solutions
Its graphical representation is

Big Ideas Math Algebra 1 Student Journal 1st Edition Chapter 3 Graphing Linear Functions Exercise 3.6 Page 84 Exercise 2 Answer
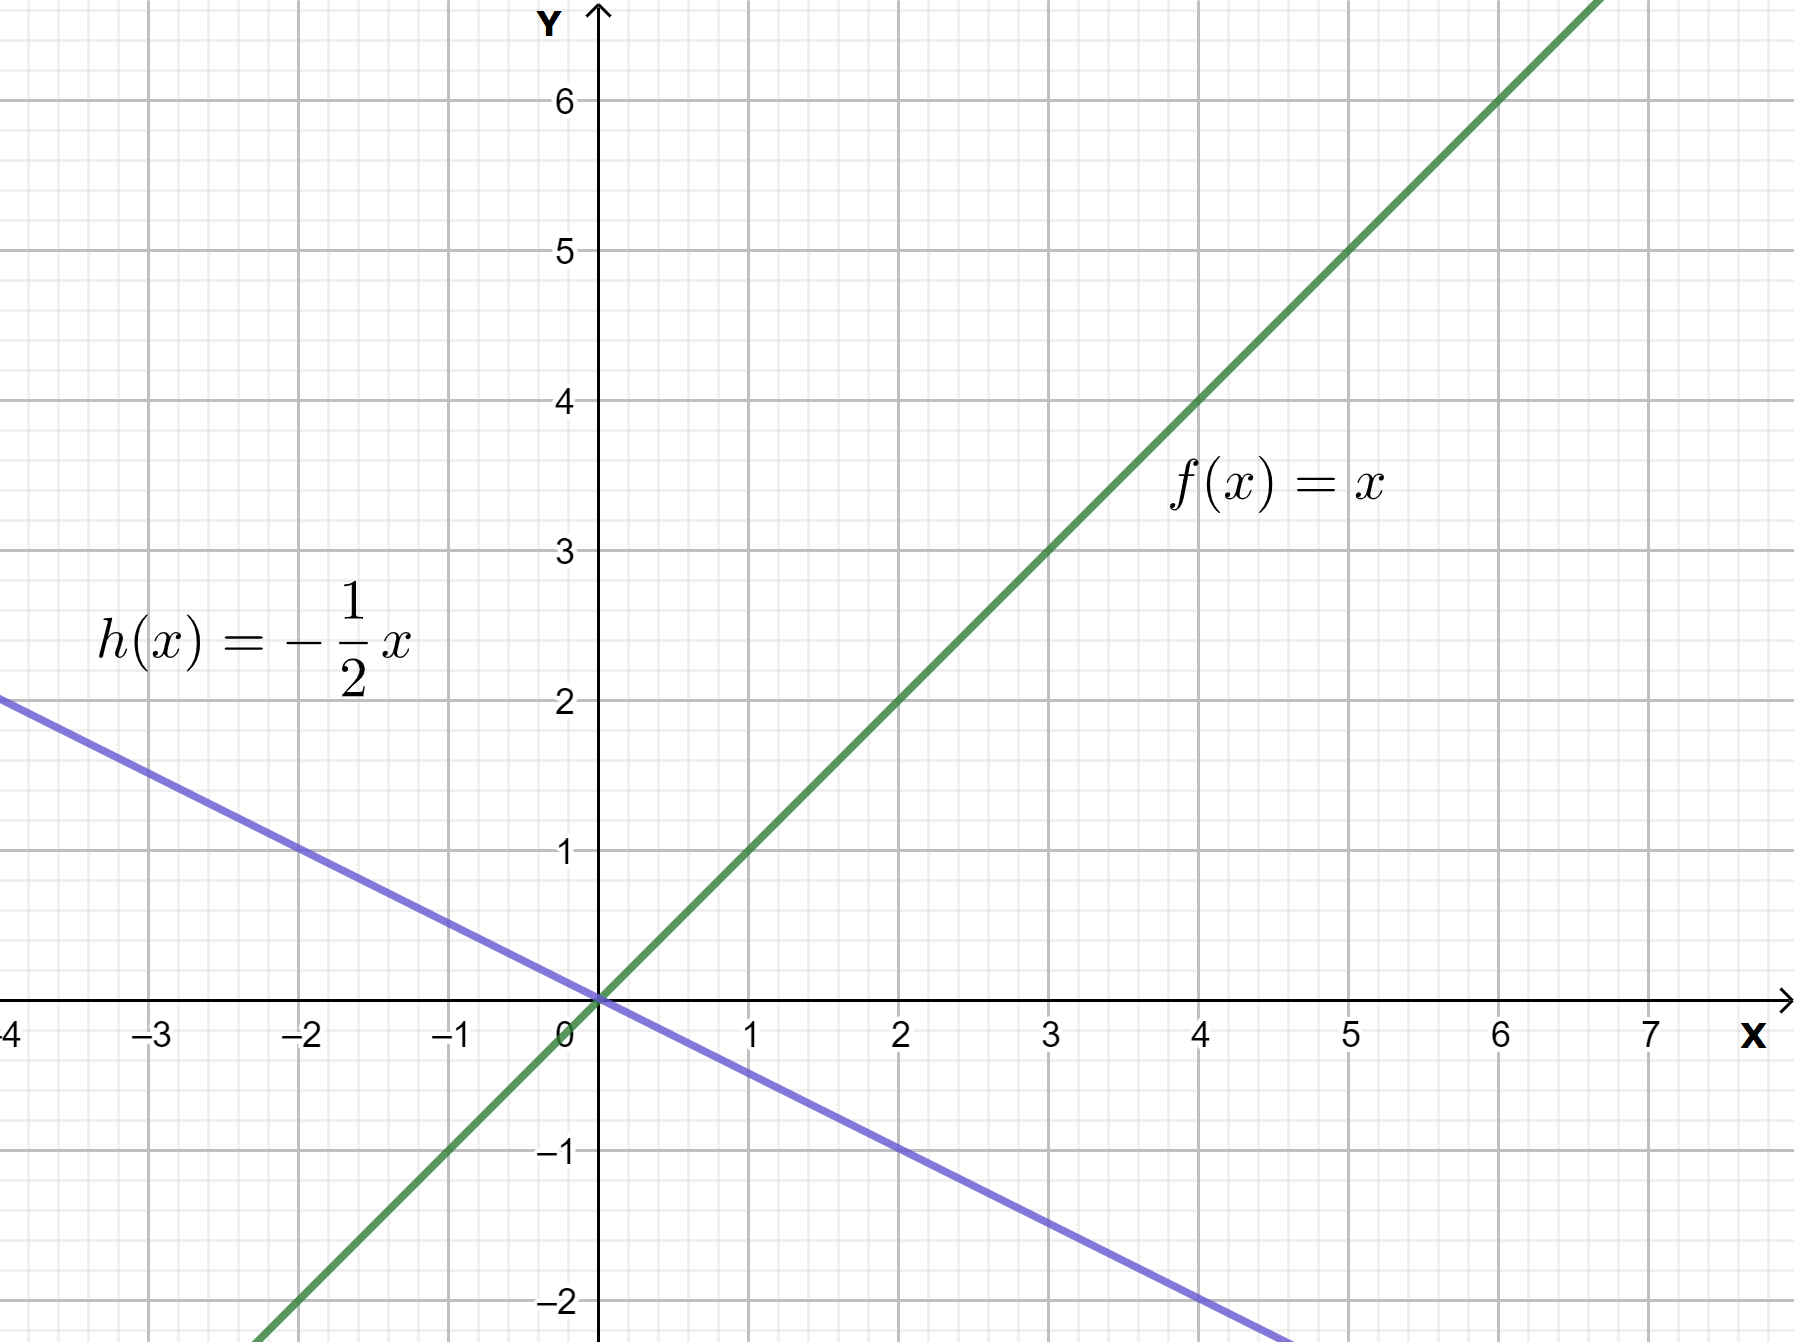
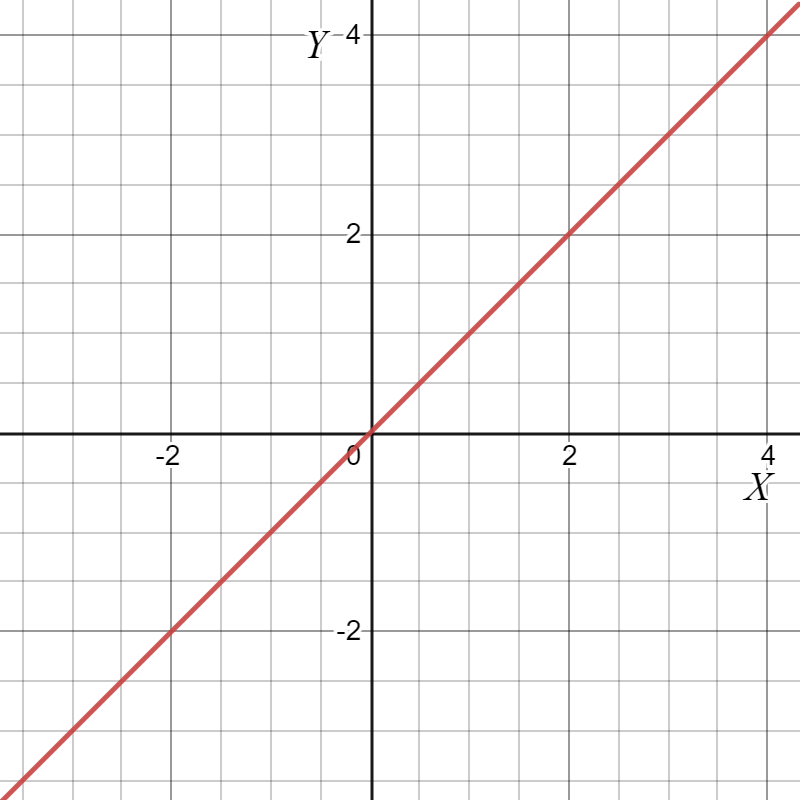
Given: Two functions are f(x)=x
h(x)\(=\frac{1}{2} x\).
To find The graph of each function on the same coordinate axes.
For finding the nature of the linear equations, let us draw the graphs.
The graphical representation of the functions f(x)=x and h(x)\(=\frac{1}{2} x\)

From the graph, it is clear that the lines f(x)=x and h(x)\(=\frac{1}{2} x\) intersect with each other. So, The lines have different slopes.
We can conclude the line equations f(x)=x and h(x) \(=\frac{1}{2} x\) intersect and have different slopes. Their graphical representation is

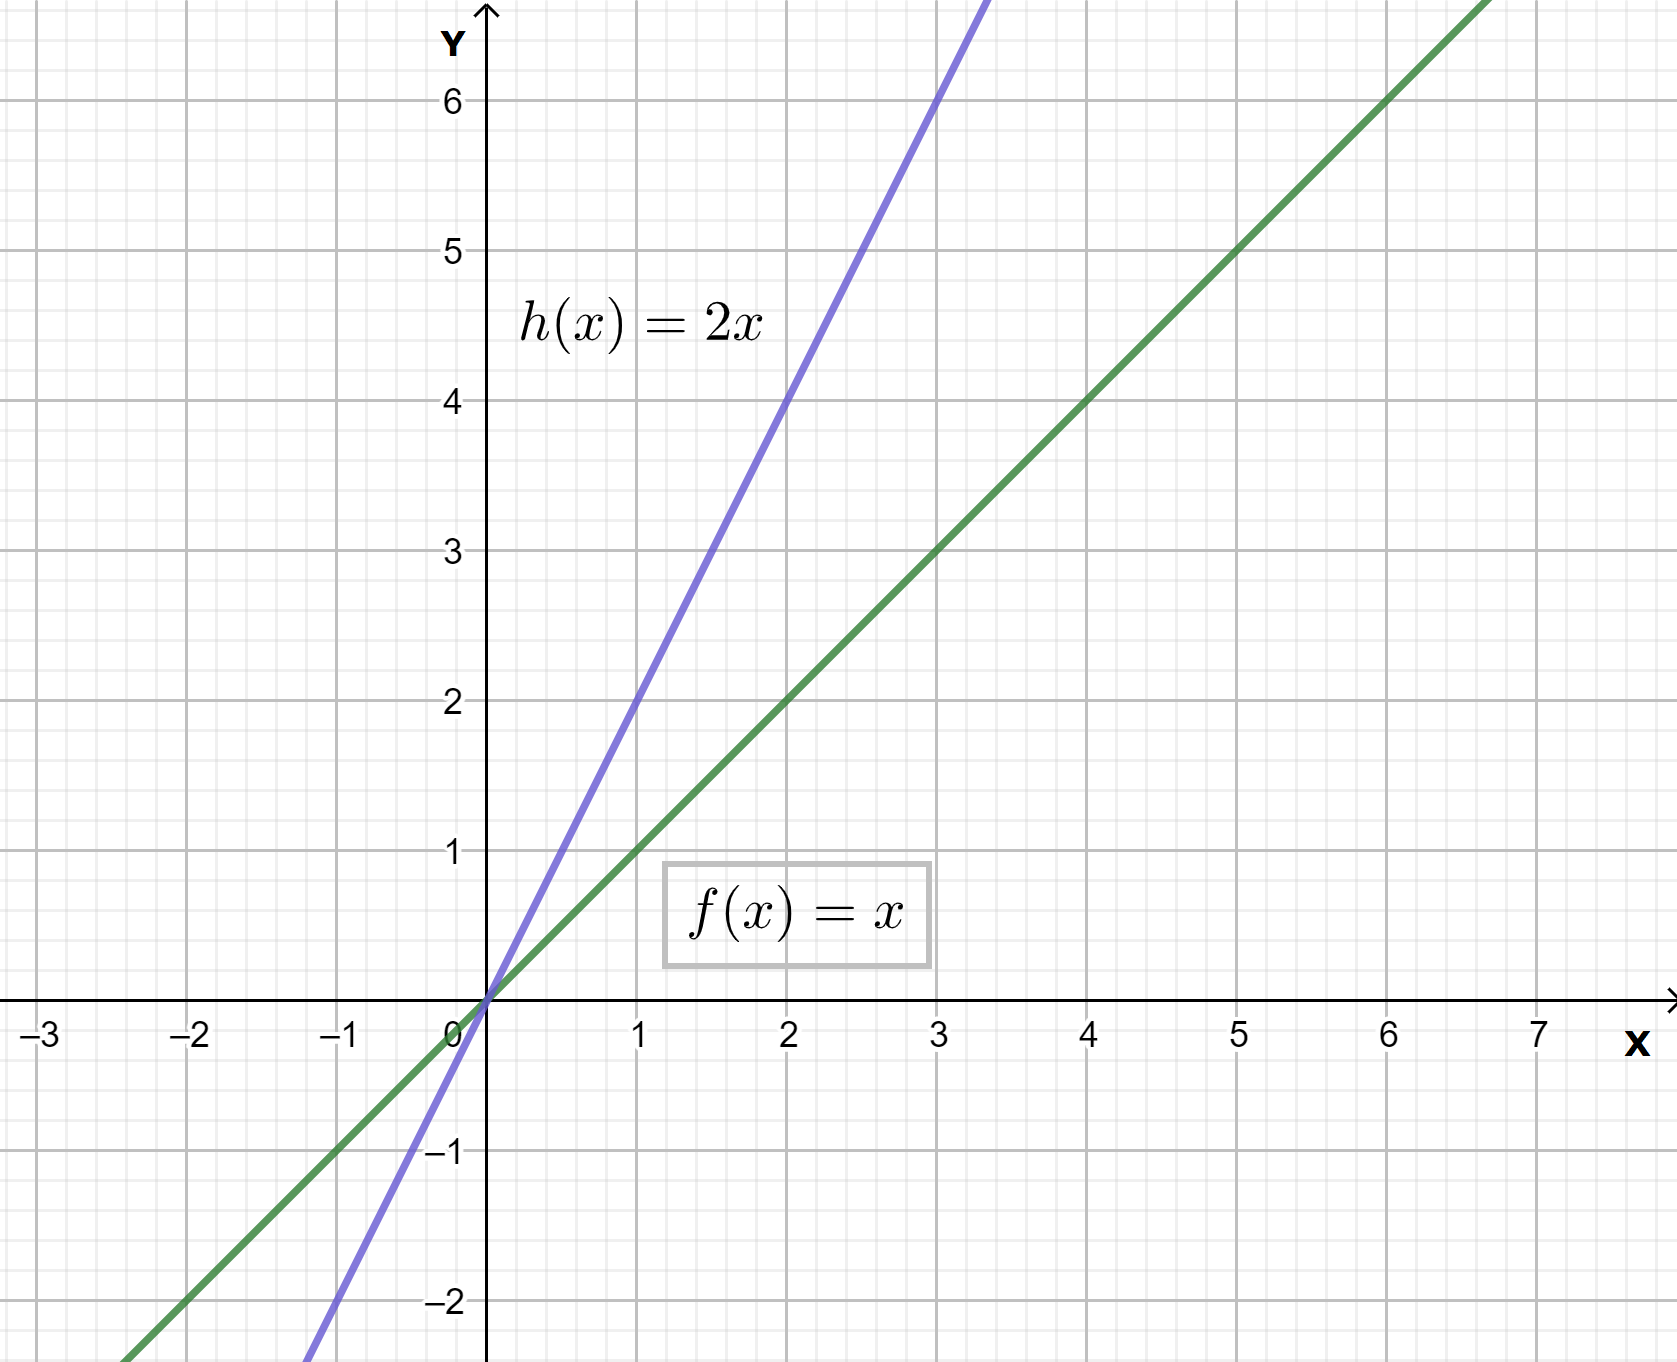
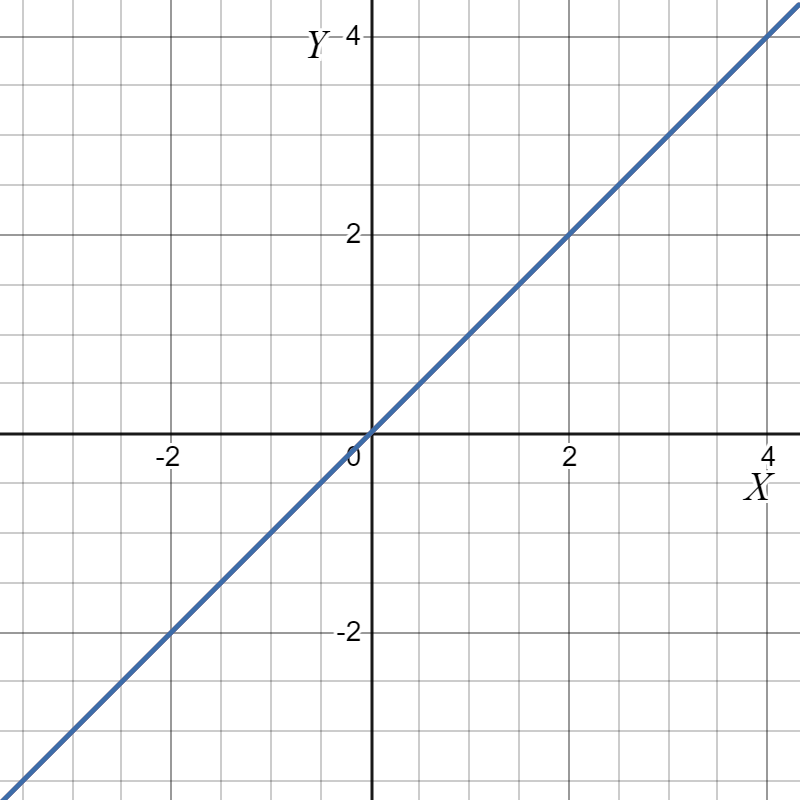
Given: Two functions are f(x)=x
h(x)=2x.
To find The graph of each function on the same coordinate axes.
For finding the nature of the linear equations, let us draw the graphs.
The graphical representation of the functions f(x)=x and h(x)=2x is
From the graph, it is clear that the lines f(x)=x and h(x)=2x intersect with each other. So, The lines have different slopes.
We can conclude the line equations f(x)=x and h(x)=2x intersect and have different slopes. Their graphical representation is
Given: Two functions aref(x)=x h(x)-\(=\frac{1}{2} x\).
To find The graph of each function on the same coordinate axes.
For finding the nature of the linear equations, let us draw the graphs.
The graphical representation of the functions f(x)=x and h(x)-\(=\frac{1}{2} x\) is
From the graph, it is clear that the lines f(x)=x and h(x)-\(=\frac{1}{2} x\) intersect with each other. So, The lines have different slopes.
We can conclude the line equations f(x)=x and h(x)-\(=\frac{1}{2} x\) intersect and have different slopes. Their graphical representation is

Given: Two functions f(x)=x h(x)=−2x.
To find The graph of each function on the same coordinate axes.
For finding the nature of the linear equations, let us draw the graphs.
The graphical representation of the functions f(x)=x and h(x)=−2x is
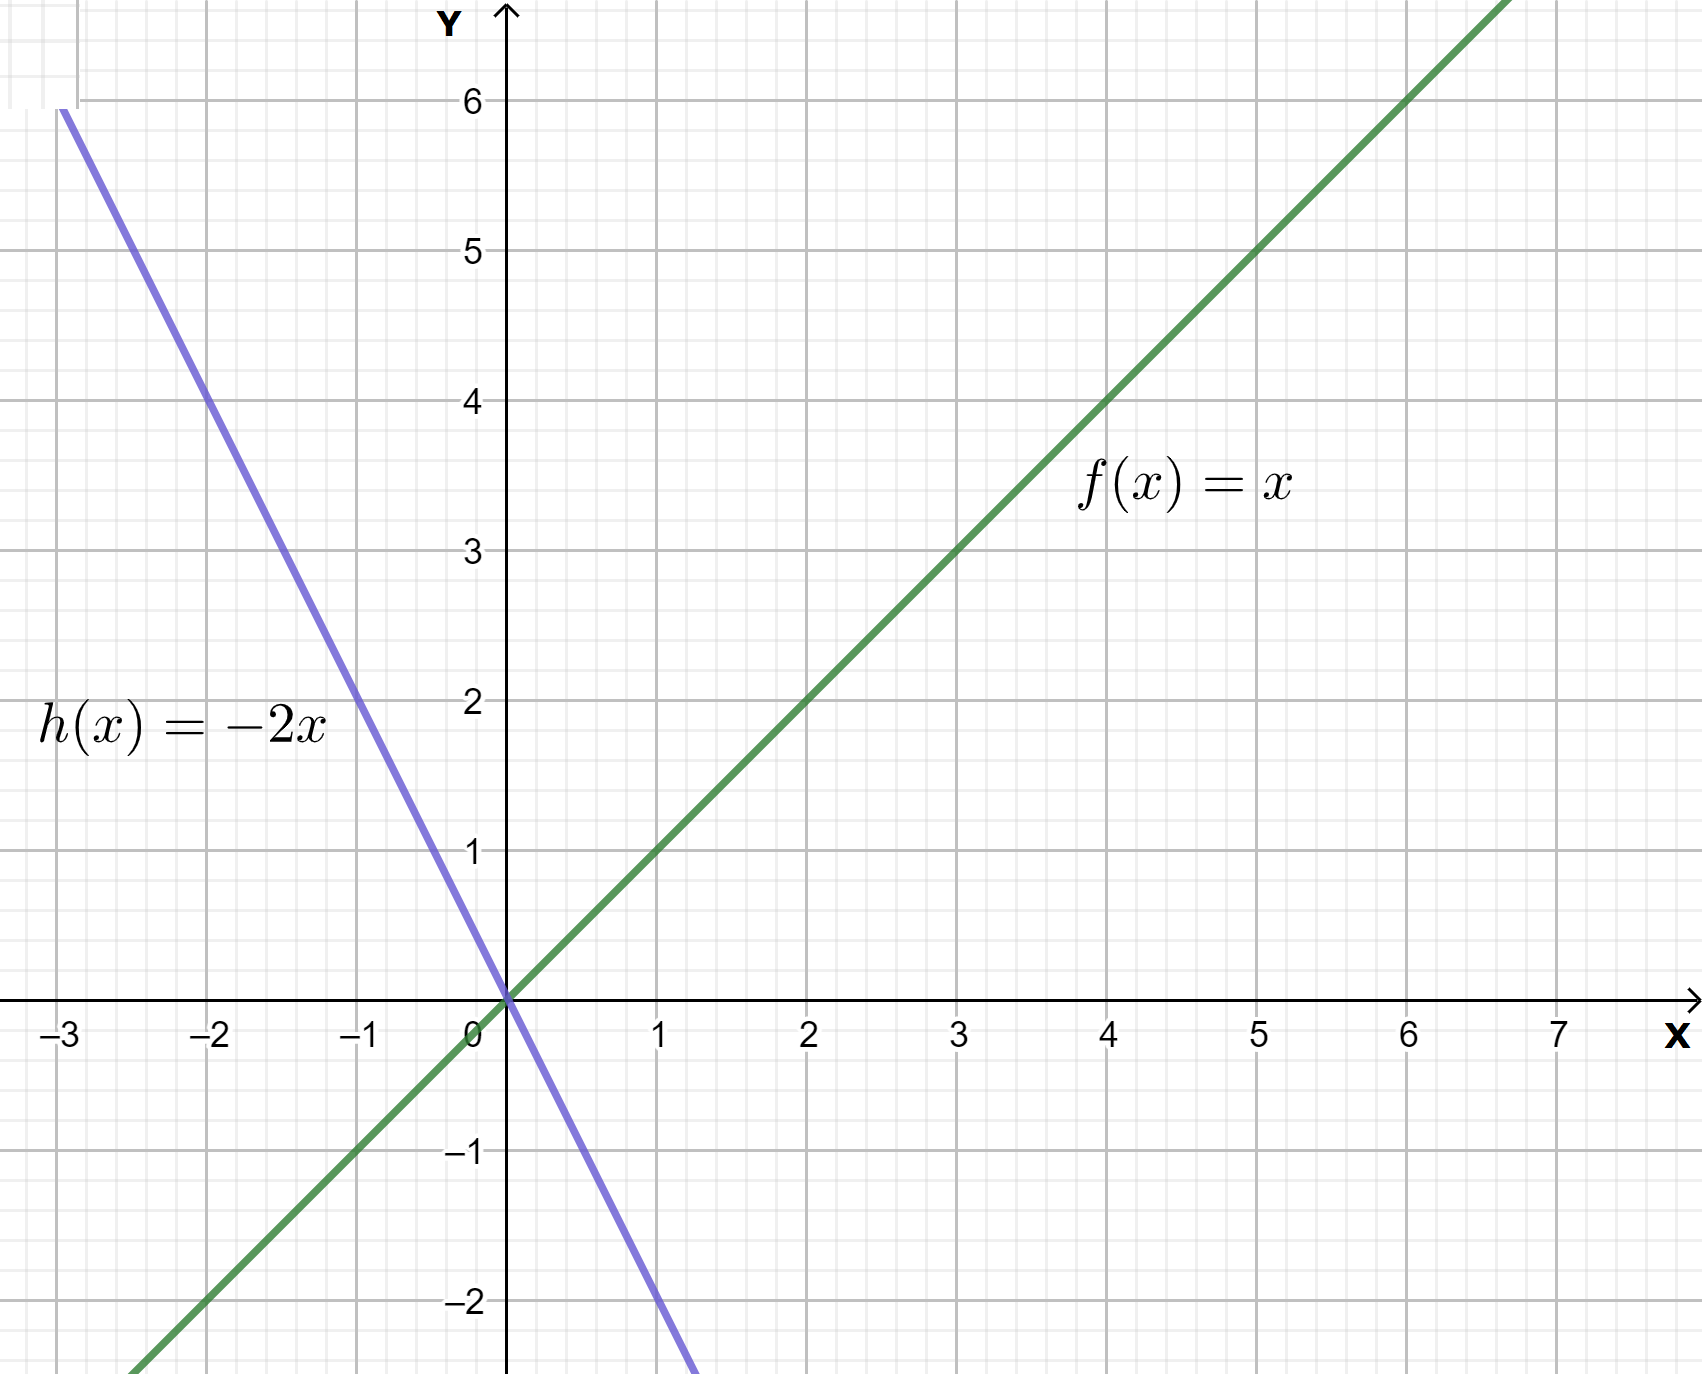
From the graph, it is clear that the lines f(x)=x and h(x)=−2x intersect with each other. So, The lines have different slopes.
We can conclude the line equations f(x)=x and h(x)=−2x intersect and have different slopes. Their graphical representation is

Big Ideas Math Algebra 1 Student Journal 1st Edition Chapter 3 Graphing Linear Functions Exercise 3.6 Page 85 Exercise 3 Answer
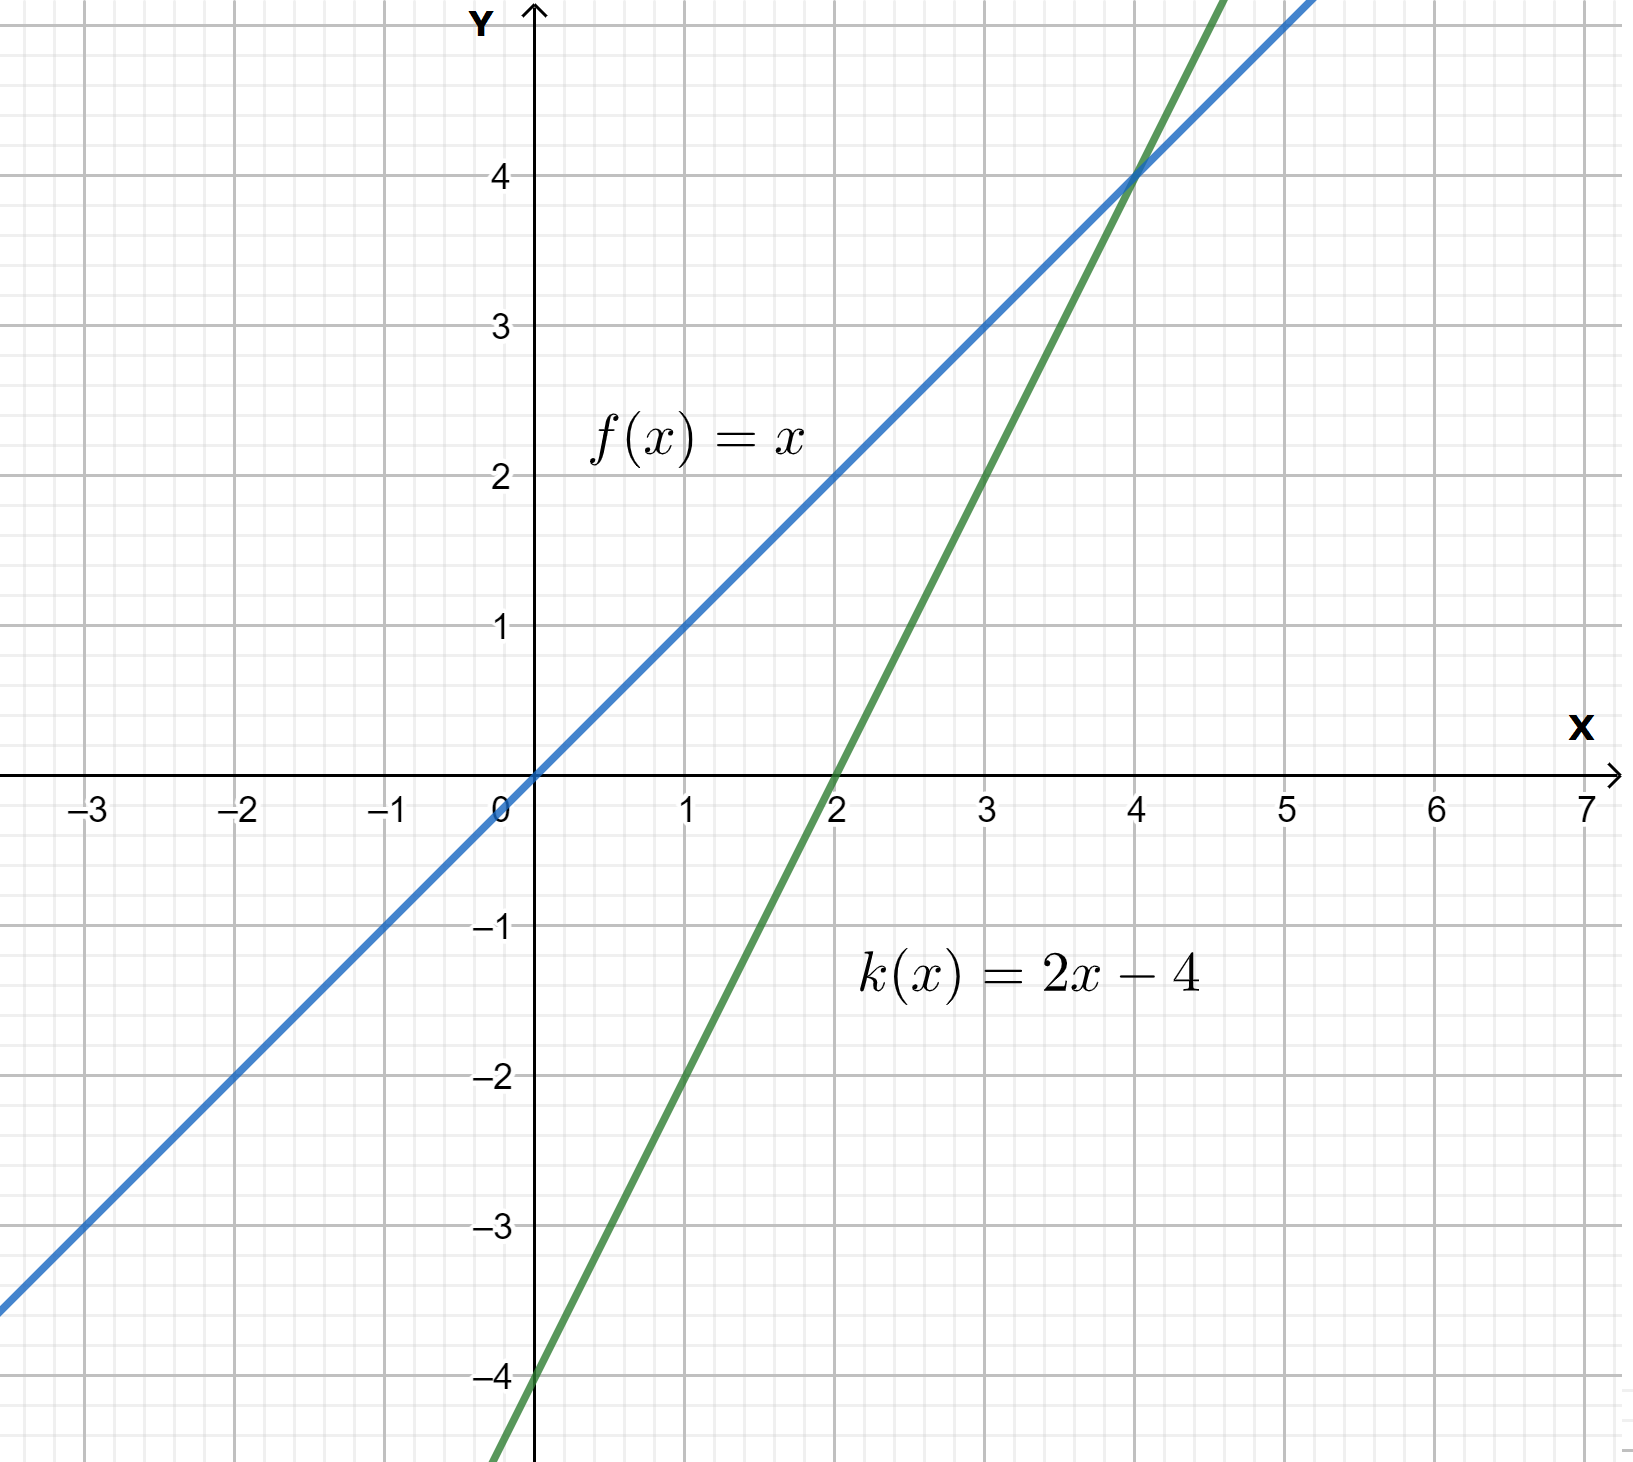
Given: Two functions f(x)=x k(x)=2x−4
To find The graph of each function on the same coordinate axes and which matches the given graphs.
For finding the nature of the linear equations, let us draw the graphs.
The graphical representation of the functions f(x)=x and k(x)=2x−4 is

From the graph, it is clear that the lines f(x)=x k(x)=2x−4 intersect with each other.
The graph of k(x)=2x−4. The graphical representation is
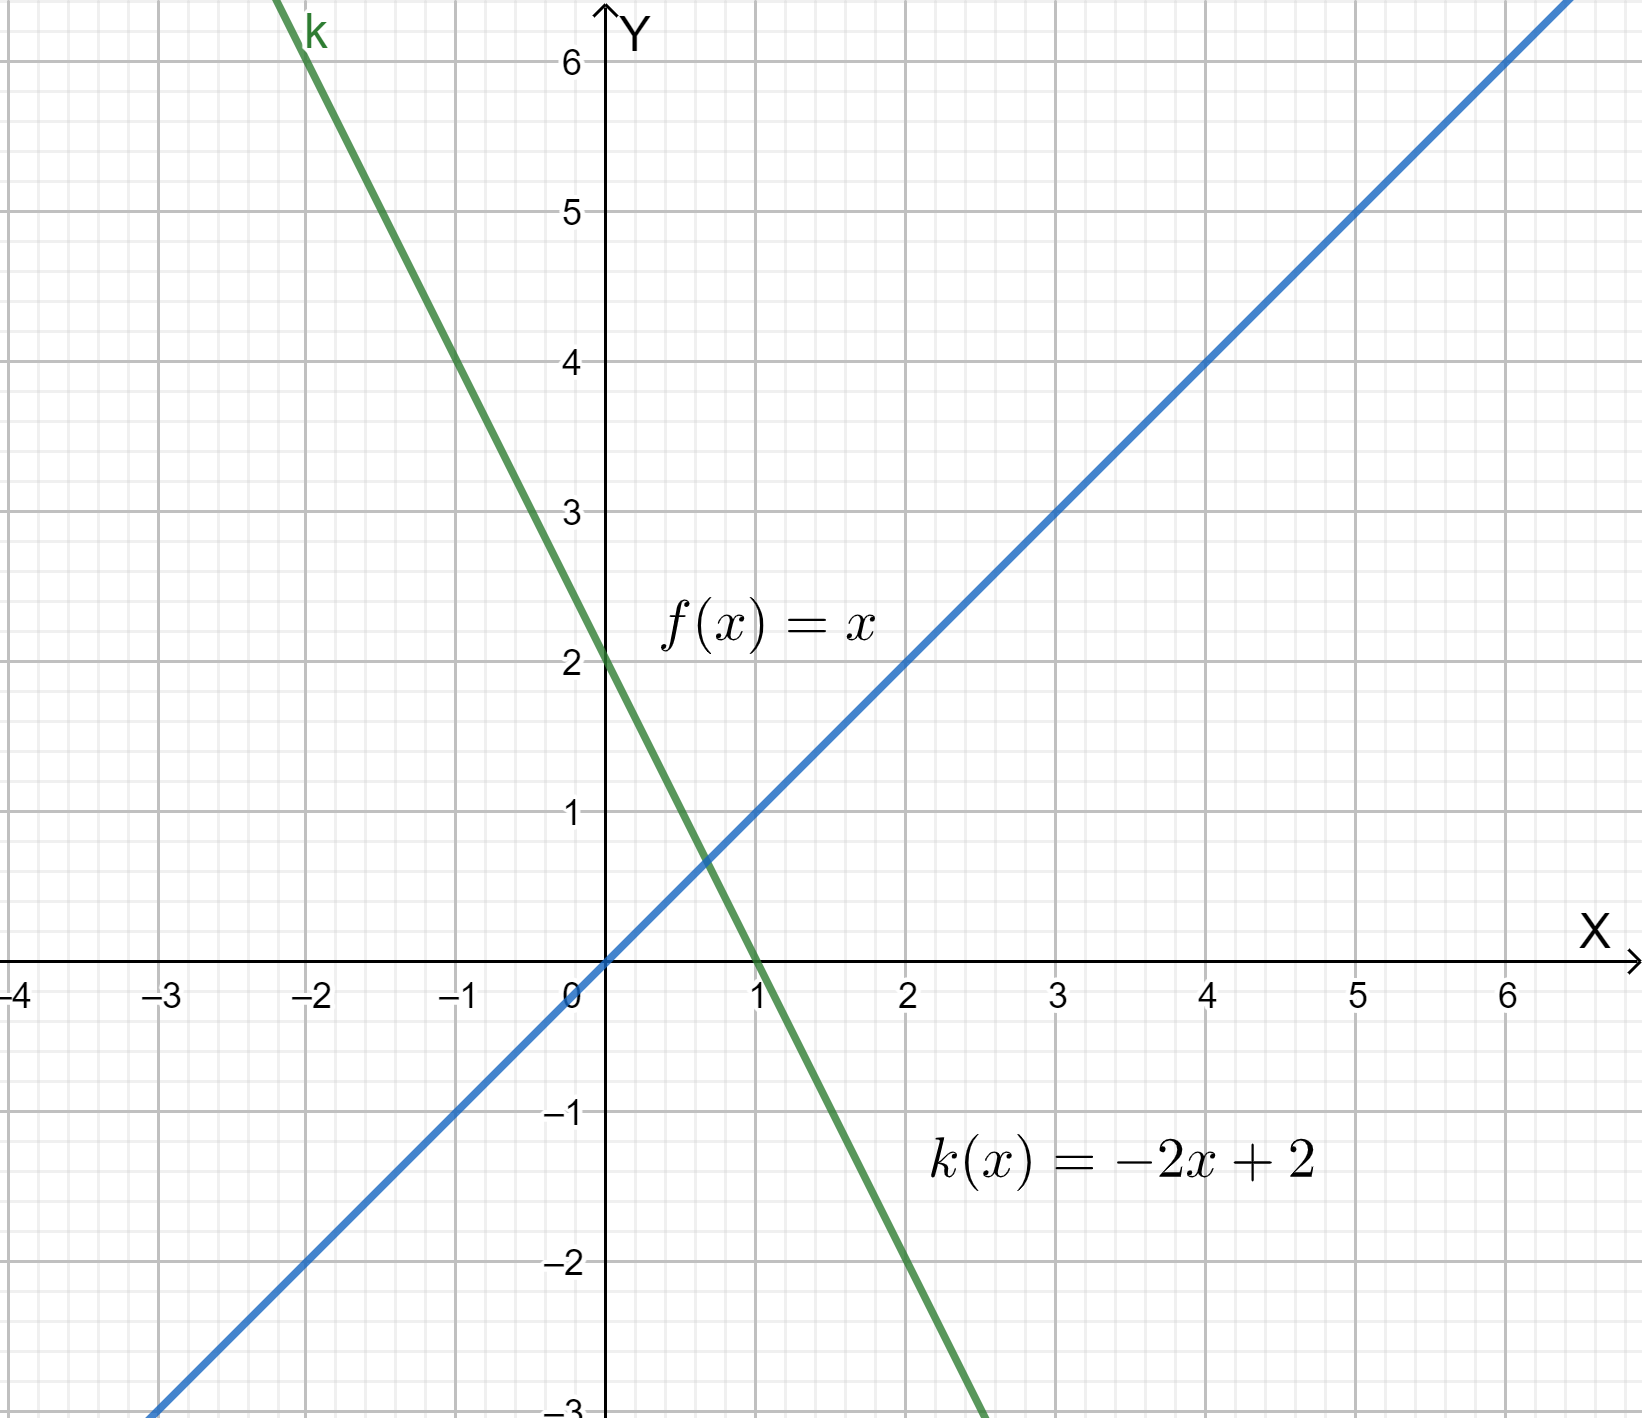
Given: Two functions f(x)=x k(x)=−2x+2.
To find The graph of each function on the same coordinate axes and which matches the given graphs in the options.
For finding the nature of the linear equations, let us draw the graphs.
The graphical representation of the functions f(x)=x and k(x)=−2x+2 is

From the graph, it is clear that the lines f(x)=x and k(x)=−2x+2 intersect with each other.
The graph of k(x)=−2x+2. The graphical representation is
Given: Two functions are f(x)=x k(x)\(=\frac{1}{2} x+4\).
To find The graph of each function on the same coordinate axes and which matches the given graphs in the options.
For finding the nature of the linear equations, let us draw the graphs.
The graphical representation of the functions f(x)=x and k(x)\(=\frac{1}{2} x+4\).
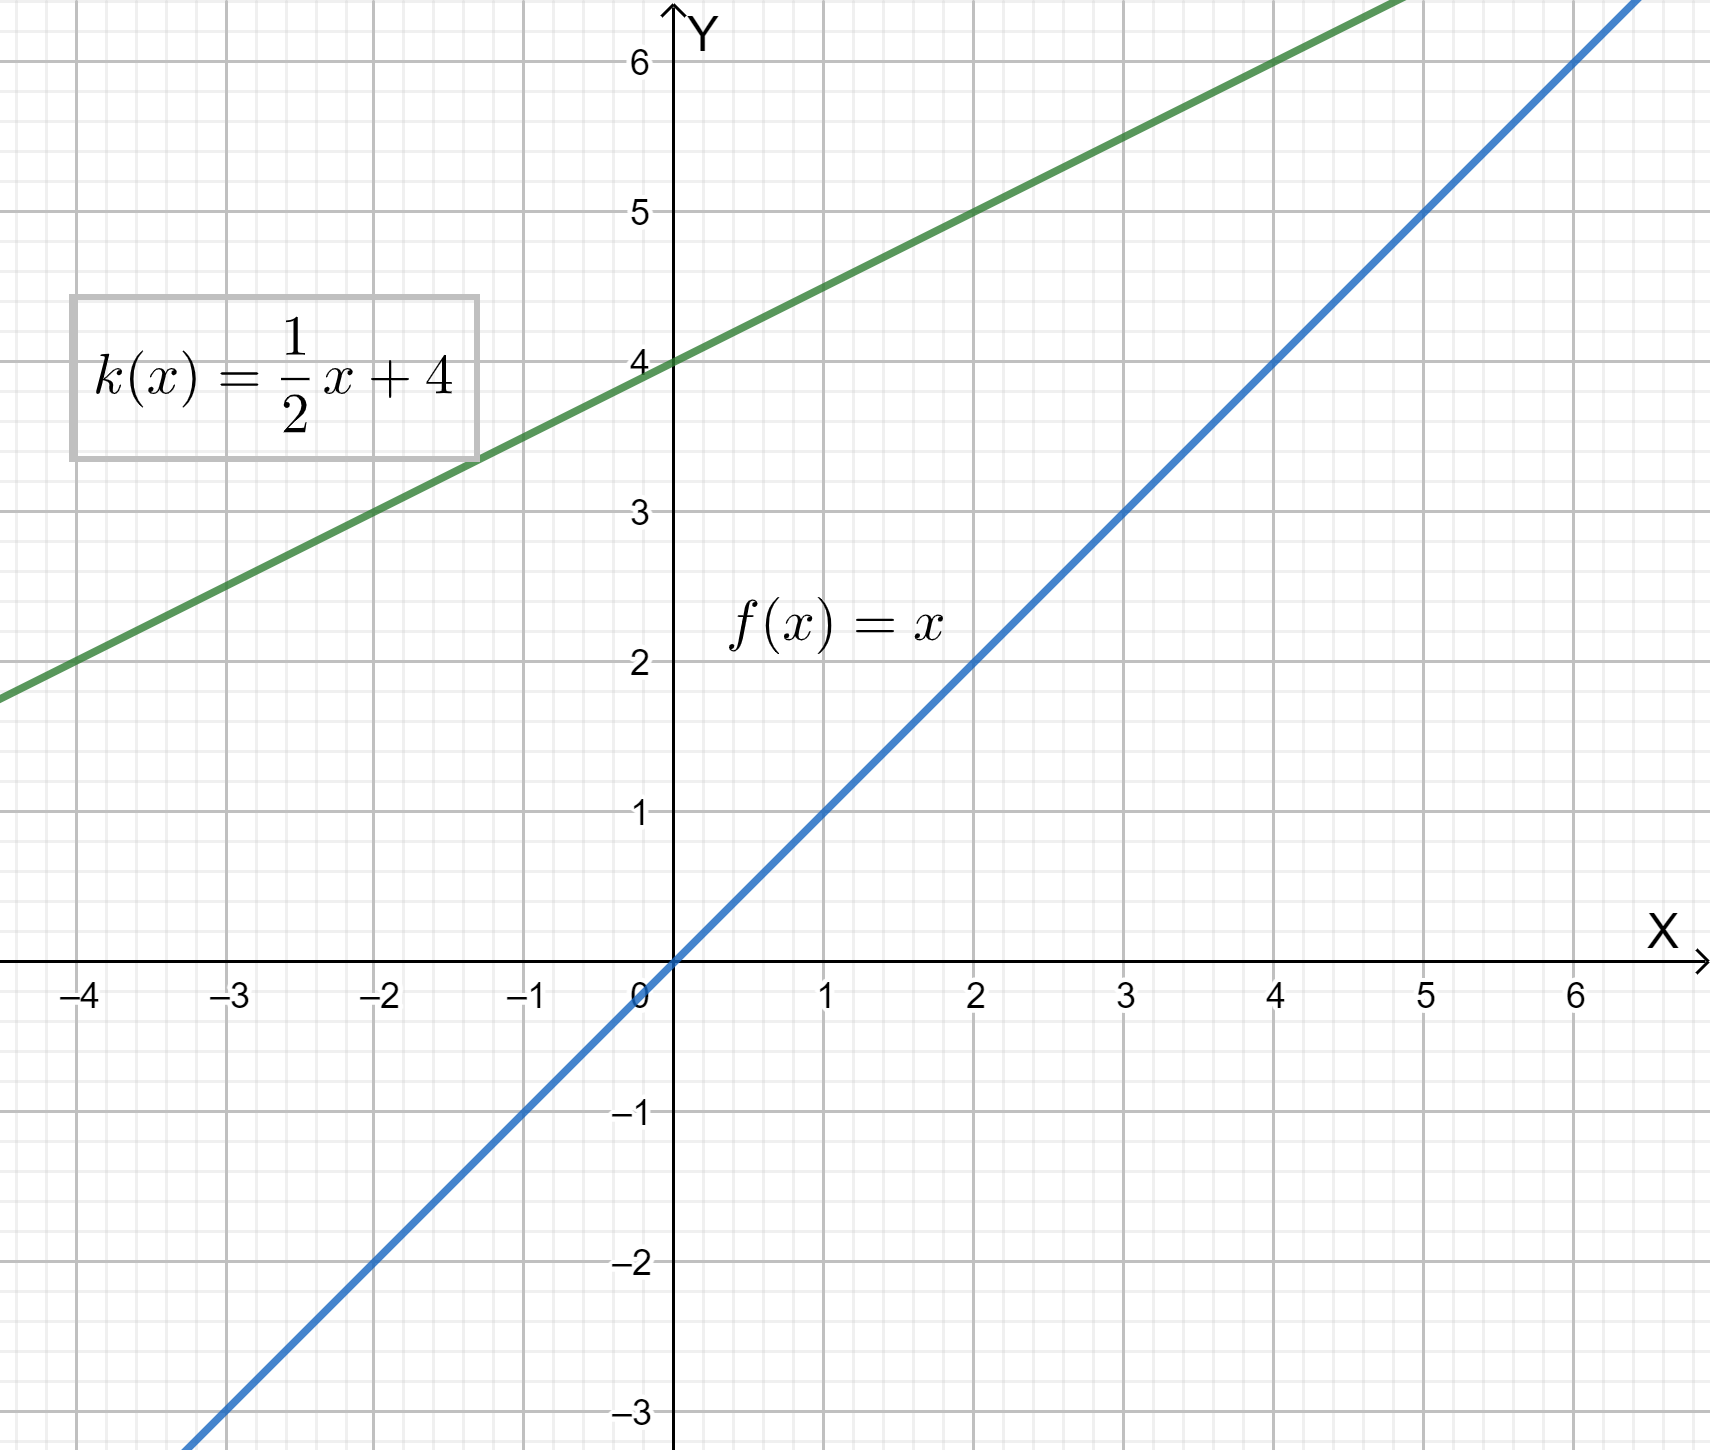
From the graph, it is clear that the lines f(x)=x and k(x)\(=\frac{1}{2} x+4\) intersect with each other.
The graph of k(x)\(=\frac{1}{2} x+4\) . The graphical representation is.

Given: Two functions are f(x)=x k(x)\(=\frac{-1}{2} x-2\).
To find The graph of each function on the same coordinate axes and which matches the given graphs in the options.
For finding the nature of the linear equations, let us draw the graphs.
The graphical representation of the functions f(x)=x and k(x)\(=\frac{-1}{2} x-2\) is.
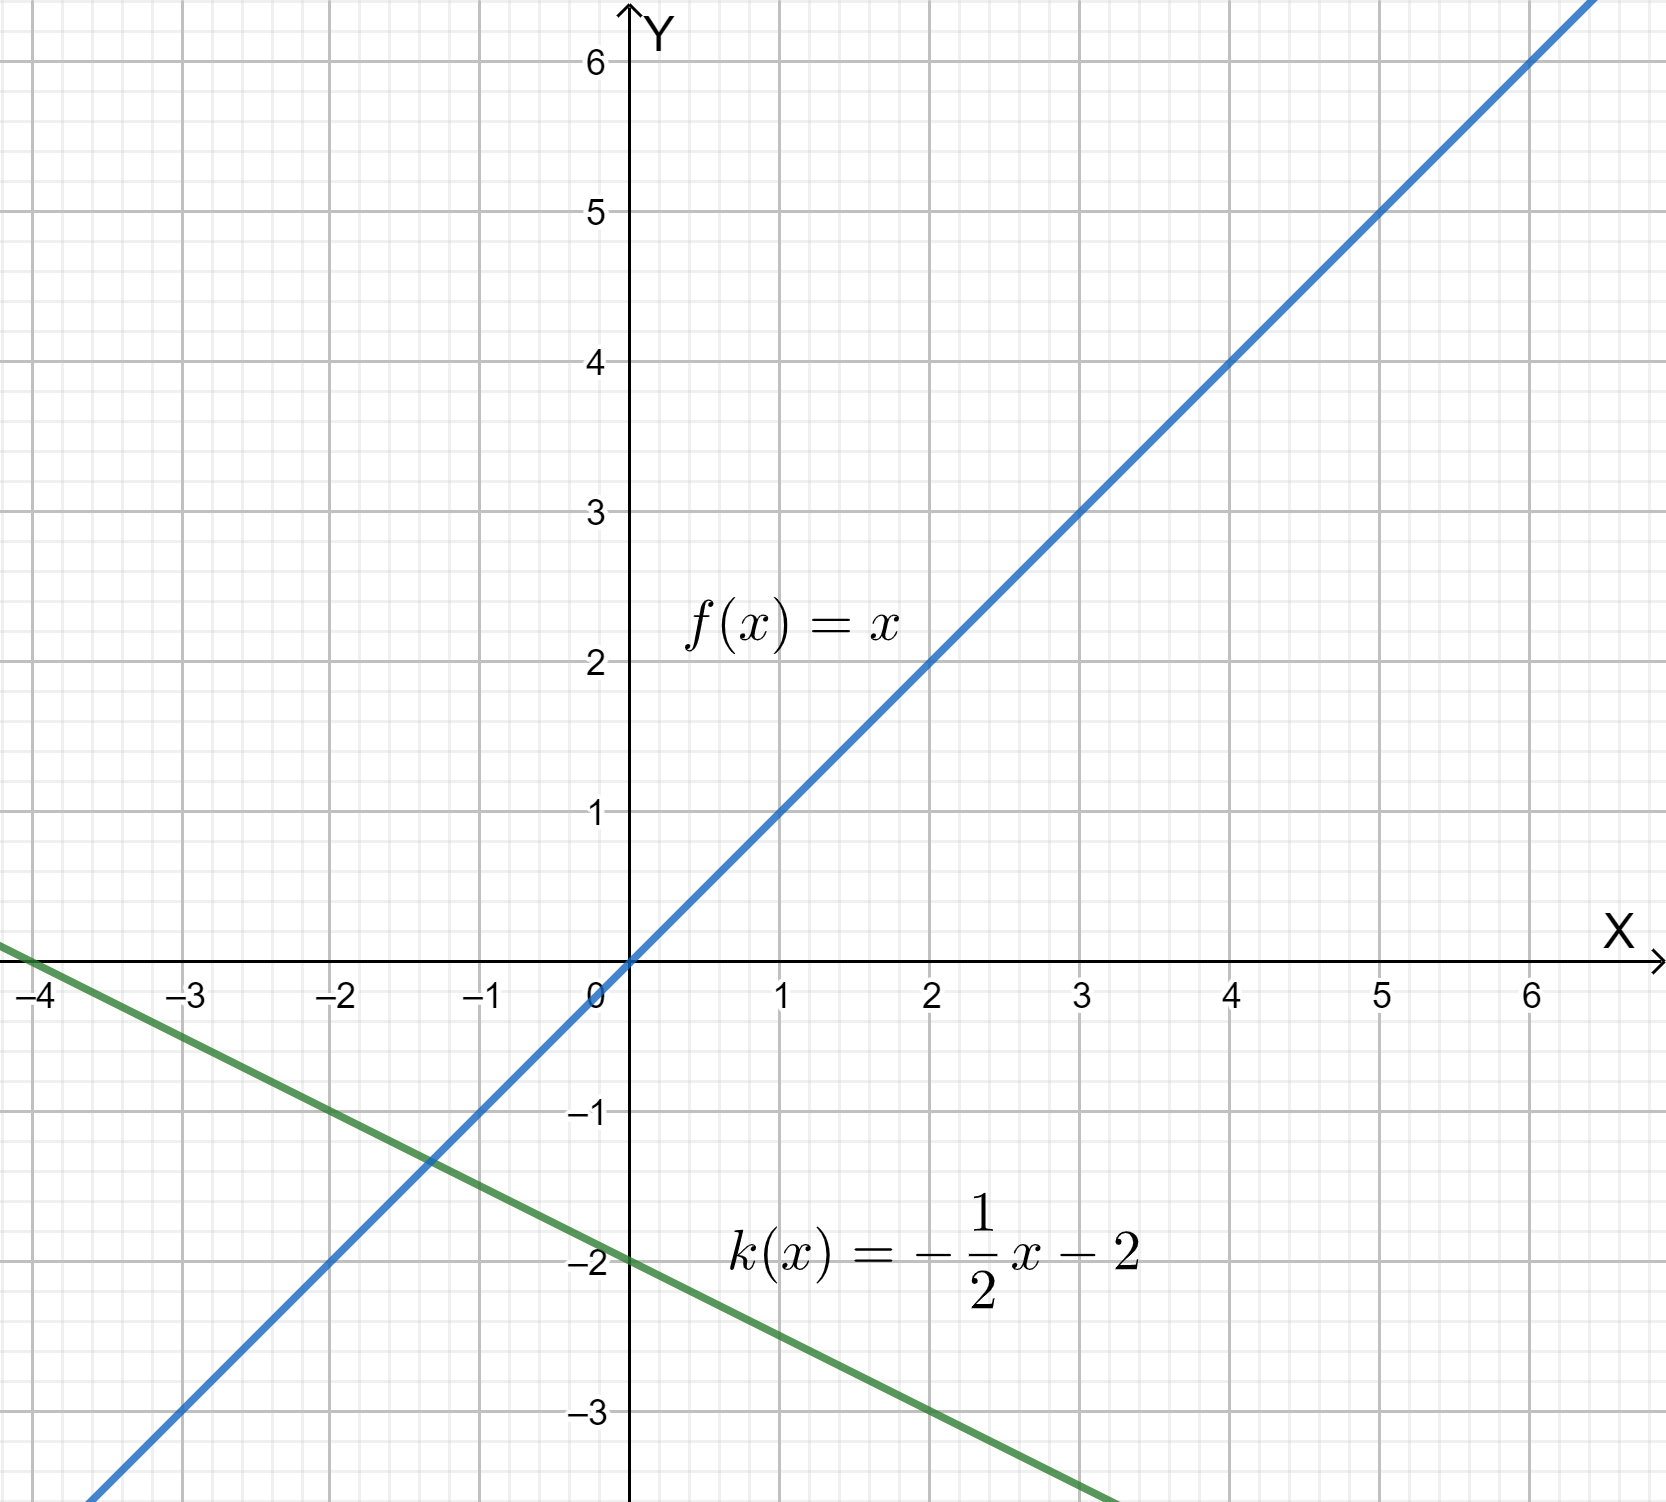
From the graph, it is clear that the lines f(x)=x and k(x)=−2x+2 intersect with each other.
The graph of k(x)\(=\frac{-1}{2} x-2\) . The graphical representation is

Big Ideas Math Algebra 1 Student Journal 1st Edition Chapter 3 Graphing Linear Functions Exercise 3.6 Page 85 Exercise 4 Answer
Given: linear function f(x)=x compare to the graphs of
g(x)=f(x)+c
h(x)=f(Cx)
To find how the graph of the linear function f(x)=x compares to the graphs of
g(x)=f(x)+c
h(x)=f(Cx) and
Use the given equations to draw the graphs.
Graphing the linear function f(x)=x.
Graphing g(x)=f(x)+c
And h(x)=f(cx)

As we can see in all three graphs the graphs results are the same. So, all three equations are having same results.
The linear function f(x)=x while comparing to the graphs of g(x)=f(x)+c and h(x)=f(cx)
The result we get after graphing is the same.

f(x)=x

g(x)=f(x)+c
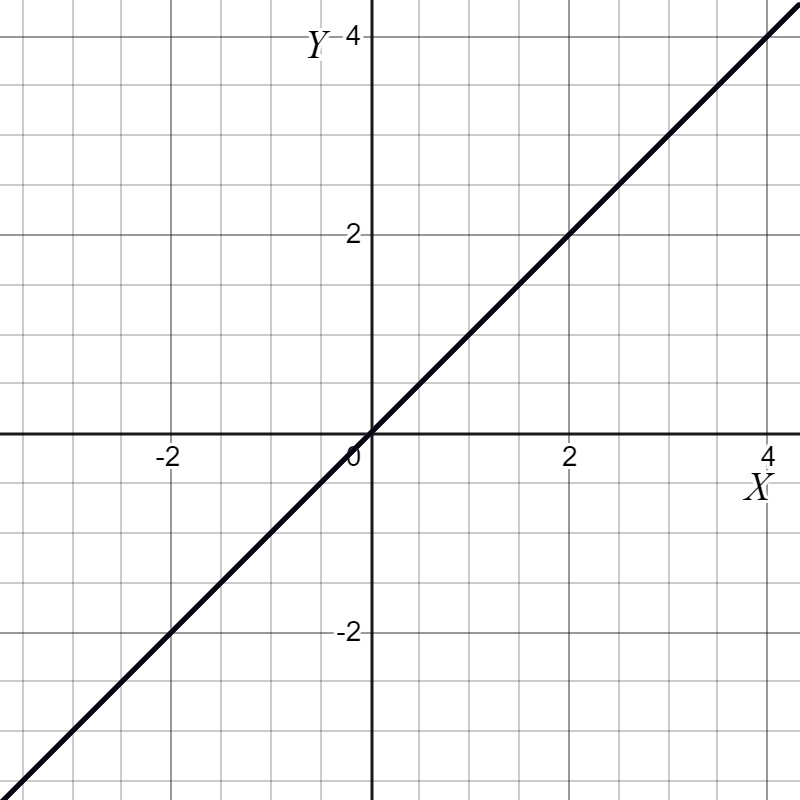
h(x)=f(cx)
Page 89 Exercise 2 Answer
Given:

To find Describe the transformation from the graph of f to the graph of g.
Use the given data.
Given graph
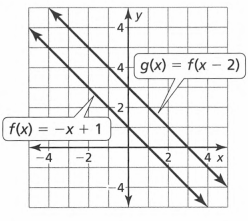
The functions are f(x)=−x+1 and g(x)=f(x−2)
Put function f(x)=−x+1 in function g(x).
So we get g(x)=f(x−2)
=f(x)−f(2)…………..(1)
Put x=2 in f(x)=−x+1
f(2)=−2+1
=−1
Put value of f(x) and f(2) in equation (1) , we get
g(x)=−x+1−(−1)
=−x+1+1
g(x)=−x+2
The graph g(x)=f(x−2) is the vertical translation of graph f(x).
Now, since the slopes are the same, the lines are parallel.
If I take f(x) and translate it up 2 units on the y-axis, I would have g(x) .
The Function g(x)=−x+2 is the transformation from the graph of f to the graph of g.
The Function g(x)=−x+2 is the transformation from the graph of f to the graph of g.
Big Ideas Math Algebra 1 Student Journal 1st Edition Chapter 3 Graphing Linear Functions Exercise 3.6 Page 89 Exercise 3 Answer
Given:

To find Describe the transformation from the graph of f to the graph of g.
Use the given graph and given equations, to solve.
Given graph
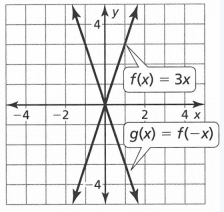
The functions are f(x)=3x and g(x)=f(−x)
Put x=−x in function f(x)=3x , f(−x)=−3x
Put f(−x)=−3x in g(x)
g(x)=−3x
The graph g(x)=f(−x) is the horizontal translation of graph f(x).
Now, since the slopes are not the same, the lines are not-parallel they are crossing each other at point(0,0).
If I take f(x) and translate it Up to 2 units and down−2 units on the x-axis, I would have g(x).
The Function g(x)=−3x is the transformation from the graph of f to the graph of g.
The Function g(x)=−3x is the transformation from the graph of f to the graph of g.
Big Ideas Math Algebra 1 Student Journal 1st Edition Chapter 3 Graphing Linear Functions Exercise 3.6 Page 89 Exercise 4 Answer
Given: The graphs of the functions as
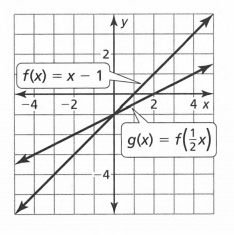
The function is, g(x)\(=f\left(\frac{1}{2} x\right)\)
\(=\frac{1}{2} x-1\)
We first add the positive number one to the function f(x)=x−1 so the graph is vertically shifted upward by one unit which is the graph of y=x.
Now to this function, we multiply a positive term \(\frac{1}{2}\)<1 so that the current graph is compressed vertically by a factor of \(\frac{1}{2}\)<1 unit giving us the graph of \(y=\frac{x}{2}\). Add the negative number −1 to it so that the graph is vertically shifted downward by one unit giving us the graph of g(x)\(f\left(\frac{x}{2}\right)\)
The given graphs of the functions are as shown.

The function is g(x)=\(f\left(\frac{x}{2}\right)\)
\(=\frac{x}{2}-1\)
The graph of f(x)=x−1 is vertically shifted upward by one unit which is then compressed vertically by a factor of \(\frac{1}{2}\) and finally vertically shifted downward by one unit giving us the graph of g(x)=\(f\left(\frac{x}{2}\right)\)
Page 89 Exercise 5 Answer
Given:

To find Describe the transformation from the graph of f to the graph of g.
Use the given data.
Given graph
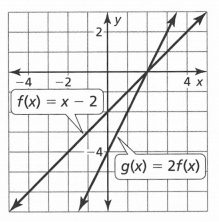
The functions are f(x)=x−2 and g(x)=2f(x)
Put f(x)=x−2 in g(x)
So we get, g(x)=2(x−2)
g(x)=2x−4
The graph g(x)=2f(x) is the horizontal translation of graph f(x).
Now, since the slopes are not the same, the lines are not parallel they are crossing each other at point (2,0) .
If I take f(x) and translate it up by-1 unit on the x-axis and down by−2 units on the y-axis, I would have g(x).
The Function g(x)=2x−4 is the transformation from the graph of f to the graph of g.
The function g(x)=2x−4 is the transformation from the graph of f to the graph of g.
Big Ideas Math Algebra 1 Student Journal 1st Edition Chapter 3 Graphing Linear Functions Exercise 3.6 Page 89 Exercise 7 Answer
Given:f(x)=x and g(x)=3x−2
To find Sketch the graph of the equation.
Use the given data.
Given equations,f(x)=x and g(x)=3x−2 Sketching the graph of the above equations using ‘The DESMOS’ Graphing Calculator is
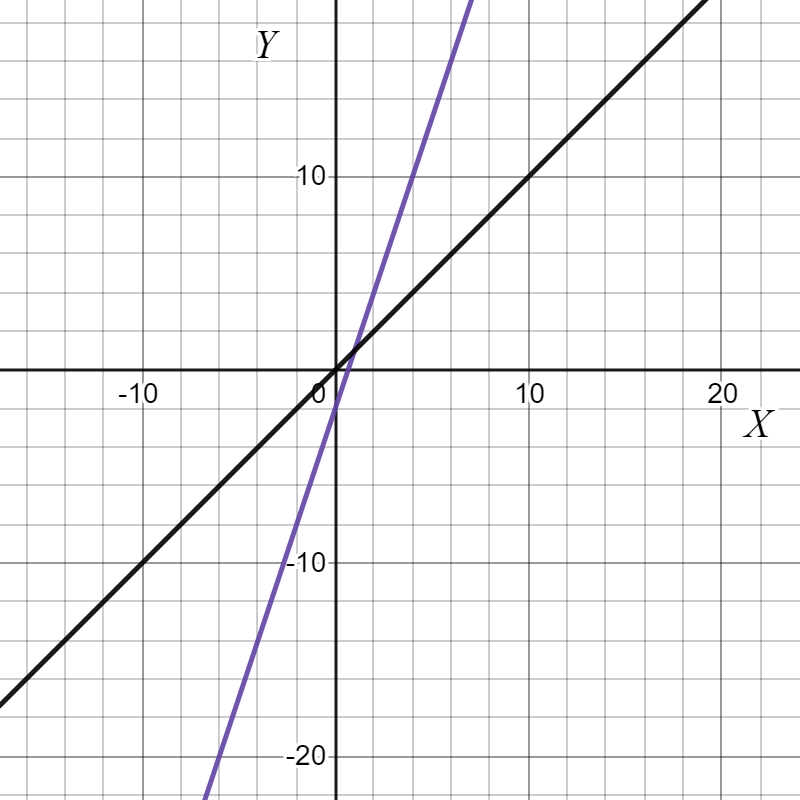
Black line is f(x)=x , Purple line is g(x)=3x−2
Both the lines cross each other at points (1,1).
The graph g(x)=3x−2 is the vertical translation of graph f(x).
Now, since the slopes are not the same, the lines are not parallel to each other.
If I take f(x) and translate it up−2 and down−2 units on the y-axis, I would have f(x).
And the transformation in equation g(x)=3x−2.
putx=f(x) in the g(x) equation.
g(x)= 3 f(x)-2.
The transformation is g(x)=3f(x)−2 and graph of the equations f(x)=x and g(x)=3x−2 is
