
Big Ideas Math Algebra 1 Student Journal 1st Edition Chapter 3 Graphing Linear Functions Exercise 3.5
Page 79 Essential Question Answer
The graph of the line y=mx+b is a straight line with slope m passing through the point (0,b) as b is the y-intercept.
For example: y=x+2 has a slope and passes through the point (0,2).
x=2⇒
y=2+2
=4
(2,4) is another point on the line.
The graph of the linear equation y=mx+b is a straight line with slope m and the y-intercept as b. The line passes through the point (0,b).
Page 79 Exercise 1 Answer
The given graph is

The equation of the graph is \(y=\frac{2}{3} x+2\), which is of the slope-intercept form. The coefficient of x is the slope of the line and the constant term is the y-intercept. Therefore,
The slope of the line is \(\frac{2}{3}\) The intercept is 2.
Also from the graph, it can verify that the y-coordinate of the point that intersects the y-axis is 2, which is the y-intercept.
The graph of the line is as follows
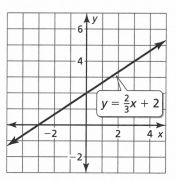
The slope of the line,\(y=\frac{2}{3} x+2\) is \(\frac{2}{3}\)and the y intercept is 2.
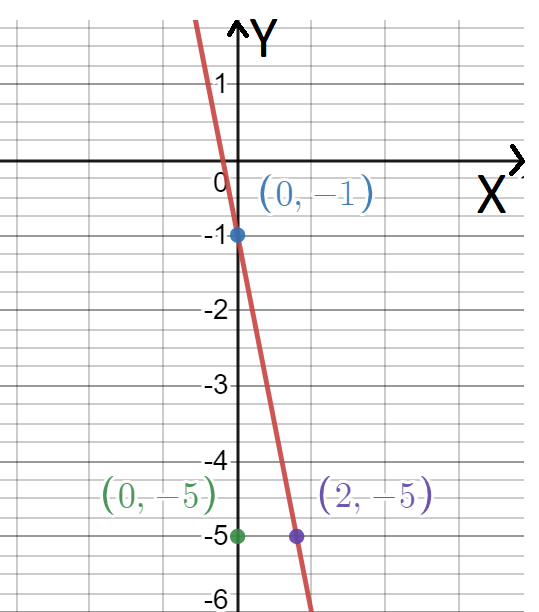
In the question, the straight line is given as y=−2x−1, and the graph of the straight line is also given. We have to find the slope and y-intercept of the straight line. We are going to use the formula for slope to verify the result.
The given equation of the straight line is y=−2x−1.
By comparing with the equation of the straight line y=mx+c, we see that
The slope of the straight line is−2 and the y-intercept is−1.
Now, from the graph, we can see that the y-intercept of the straight line is−1.
Again, in the graph, the rise and the run of the straight line is shown in the given graph as follows
 |
|
Therefore, considering the points(0,−1) and(2,−5), the slope of the straight line is calculated as follows
Slope\(=\frac{\text { rise }}{\text { run }}\)
=-2
The slope and y-intercept of the line y=−2x−1 are−2 and−1, respectively, these are also verified from the following graph

Big Ideas Math Algebra 1 Chapter 3 Exercise 3.5 Solution
Big Ideas Math Algebra 1 Student Journal 1st Edition Chapter 3 Graphing Linear Functions Exercise 3.5 Page 79 Exercise 2 Answer
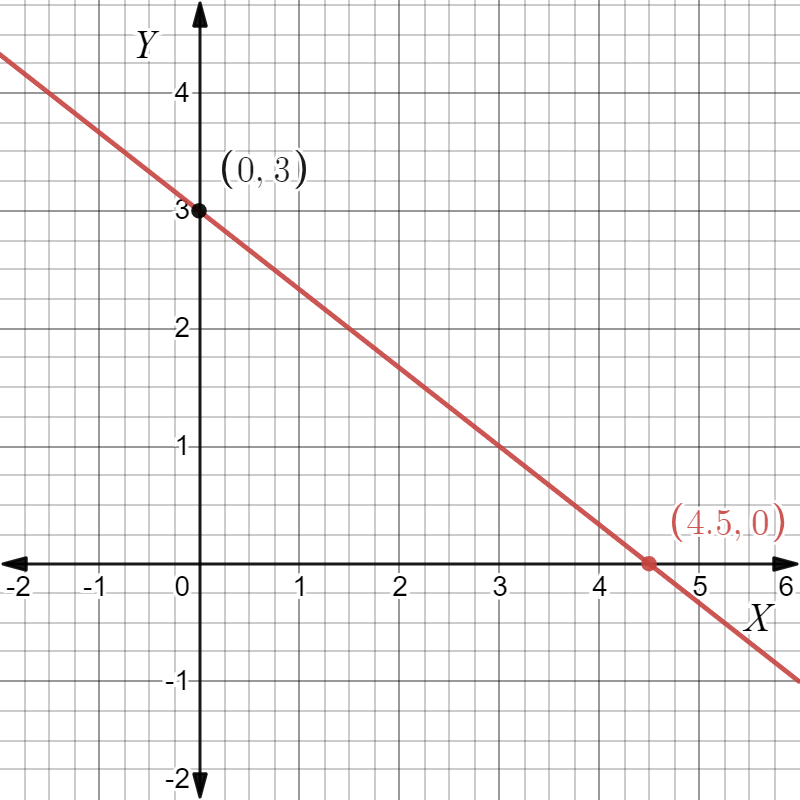
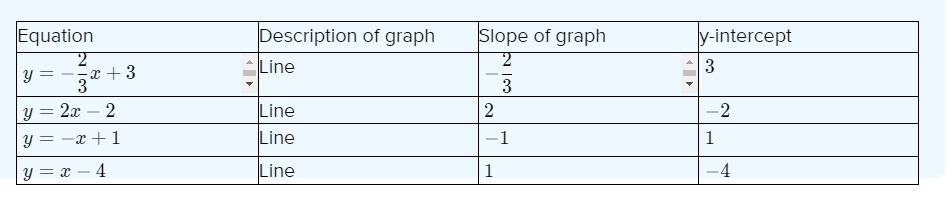
In the question, the given equation is \(y=-\frac{2}{3} x+3\)
We have to determine the slope and y-intercept of the line.
We are going to use the formula for the slope.
The graph of the line is as follows

From the graph, we see that the line crosses the y-axis at point(0,3), whose y-coordinate is 3.
Therefore, the y-intercept of the line is 3.
In the graph, by considering two points(0,3) and(4.5,0), the slope of the line is calculated as follows
Slope\(\frac{\text { rise }}{\text { run }}\)
\(=\frac{3-0}{0-4.5}\) \(=\frac{3}{-4.5}\) \(=-\frac{30}{45}\)\(=-\frac{2}{3}\).
The slope and y-intercept of the line \(y=\frac{2}{3} x+2\) are \(\frac{2}{3}\) and 3, respectively, which are obtained from the following graph
Putting the values in the table, we get
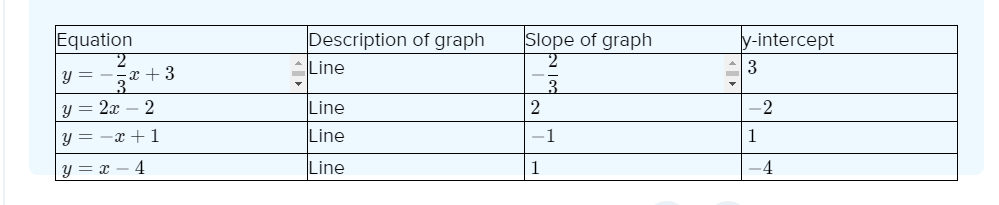
In the question, the given equation is y=2x−2.
We have to determine the slope and y-intercept of the line.
We are going to use the formula for the slope.
The graph of the line is as follows
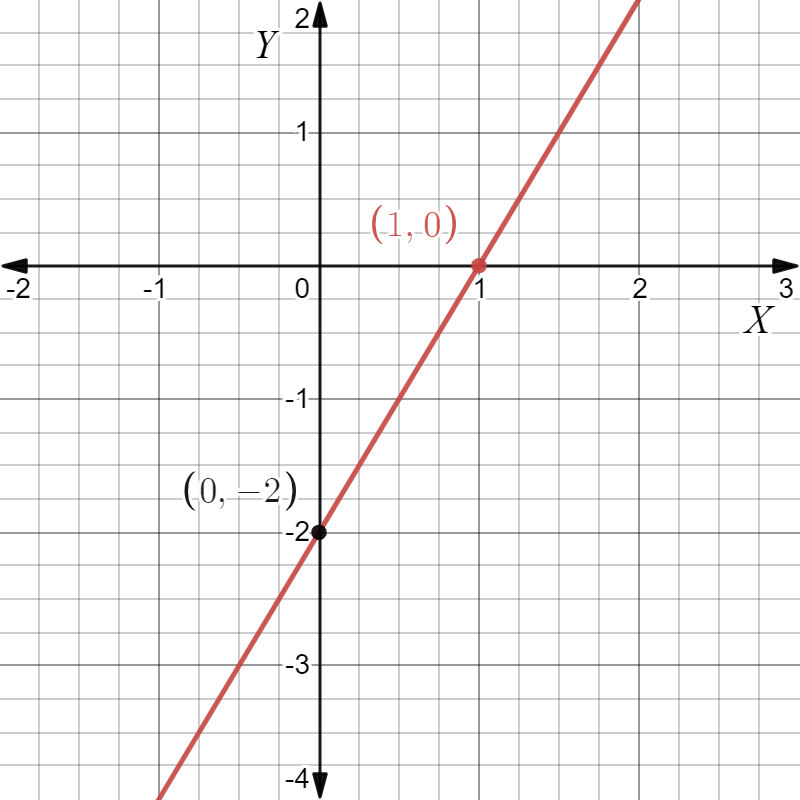
From the graph, we see that the line crosses the y-axis at point(0,−2), whose y-coordinate is−2.
Therefore, the y-intercept of the line is−2.
In the graph, by considering two points(1,0) and(0,−2) the slope of the line is calculated as follows
slope=\(\frac{\text { rise }}{\text { run }}\)
\(=\frac{0-(-2)}{1-0}\) \(=\frac{0+2}{1}\)=2.
The slope and y-intercept of the line y=2x−2 are 2 and−2, respectively, which are obtained from the following graph

Putting the values in the table, we get
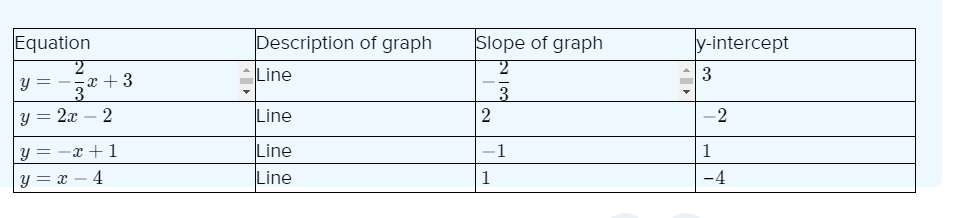
In the question, the given equation is y=−x+1.
We have to determine the slope and y-intercept of the line.
We are going to use the formula for the slope.
The graph of the line is as follows

From the graph, we see that the line crosses the y-axis at point(0,1), whose y-coordinate is 1.
Therefore, the y-intercept of the line is 1.
In the graph, by considering two points(0,1) and(1,0), the slope of the line is calculated as follows
Slope\(=\quad \frac{\text { rise }}{\text { run }}\)
\(=\frac{0-(-4)}{4-0}\) \(=\frac{0+4}{4}\) \(=\frac{4}{4}\)=−1.
The slope and y-intercept of the liney=−x+1 are−1 and 1, respectively, which are obtained from the following graph
Putting the values in the table, we get
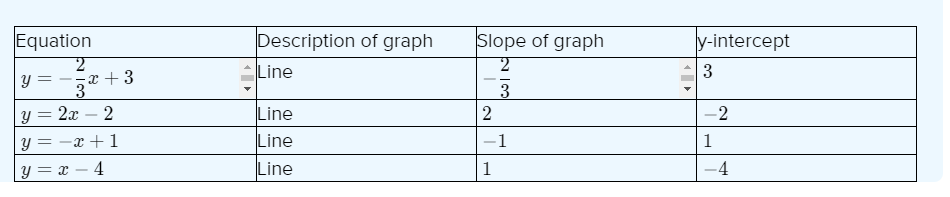
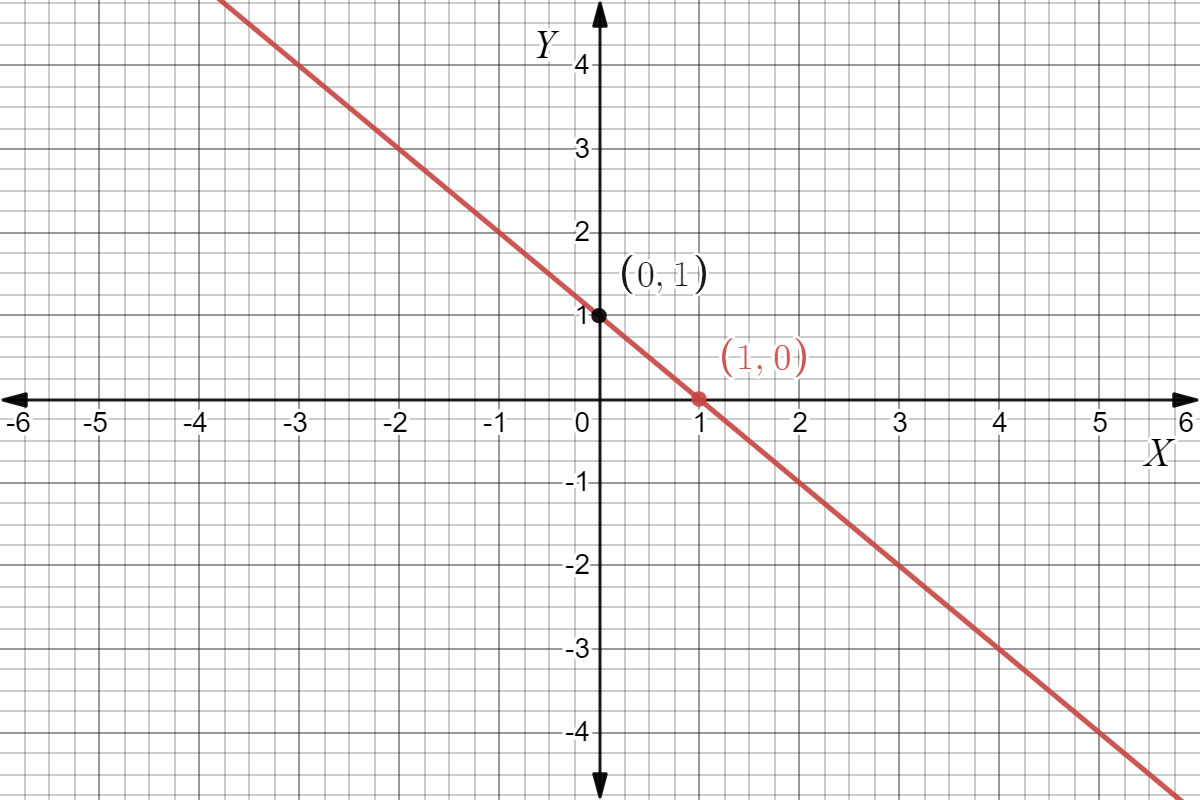
In the question, the given equation is y=x−4.
We have to determine the slope and y-intercept of the line.
We are going to use the formula for the slope.
The graph of the line is as follows
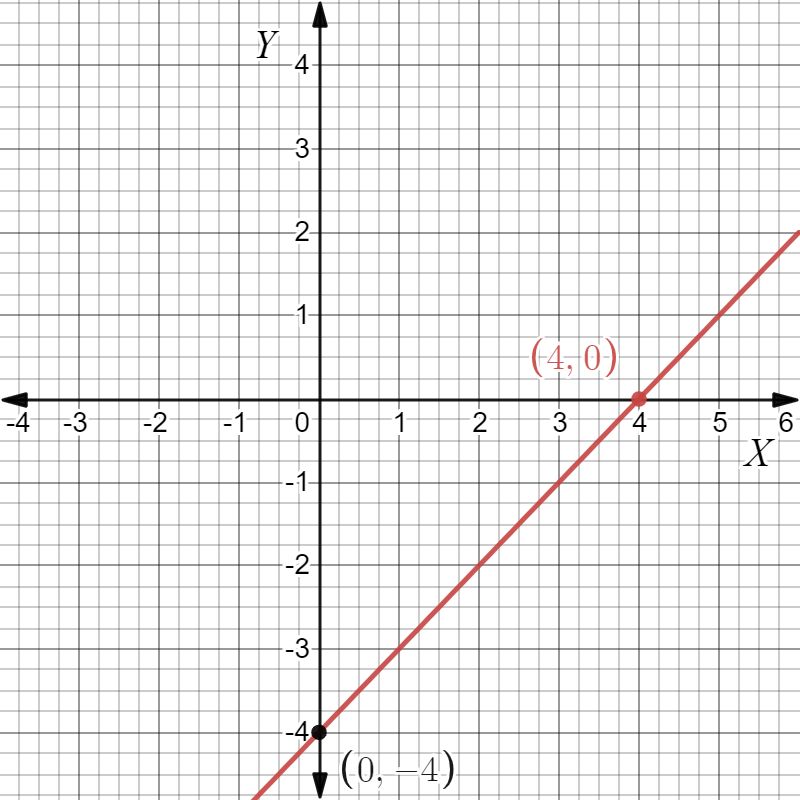
From the graph, we see that the line crosses the y- axis at point(0,−4), whose y-coordinate is−4.
Therefore, the y-intercept of the line is−4.
In the graph, by considering two points(4,0)
and(0,−4),
the slope of the line is calculated as follows
slope\(=\quad \frac{\text { rise }}{\text { run }}\)
\(=\frac{0-(-4)}{4-0}\) \(=\frac{0+4}{4}\) \(=\frac{4}{4}\)=1.
The slope and y-intercept of the line y=x−4 are 1 and−4, respectively, which are obtained from the following graph

Putting the values in the table, we get
Graphing Linear Functions Exercise 3.5 Big Ideas Math
Big Ideas Math Algebra 1 Student Journal 1st Edition Chapter 3 Graphing Linear Functions Exercise 3.5 Page 80 Exercise 3 Answer
In the question, the equation of the straight line is given as y=mx+b.
We have to determine how the value of m
Effect the graph of the equation.
Since slope measures the rate of change in the dependent variable, i.e.,y as the independent variable, i.e.,x changes.
Mathematically the slope of a line is defined as
slope\(=\frac{\text { rise }}{\text { run }}\)
\(=\frac{\text { change in } y}{\text { change in } x}\).
Thus, the greater the slope the steeper the line.
The slope shows both steepness and direction.
With a positive slope, the line moves upward when going from left to right.
With a negative slope, the line moves down when going from left to right.
If two linear functions have the same slope they are parallel.
The effect of the slope is clearly shown in the following graph.
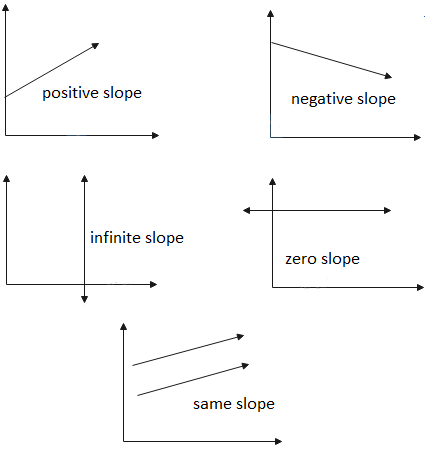
In the equation,y=mx+b,m represents the slope of the line and the effect of the value of m can be understood from the following the given in below

In the question, the equation of the straight line is given as y=mx+b.
We have to determine how the value of b
Effect the graph of the equation.
Since b represents the y-intercept of the line, this means, the distance of the point, at which the line crosses the y-axis, from the origin.
Therefore, we get the two points
1. Increasing the y-intercept moves the graph up.
2. Decreasing the y-intercept moves the graph down.
In the equation,y=mx+b,b represents the y-intercept of the line and by changing it, we can move the graph of the line upwards or downwards.
In the question, the equation of the straight line is given as y=mx+b.
We have to verify the effect of the slope and y-intercept of the line by considering an equation of a line.
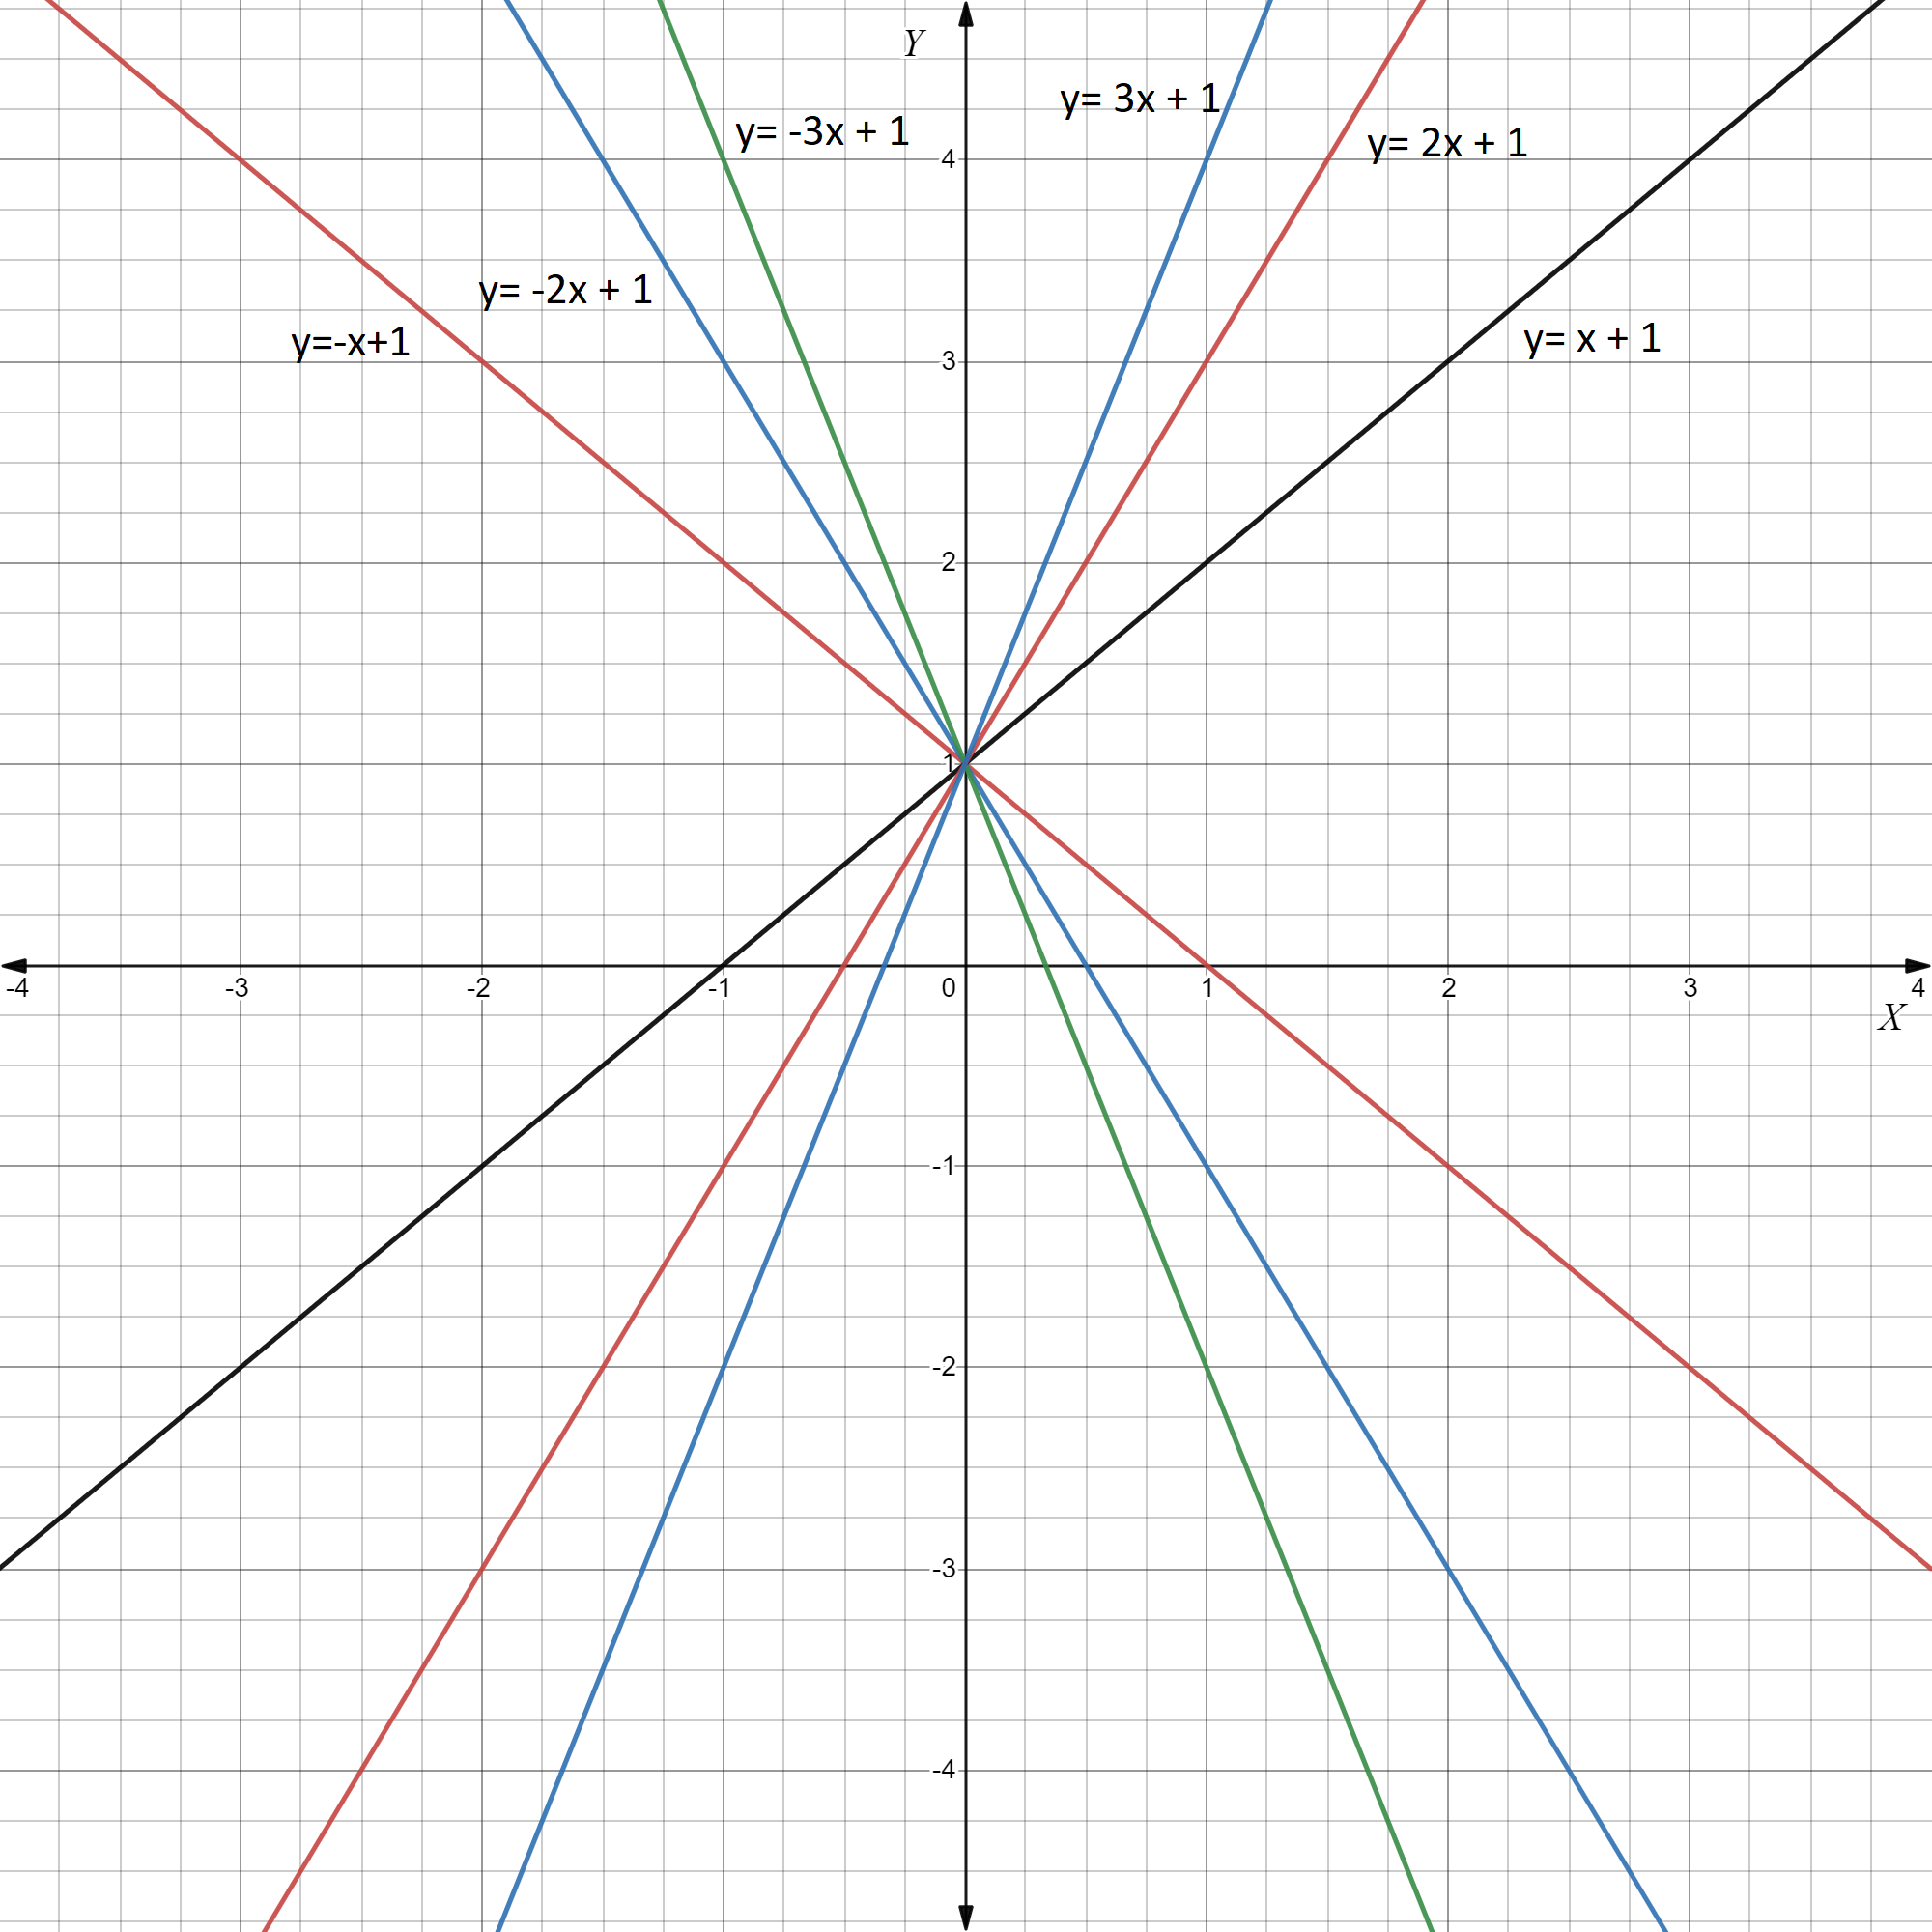
Let us choose the equation of line as y=−x+1.
The slope of the line is−1.
Varying the slope of the line, we get the following graph

From the given graph, the following points are verified:
The greater the slope the steeper the line.
The slope shows both steepness and direction.
With a positive slope, the line moves upward when going from left to right.
With a negative slope, the line moves down when going from left to right.
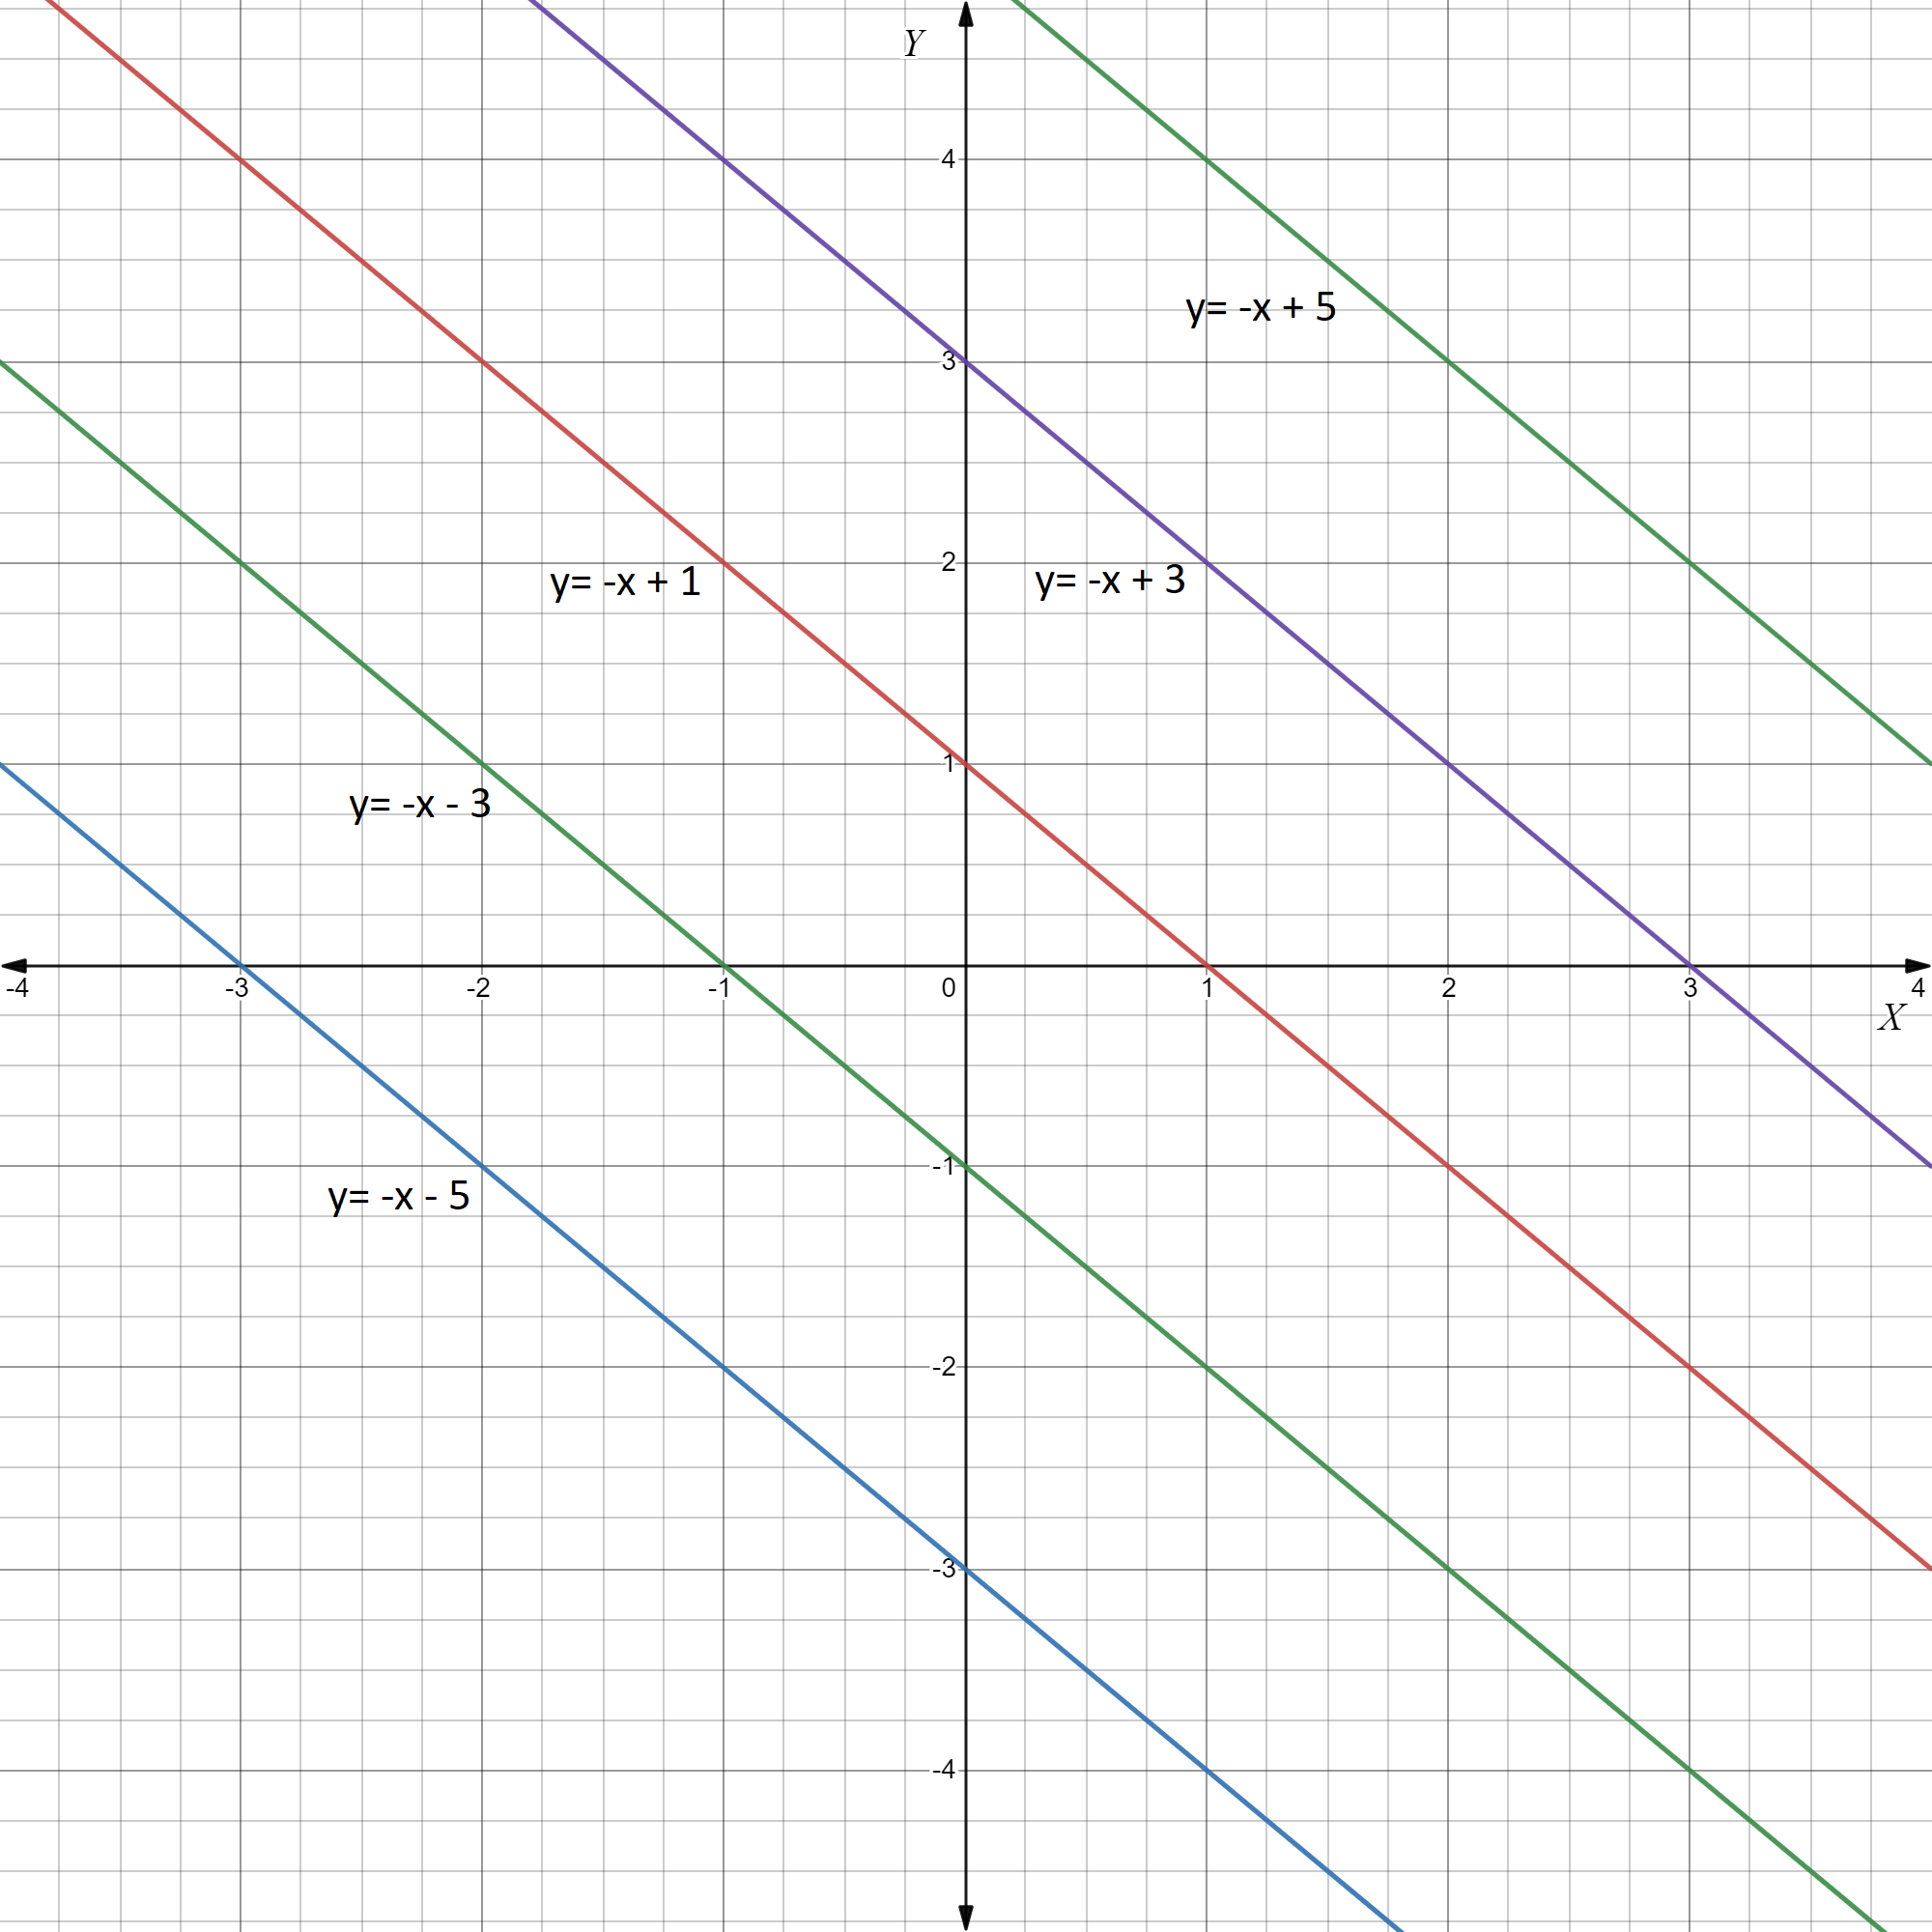
Again, the y-intercept of the line is 1.
Now, varying the y-intercept, we get the following graph

From the given graph, the following points are verified:
1. Increasing the y-intercept moves the graph up.
2. Decreasing the y-intercept moves the graph down.
The effects of the slope and y-intercept on the equation y=mx+b are verified from the following graphs considering the equation y=−x+1
(1) varying only m:
(2) varying only b:
Big Ideas Math Linear Functions Exercise 3.5 Help
Page 83 Exercise 3 Answer
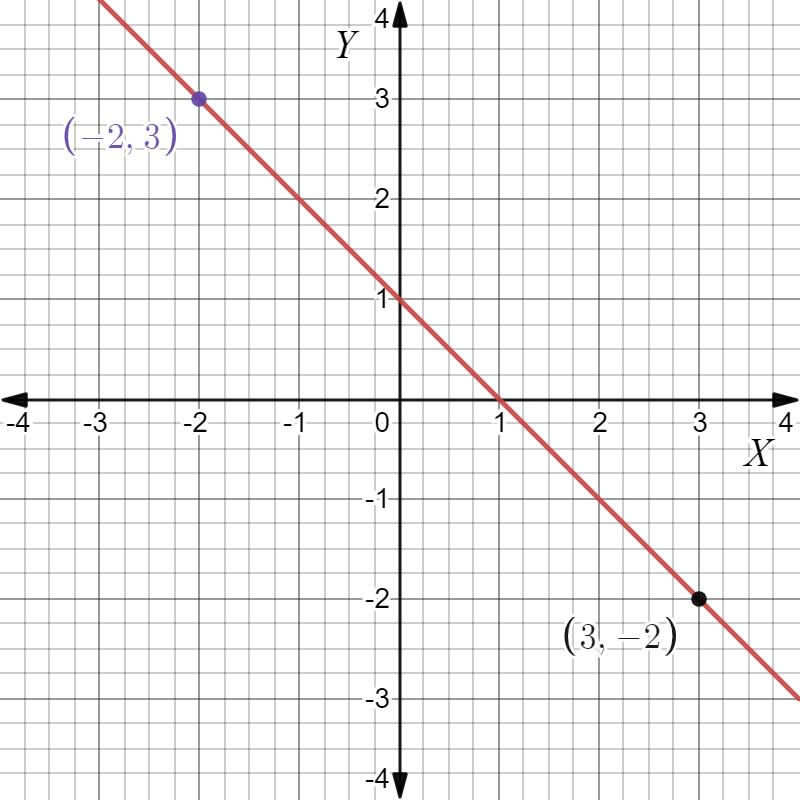
In the question, a straight line is given in the graph.
We have to find the slope of the line by describing it.
We are going to use the formula for the slope.
The given graph is
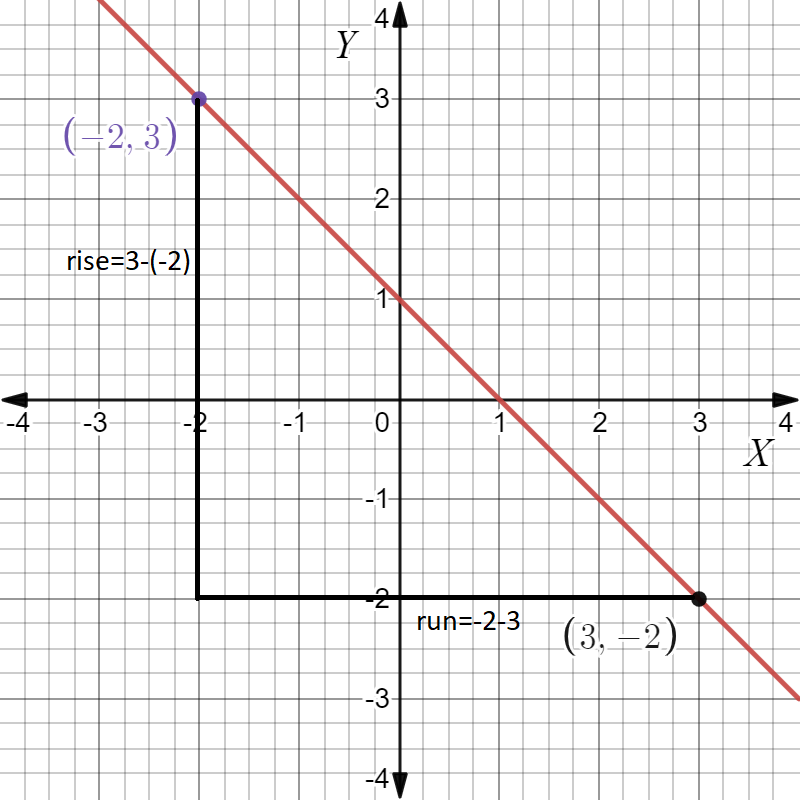
Now, considering the points(−2,3) and(3,−2) on the line, the rise and the run are indicated in the following graph

Therefore, from the graph, the rise of the line is calculated as:
3−(−2)=3+2
=5
And the run is calculated as −2−3=−5.
Thus, the slope of the given line is calculated as follows
slope \(=\frac{\text { rise }}{\text { run }}\)
\(=\frac{5}{-5}\)
=−1.
From the given graph, the slope of the given line is calculated as−1.
Big Ideas Math Algebra 1 Student Journal 1st Edition Chapter 3 Graphing Linear Functions Exercise 3.5 Page 83 Exercise 5 Answer
In the question, the points which lie on a line are presented in a table.
We have to determine the slope of the line.
We are going to use the formula for slope.
The points which lie on the line are given as:
(−3,11),(−1,3),(1,−5),(3,−13).
Considering any two points we can calculate the slope of the line.
Without loss of generality, let us consider the points(−3,11) and(1,−5).
Now, using the formula for the slope of a straight line, we get the slope of the required line as
Slope=\(=\frac{1-(-3)}{-5-11}\)
\(=\frac{1+3}{-16}\) \(=\frac{4}{-16}\) \(=-\frac{1}{4} \text {. }\)This result can be verified by taking any other two points.
If the points represented by the table lie on a line, the slope of the line is
\(-\frac{1}{4}\)
Chapter 3 Exercise 3.5 Step-By-Step Solutions Big Ideas Math
Page 83 Exercise 6 Answer
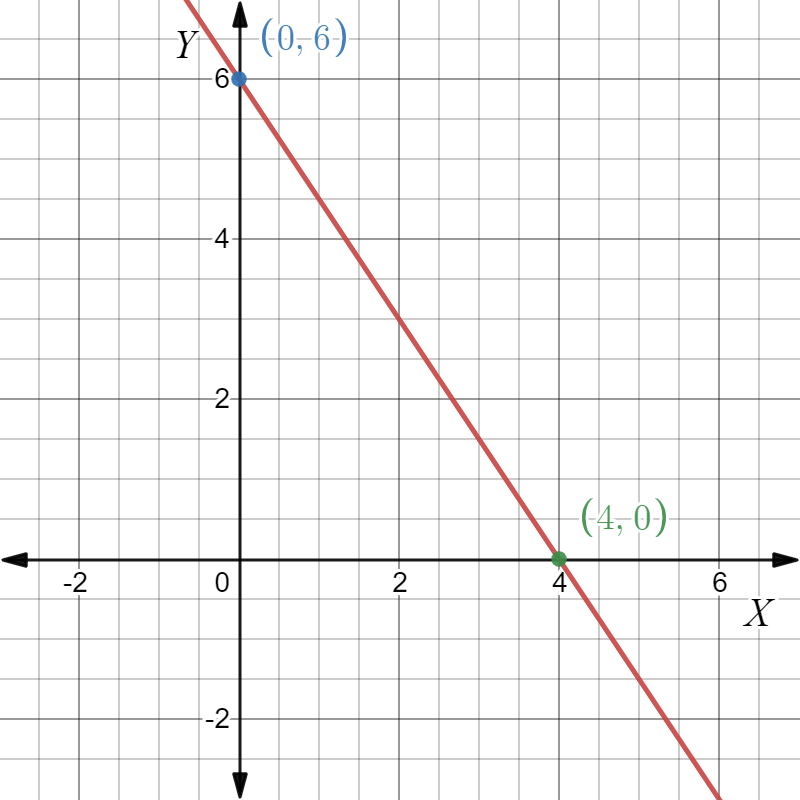
In the question, the given straight is 6x+4y=24.
We have to find the y-intercept and slope of the line.
We are going to draw a graph and use the formula for the slope.
The given straight line is 6x+4y=24.
The graph of the straight line is given below

From the graph, we see that the graph of the given straight line crosses the y-axis at point(0,6), whose y-coordinate is 6.
Therefore, the y-intercept of the straight line is 6.
Again in the graph, considering the points(0,6) and(4,0) on the line, we can calculate the slope of the line as follows
Slope\(=\frac{\text { change in } y}{\text { change in } x}\)
\(=\frac{4-0}{0-6}\)\(=-\frac{2}{3}\).
The slope and the y-intercept of the linear equation 6x+4y=24, which are obtained from the given graph are\(-\frac{2}{3}\) and 6, respectively.
Big Ideas Math Algebra 1 Student Journal 1st Edition Chapter 3 Graphing Linear Functions Exercise 3.5 Page 83 Exercise 7 Answer
In the question, the given straight is y\(=-\frac{3}{4} x+2\)
We have to find the y-intercept and slope of the line.
We are going to draw a graph and use the formula for the slope.
The given straight line is y=\(-\frac{3}{4} x+2\)
The graph of the straight line is given below
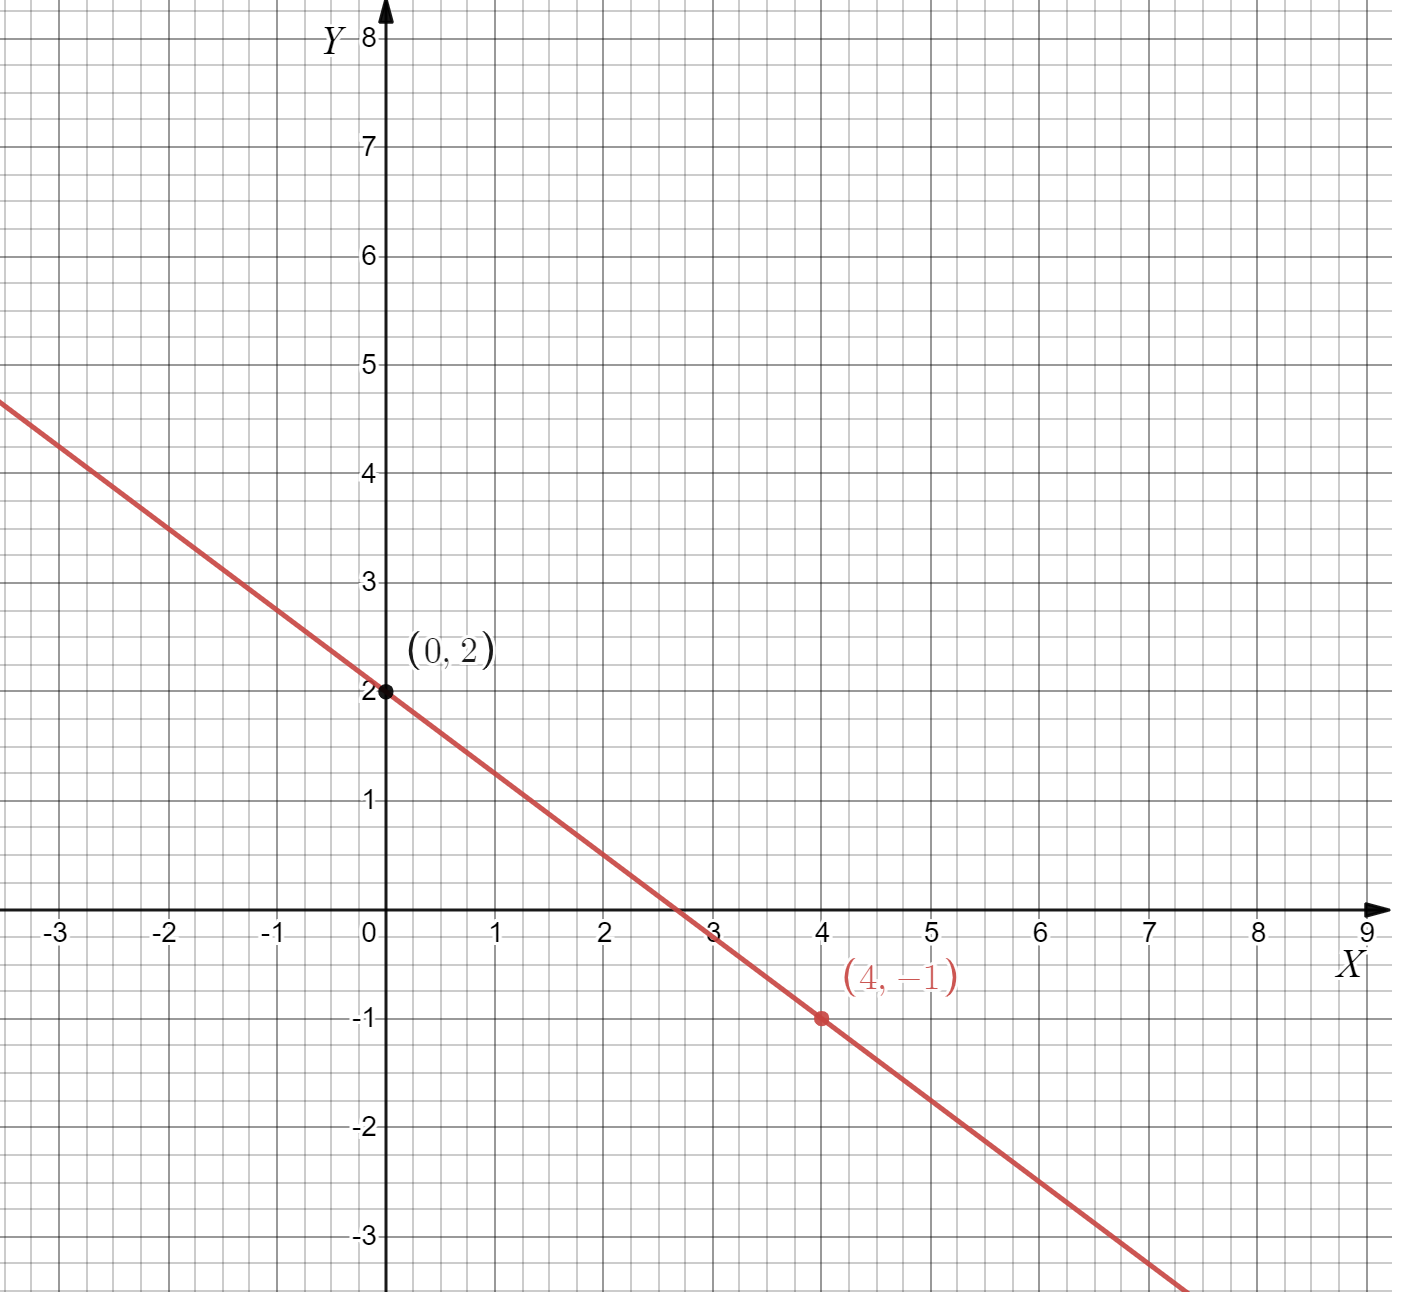
From the graph, we see that the graph of the given straight line crosses the y-axis at point(0,2), whose y-coordinate is 2.
Therefore, the y-intercept of the straight line is 2.
Again in the graph, considering the points(0,2) and(4,−1), we can calculate the slope of the line as follows
slope\(=\frac{\text { change in } y}{\text { change in } x}\)
\(=-\frac{3}{4}\)
The slope and the y-intercept of the linear equation\(y=-\frac{3}{4} x+2\)which are obtained from the given graph are 2 and \(-\frac{3}{4}\) respectively.

Big Ideas Math Algebra 1 Student Journal 1st Edition Chapter 3 Graphing Linear Functions Exercise 3.5 Page 83 Exercise 8 Answer
Given: The equation is y=5x.
To find They− intercept and the slope of the line. Let us draw a graph and use the formula for the slope.
The given straight line is y=5x
The graph of the straight line is given below
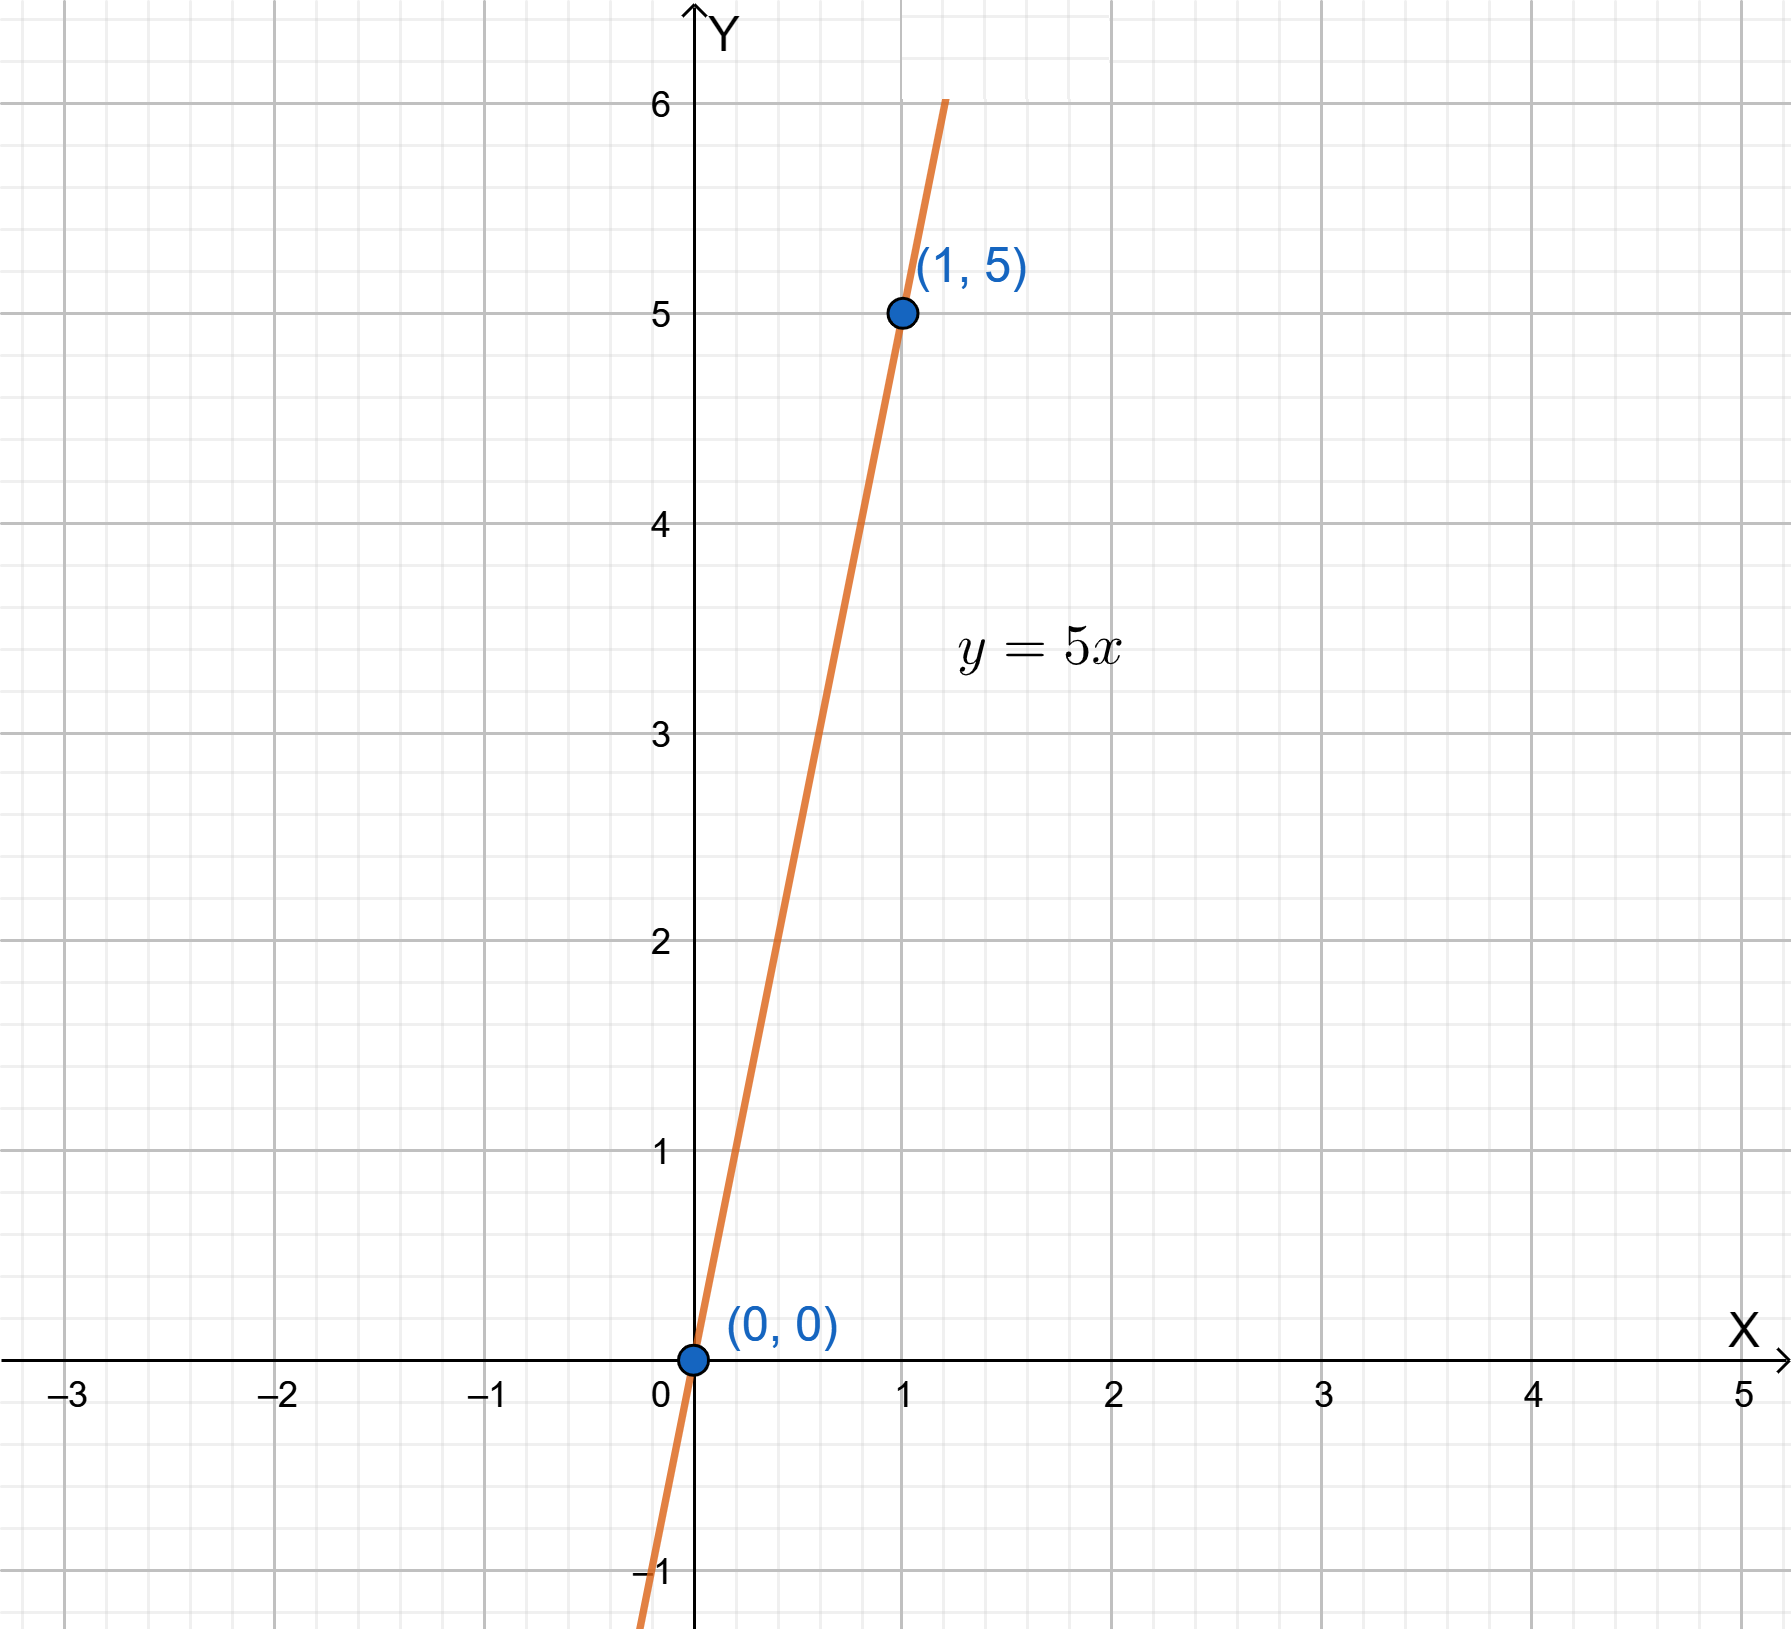
The equation passes through the origin. So the y−intercept will be 0.
Again in the graph, considering the points(1,5) and(0,0), we can calculate the slope of the line as follows
Slope\(=\frac{y_2-y_1}{x_2-x_1}\)
Slope \(=\frac{0-5}{0-1}\)
Slope \(\frac{-5}{-1}\)
Slope=5
The slope and the y-intercept of the linear equation y=5x which are obtained from the given graph are 5 and 0 respectively.

Exercise 3.5 Big Ideas Math Algebra 1 Guide
Big Ideas Math Algebra 1 Student Journal 1st Edition Chapter 3 Graphing Linear Functions Exercise 3.5 Page 83 Exercise 9 Answer
Given: A linear function f models a relationship in which the dependent variable decreases 6 units for every 3 units the independent variable decreases and the value of the function at 0 is 4.
To find The graphical representation, Slope, x−intercept andy−intercept.We will sketch the graph of the function and use it to calculate the result.
Since the dependent variable decreases 6 units for every 3 units the independent variable increases
Slope=\(\frac{-6}{-3}\)
Slope=2
The equation for the function isf(x)=0.
we write it as y=mx+c
Here the slope is m=2
The value of the function at 0 is 4
So the intercept is b=4
Substituting the above values, we get
y=2x+4
But given that they coordinate,y=0
0=2x+4
2x=−4
x=−2
The graphical representation of the equation y=2x+4 is
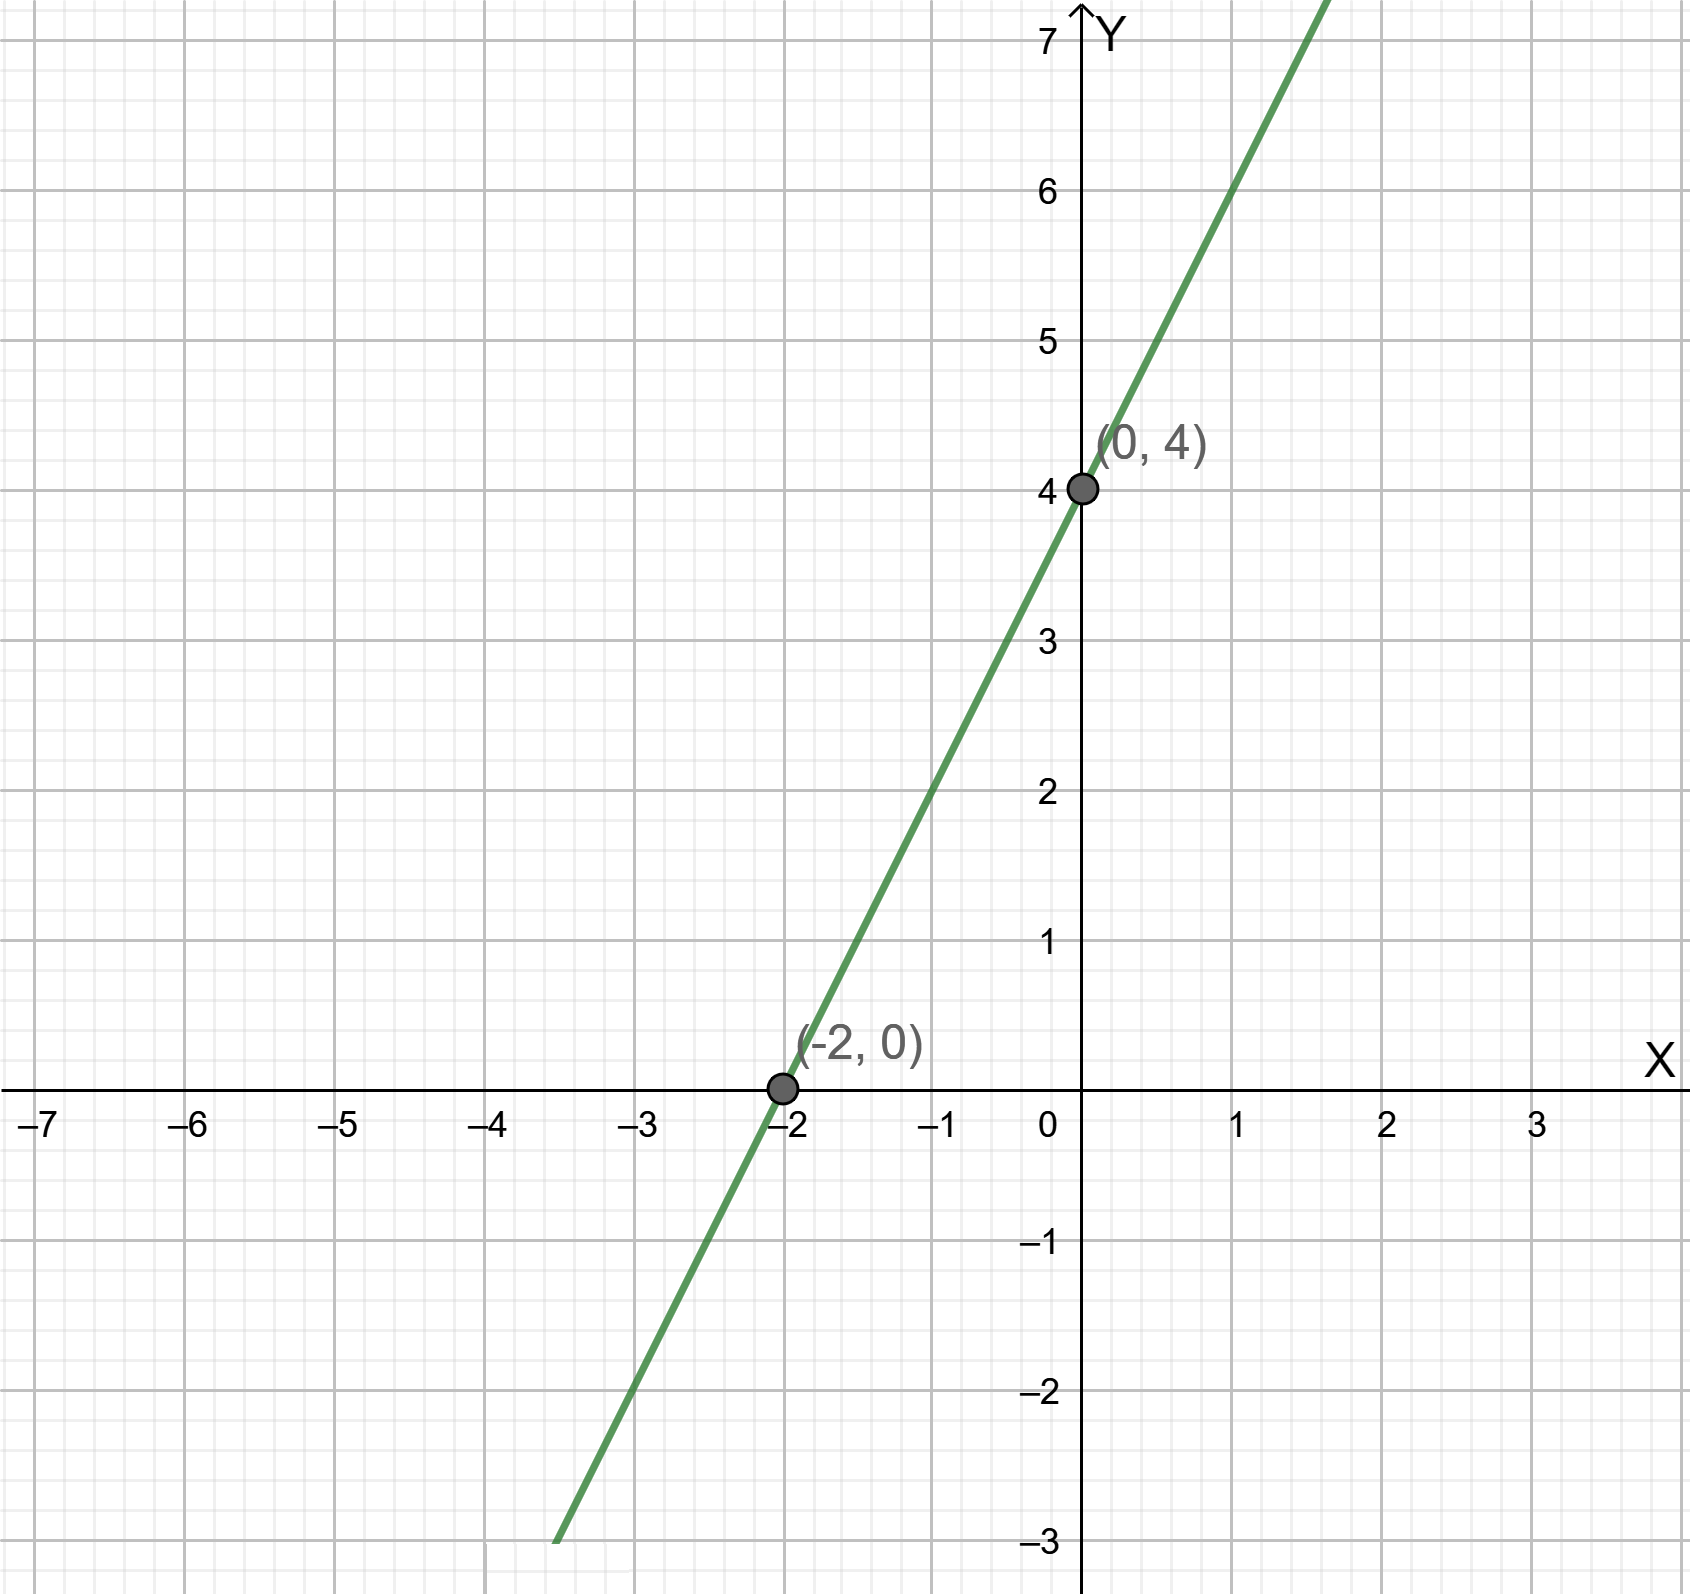
The slope, x−intercept, andy−intercept are 2,−2, and 4. The graph will be

Algebra 1 Exercise 3.5 Explanation Big Ideas Math