Envision Math Grade 8 Volume 1 Student Edition Solutions Chapter 3 Use Functions To Model Relationships Exercise 3.3
Page 171 Exercise 1 Answer
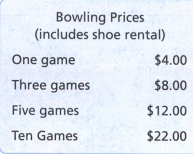
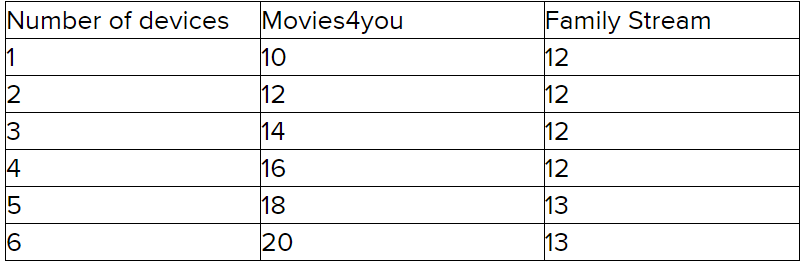
The Movies4You offer the deal that costs $10 for the first device and an additional $2 for each additional device, which means that they will for example charge $20 monthly for 6 devices.
The Family stream cots $12 a month for up to 4 devices which means that they are going to pay $12 if the number of devices is up to 4.
On the other hand, it means that if there are morthan 5 devices they are charging an additional $1 per device.
We make a table to see when each plan is the better deal:

Movies 4 you have a better deal when there is only one device connected.
Both of the services offer fixed costs per month for a number of devices.
They have a different fixed cost per month and different initial costs.
Movies 4 You has a better deal when there is only one device connected.
Envision Math Grade 8 Volume 1 Chapter 3 Exercise 3.3 Functions Solutions
Page 171 Exercise 1 Answer
We need to explain how we can represent the relationship between cost and number of devices.
The Movies 4 You offer the deal that costs $10 for the first device and an additional $2 for each additional device, which means that they will for example charge $20 monthly for 6 devices.
The Family stream costs $12 a month for up to 4 devices which means that they are going to pay $12 if the number of devices is up to 4.
On the other hand, it means that if there are more than 5 devices they are charging an additional $1 per device.
We make a table to see when each plan is the better deal:
Movies 4 you have a better deal when there is only one device connected.
We can represent the relationship between cost and number of devices using a table. The table is as follows:
Page 171 Exercise 1 Answer
Movies 4 You is offering $10 for the first device and an additional $2 for each additional device. This means that our equation
would look like y = (x−1)⋅2 + 10 where x is the number of devices connected and y is the total cost.
For Family stream we have to pay $12 if we have up to 4 devices connected, and this would give the following equation y = 12 where x ≤ 4
Reason of that equation is that we have 5 or more devices connected it states that they charge an additional fee of $1 per device which change our equation y = (x−4)⋅1 + 12 to where x ≥ 5
For Movies 4 You the relationship is shown by the equation y = (x−1)⋅2 + 10 where x is the number of devices connected.
For Family stream the equation y = (x−4)⋅1 + 12 when x ≥ 5
Envision Math Grade 8 Volume 1 Student Edition Solutions Chapter 3 Use Functions To Model Relationships Exercise 3.3 Page 172 Question 1 Answer
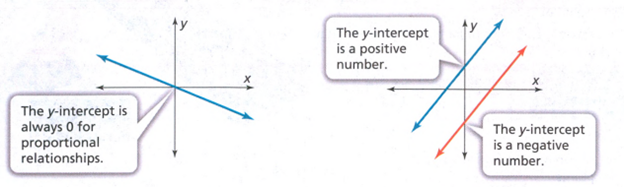
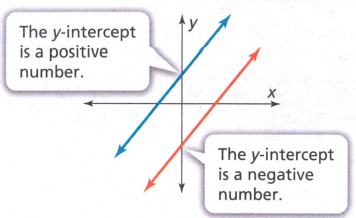
We can compare two different functions using the properties of functions.
We use the property of constant rate of change and the initial value which is the y-intercept to compare the two functions.
We can compare two functions by comparing their properties.
Page 172 Exercise 1 Answer
We need to determine what are the properties of functions that can be used to compare functions.
Some of the properties of functions are:
Linear functions: It is represented by f(x) = mx + b where m,b are real numbers.
Constant Function: It is represented by f(x) = b where b is a real number.
Identity Function: It is represented by f(x) = x where the input and the output are the same.
Square Function: It is represented by f(x) = x2 where the output is the square of the given input.
Cube Function: It is represented by f(x) = x3 where the output is the cube of the given input.
Square Root Function: It is represented by f(x) = √x where the output is the square root of the given input.
Reciprocal Function: It is represented by \(f(x)=\frac{1}{x}\) where the output is the inverse of the given input.
Absolute Value Function: It is represented by f(x)=∣x∣
Linear functions, Identity Function, Square Function, Cube Function, Square Root Function, Reciprocal Function, Absolute Value Function.
These are the properties of functions that can be used to compare functions.
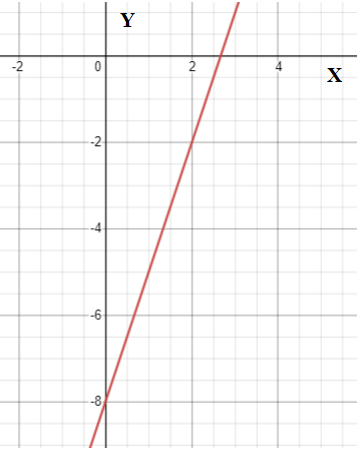
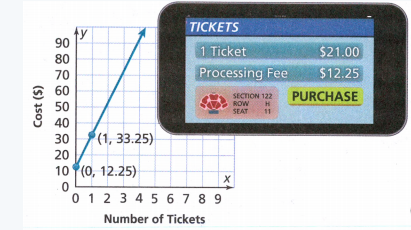
Envision Math Grade 8 Volume 1 Student Edition Solutions Chapter 3 Use Functions To Model Relationships Exercise 3.3 Page 173 Exercise 2 Answer
Given :
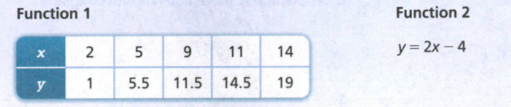
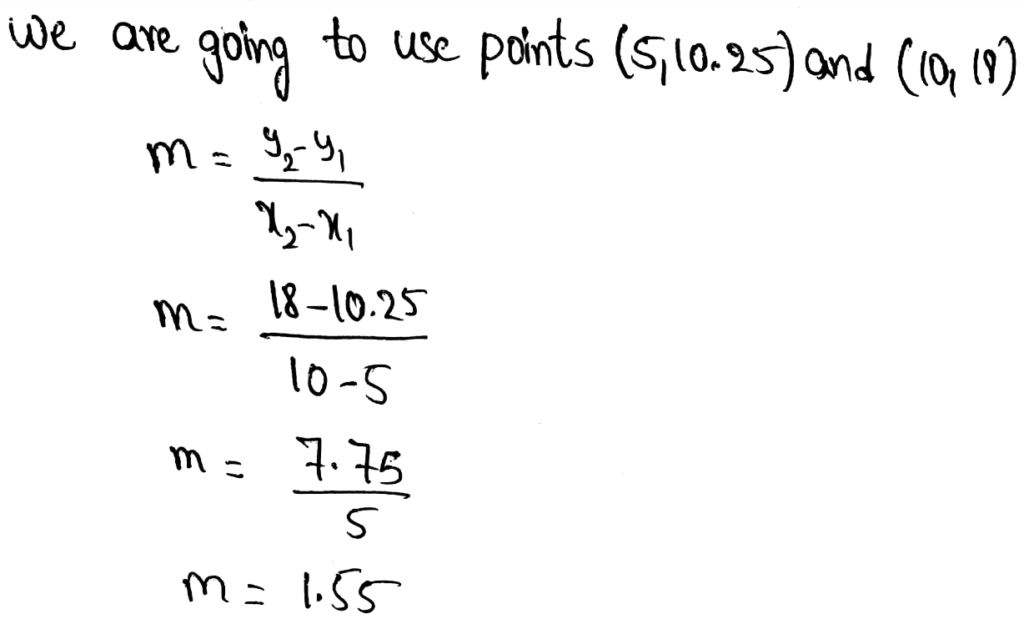
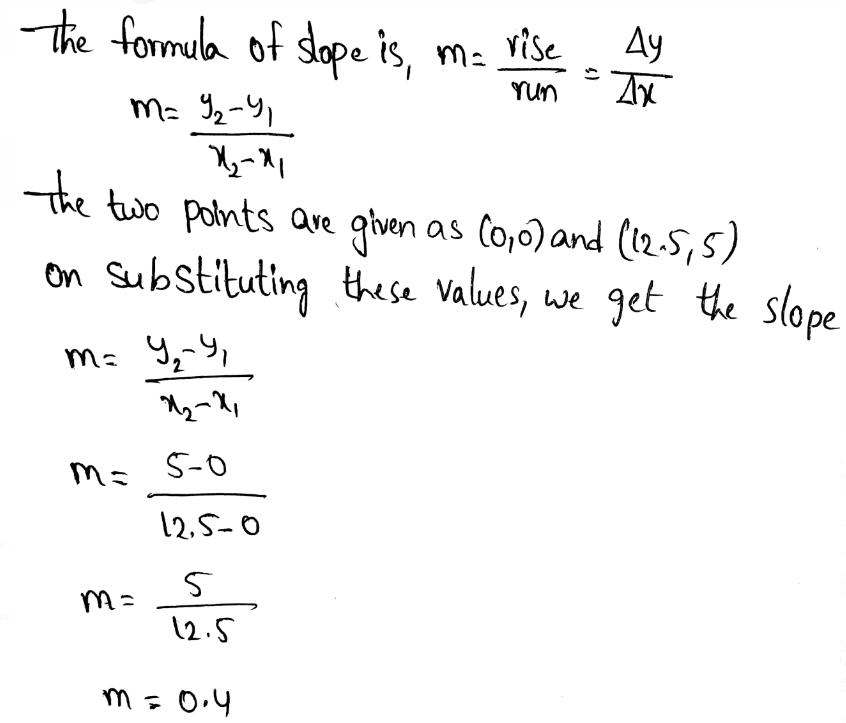
To be able to compare the two given functions, we have to put values for y in Function 2 and see the results that we get for x. we are going to calculate for the first 3 y values.
1 = 2x − 4
Add 4 to both sides of the equation
5 = 2x
Now we divide both sides by 2
x = 2.5
5.5 = 2x − 4
Add 4 to both sides of the equation
9.5 = 2x
Divide both sides with 2
x = 4.75
11.5 = 2x − 4
Add 4 to both sides of the equation
15.5 = 2x
Divide both sides of the equation with 2
7.75 = 2x
From this we can see that the Function 1 has greater rate of change and Function 2 has a greater initial value.
Therefore Function 1 has greater rate of change and Function 2 has a greater initial value.
Envision Math Grade 8 Exercise 3.3 Use Functions To Model Relationships
Page 172 Exercise 1 Answer
All linear equations produce straight lines when graphed.
But not all linear equations produce linear functions.
In order to be a linear function, a graph must be both linear and a function.
Linear equations help to compare linear functions by graphs.
Envision Math Grade 8 Volume 1 Student Edition Solutions Chapter 3 Use Functions To Model Relationships Exercise 3.3 Page 174 Exercise 1 Answer
We can compare two different functions using the properties of functions.
We use the property of constant rate of change and the initial value which is the y-intercept to compare the two functions.
We can compare two functions by comparing their properties.
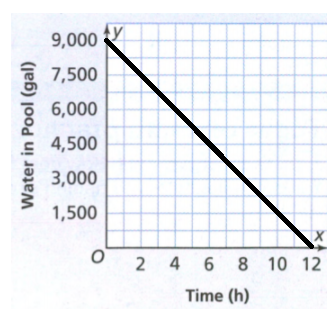
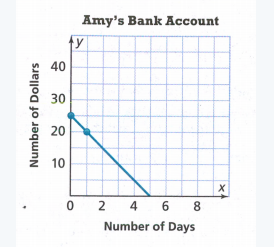
Page 174 Exercise 4 Answer
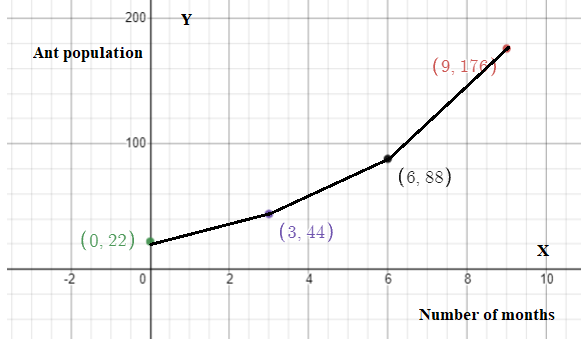
Given :
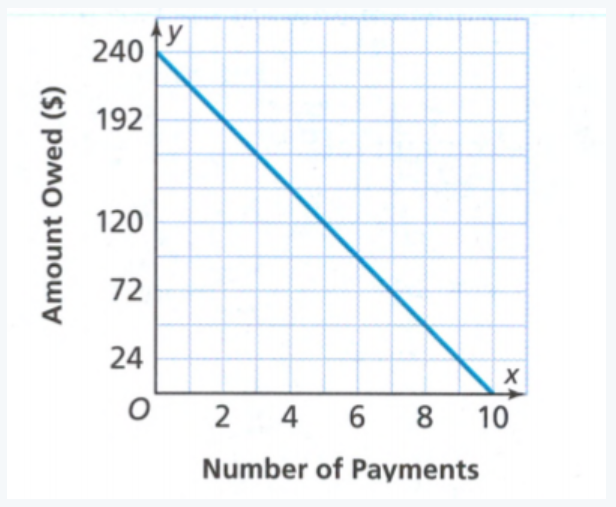
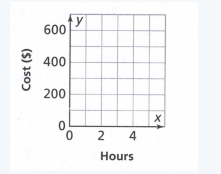
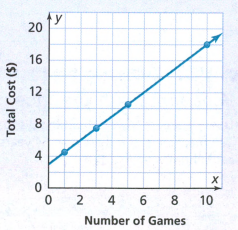
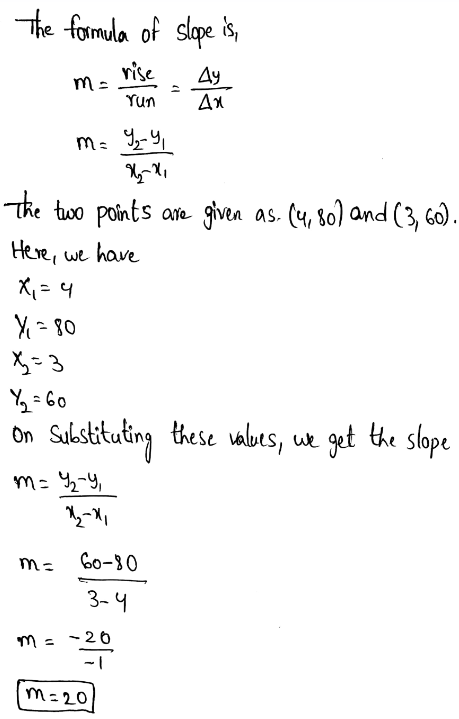
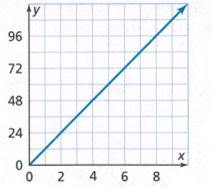
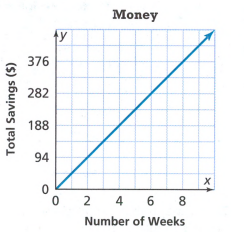
We find the constant rate of change and initial value for Samantha.
We see from the graph that the initial value is 240 and we can see that Samantha spent all this $240 on 10 payments.
We divide the amount of money with the number of payments, we get 4.
We can see she spends $24 per payment for the musical instrument.
In the task it states that Felipe pays $30 per payment.
Now we can see that she will spend $240 for the instrument and Felipe will spend $290.
Felipe’s instrument costs more.
Page 174 Exercise 5 Answer
Given :
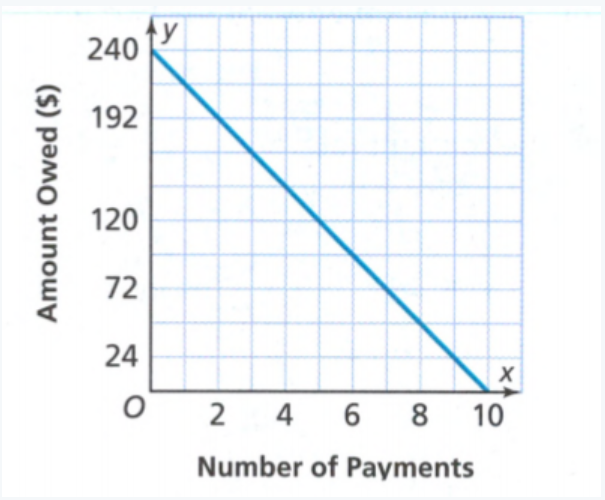
We need to divide the amount of money with the amount of pays to find how much Samantha pays.
∴ 240 ÷ 10 = 24
Since we already stated that Felipe pays $30 per month and Samantha pays $24 per month. This means that Felipe pays more each month.
Felipe pays more each month.
Envision Math Grade 8 Exercise 3.3 Solution Guide
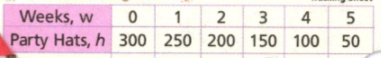
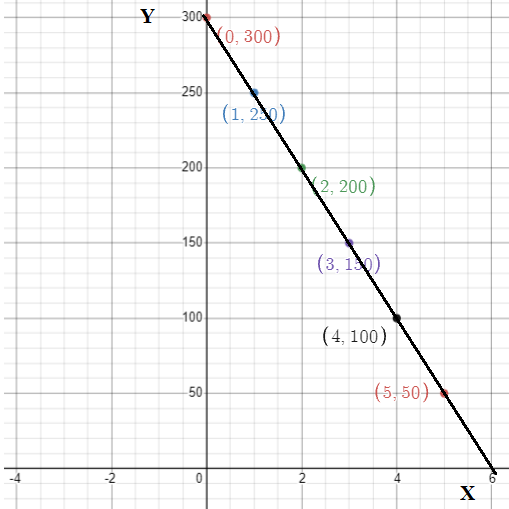
Envision Math Grade 8 Volume 1 Student Edition Solutions Chapter 3 Use Functions To Model Relationships Exercise 3.3 Page 175 Exercise 6 Answer
Given :

If we closely observe Function A, we see that the initial value of the function is 2. We also see that the rate at which the function is growing is 1, which means that the equation for the given function would be y = x + 2
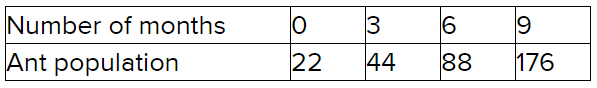
Now we observe Function B. we see that the Function B starts from the origin.
If we observe the numbers in the table, we can see that y grows faster than x.
The function A has the same rate of change for x and y which is 1.
This means that Function B has the greater rate of change.
Therefore Function B has the greater rate of change.
How To Solve Exercise 3.3 Functions In Envision Math Grade 8
Page 175 Exercise 7 Answer
Given :
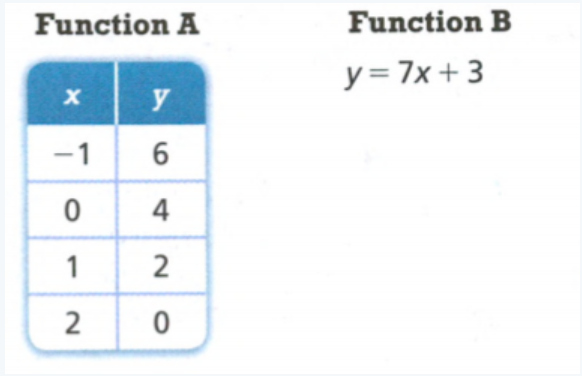
For initial value we have to find the ordered pair which has x = 0.Function A has the initial value of 4.
When we have a function written as an equation y = mx + b, we need to look at b and that is the initial value.
This means that Function B has the initial value of 3.
Function A has the greater value.
Function A has the greater initial value.
Functions And Modeling Relationships Grade 8 Exercise 3.3 Envision Math
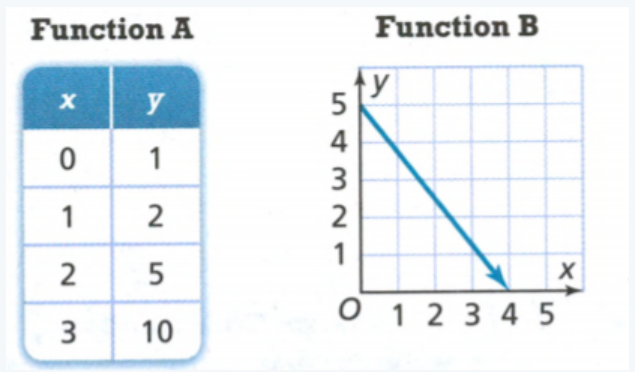
Envision Math Grade 8 Volume 1 Student Edition Solutions Chapter 3 Use Functions To Model Relationships Exercise 3.3 Page 175 Exercise 8 Answer
Given :
 ?
?
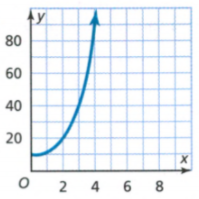
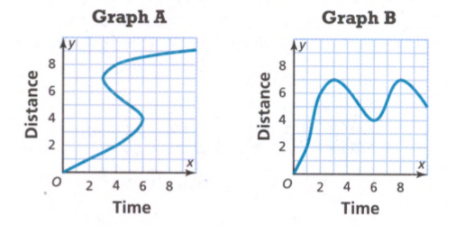
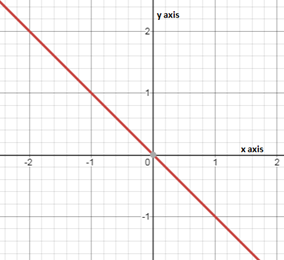
We observe Function A, we see that y changes is not always the same. This means that the given function is nonlinear.
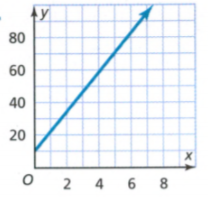
If we observe the graph of Function B, we can see that it is a straight line which means that this function is linear.
Function A is nonlinear and Function B is linear.
Page 175 Exercise 10 Answer
Given :
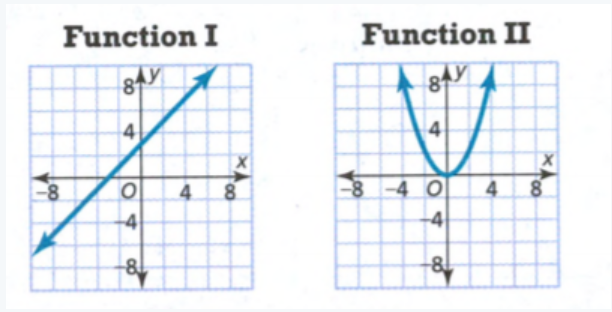
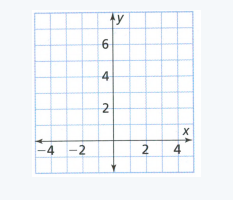
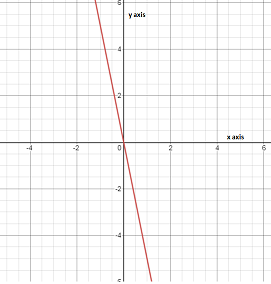
We observe that the graph of Function A is a straight line and therefore, it is linear.
The graph of Function B is a curve, therefore, it is nonlinear.
Function A is linear and Function B is nonlinear.
Envision Math Grade 8 Chapter 3 Exercise 3.3 Solutions
Envision Math Grade 8 Volume 1 Student Edition Solutions Chapter 3 Use Functions To Model Relationships Exercise 3.3 Page 175 Exercise 12 Answer
Given:
The function y = 4x + 3 describes Player A’s scores in a game of trivia.
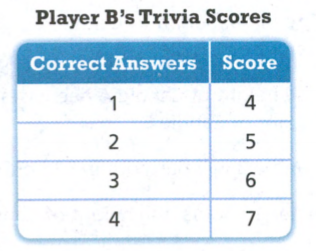
If we look at the given function, we observe that the initial value is 3 for Player A. The coefficient of x shows how much points he earns when the question is answered correctly, which is 4 per question answered correctly.
For Player B we can see that for every correct answer his score goes up by 1, which means that the points Player B gets when he answers questions correctly is 1. We subtract 1 form the first value of Score and that will be the initial value.
Player A earns 4 points per question answered correctly and Player B earns 1 point per question answered correctly.
Player A earns 4 points per question answered correctly and Player B earns 1 point per question answered correctly.
Page 176 Exercise 13 Answer
Given:
Athlete A can do 16 push-ups to start, and increase his total by 2 each day.
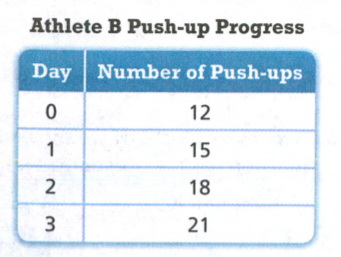
For Athlete A, the initial value is 16 push-ups that is already given, We look at the table for Athlete B, we see that on the first day, he was only able to do 12 push-ups.
Initial value in this situation tells us how many push-ups could each of them do before they started to train.
Therefore initial value in this situation tells us how many push-ups could each of them do before they started to train.
Envision Math 8th Grade Exercise 3.3 Step-By-Step Functions Solutions
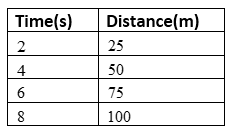
Envision Math Grade 8 Volume 1 Student Edition Solutions Chapter 3 Use Functions To Model Relationships Exercise 3.3 Page 176 Exercise 14 Answer
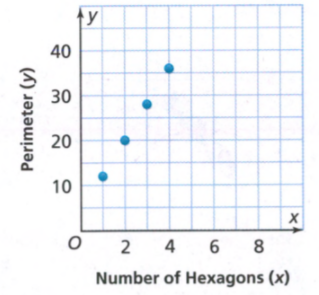
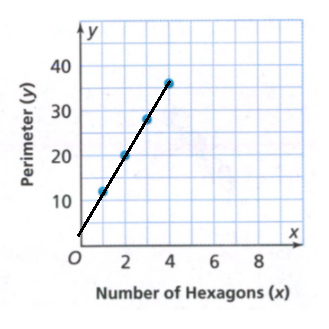
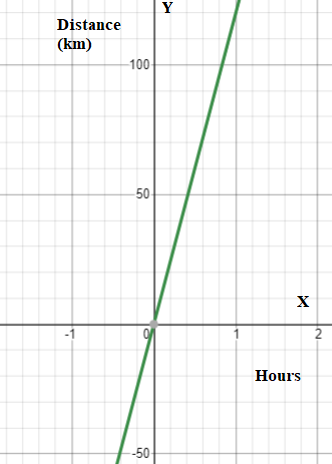
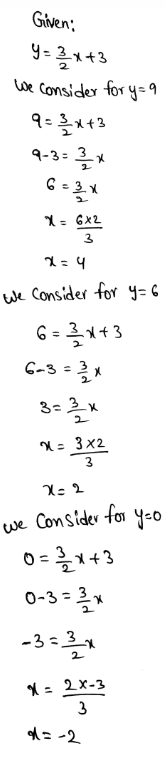
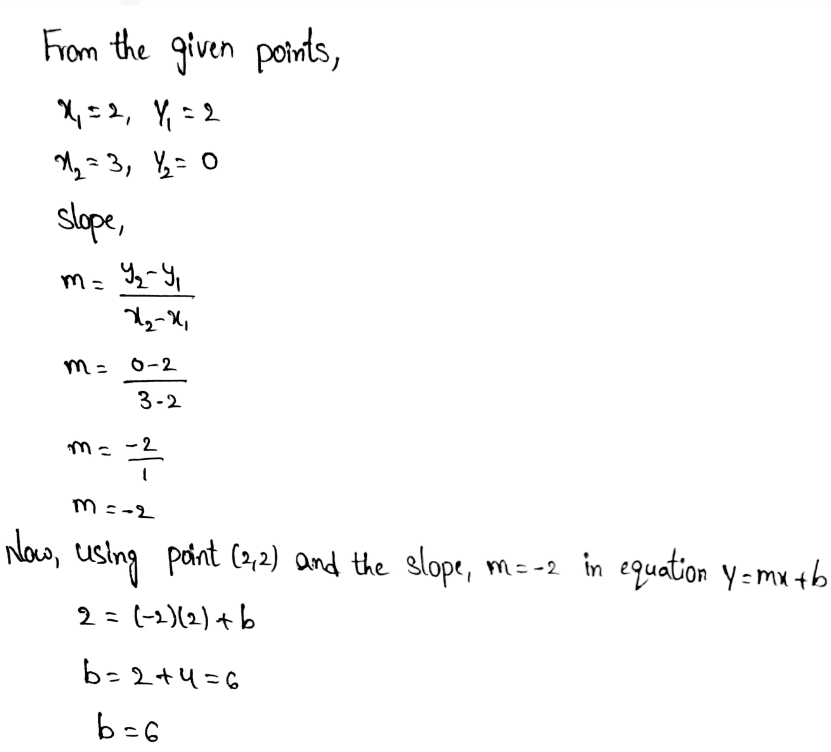
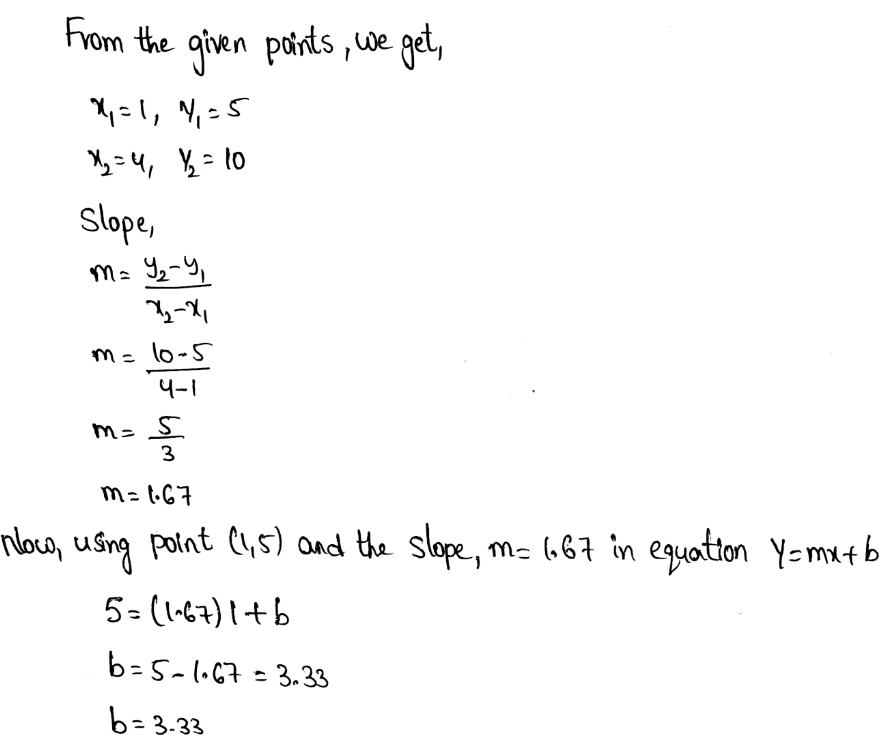
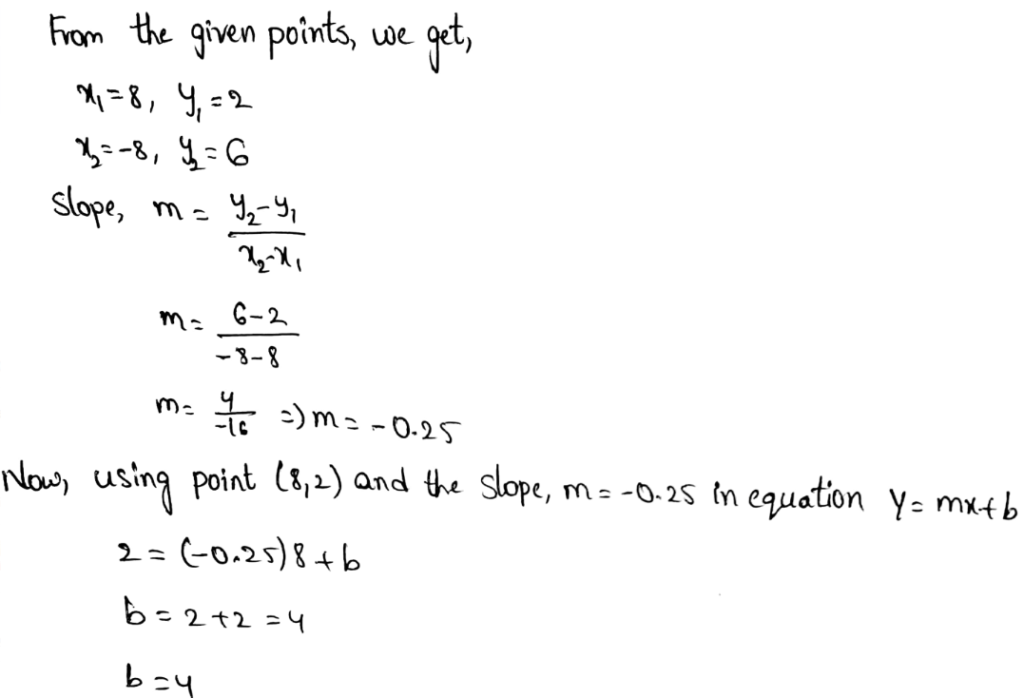
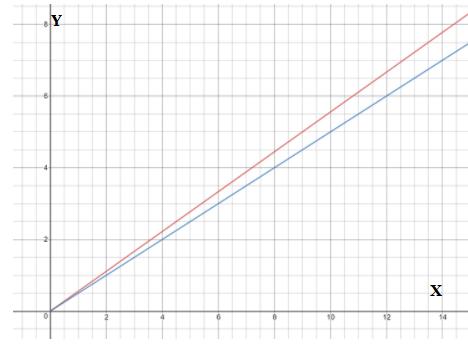
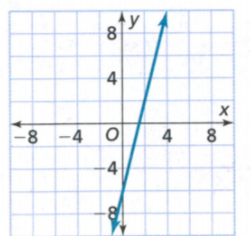
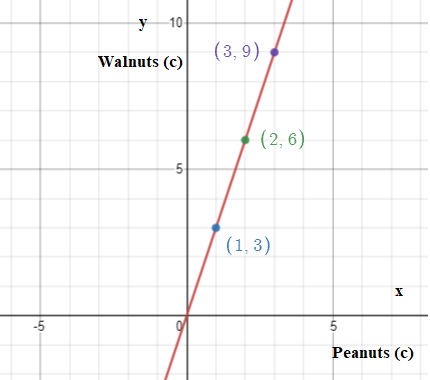
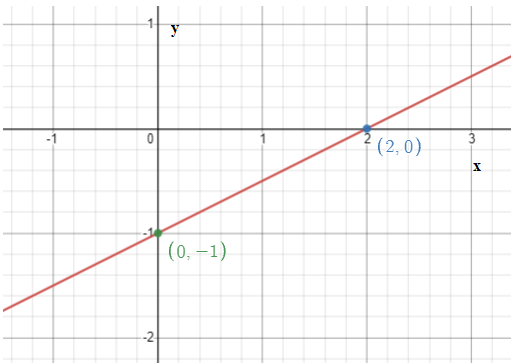
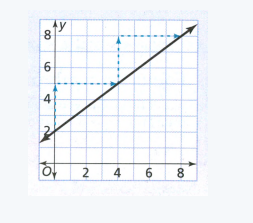
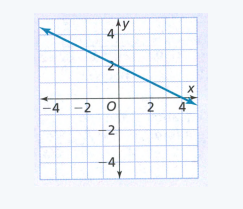
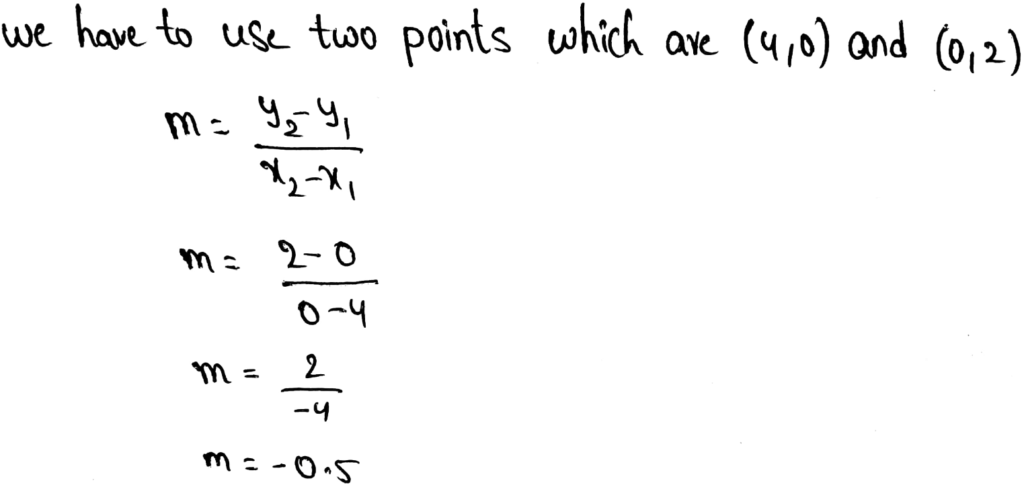
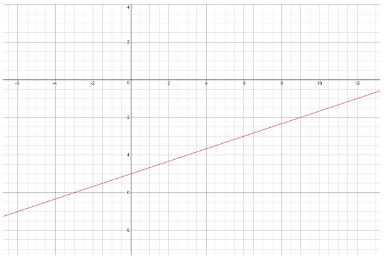
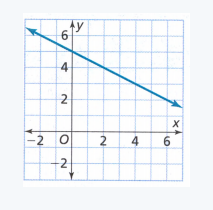
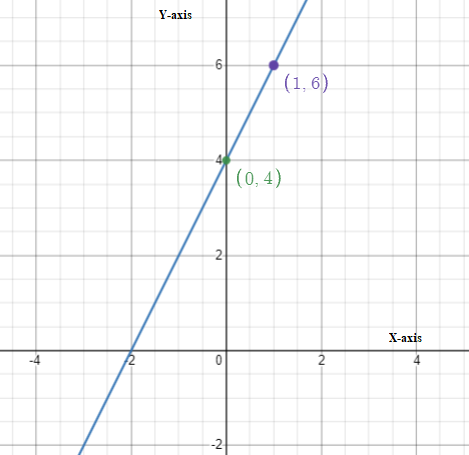
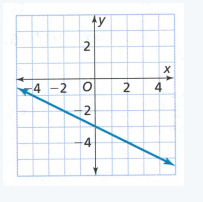
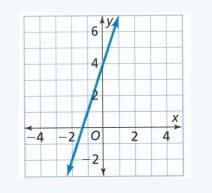
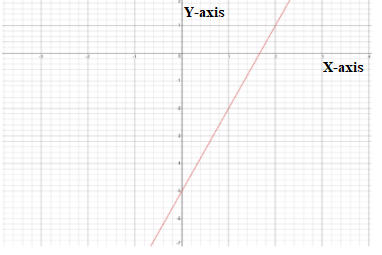
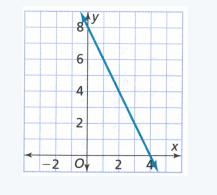
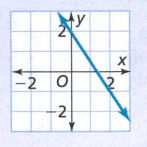
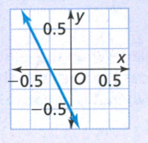
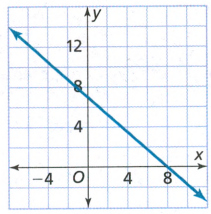
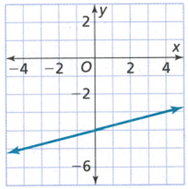
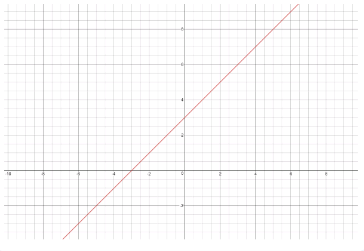
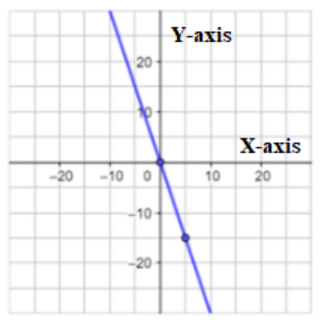
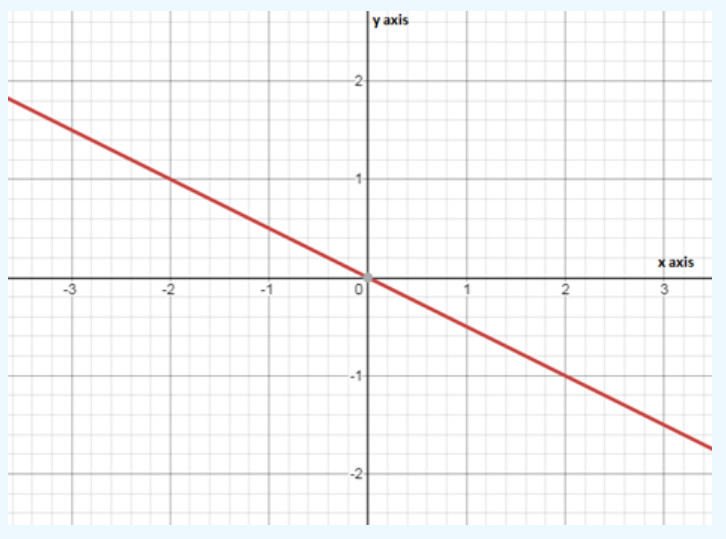
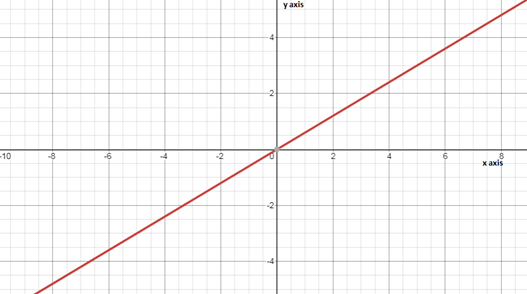
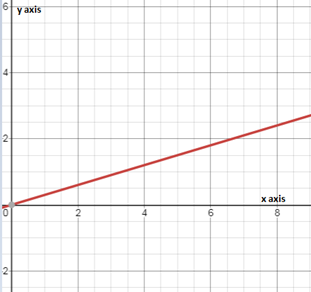
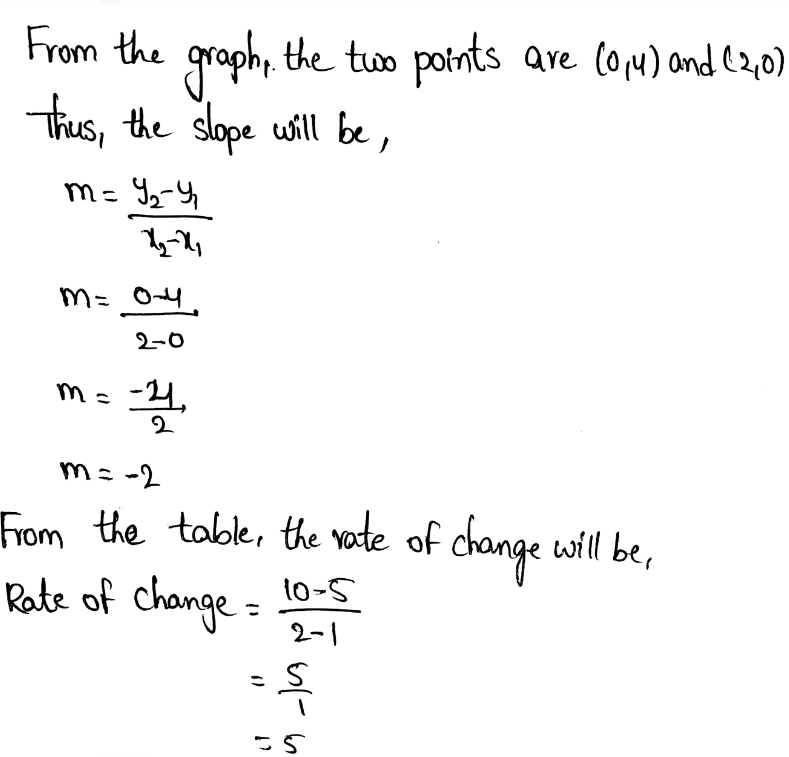
The equation y = 4x − 2 and the table and graph shown at the right describe three different linear functions. We need to find which function has the greatest rate of change and which has the least.
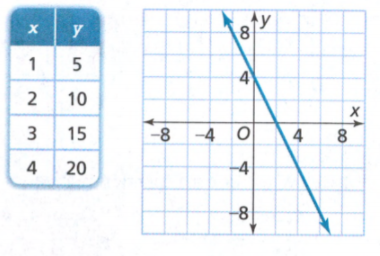
The given equation is y = 4x − 2
When,
x = 1 ⇒ y = 4 − 2 = 2
x = 2 ⇒ y = 8 − 2 = 6
x = 3 ⇒ y = 12 − 2 = 10
x = 4 ⇒ y = 16 − 2 = 14
The rate of change here is,
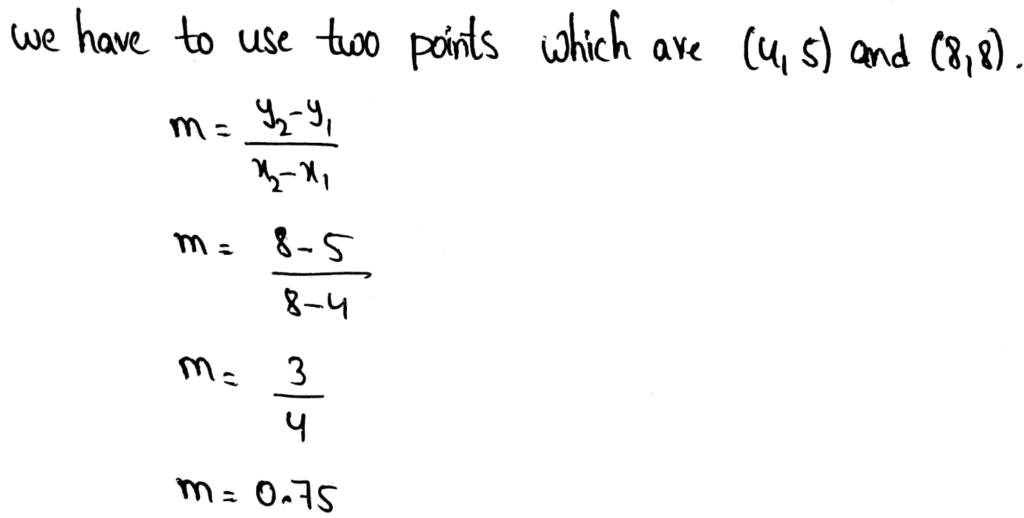
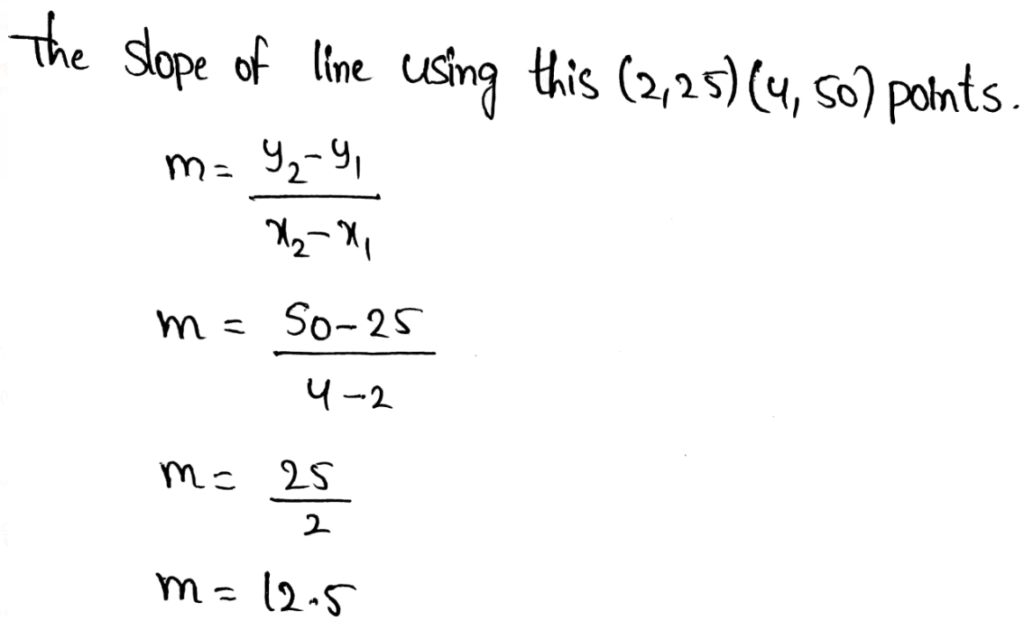
Rate of change = \(\frac{6-2}{2-1}\)
= \(\frac{4}{1}\)
= 4
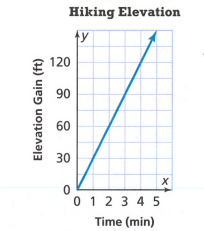
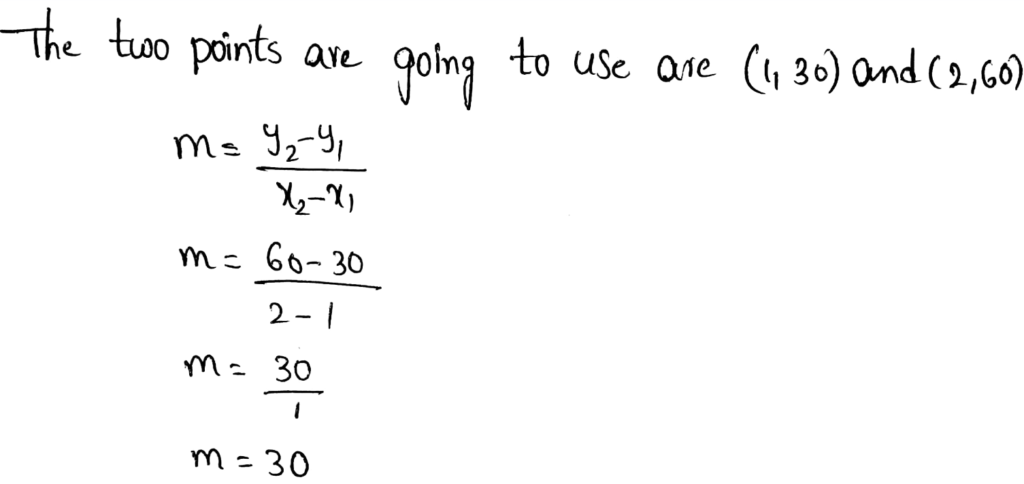
Rate of change is more for the given table and very less for the given graph.
The given table function has the greatest rate of change and the given graph has the least.