Envision Math Grade 8 Volume 1 Student Edition Solutions Chapter 4 Investigate Bivariate Data Topic 4.1
Page 229 Exercise 6 Answer
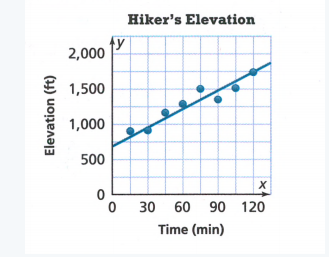
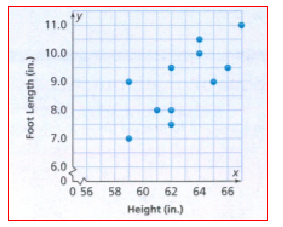
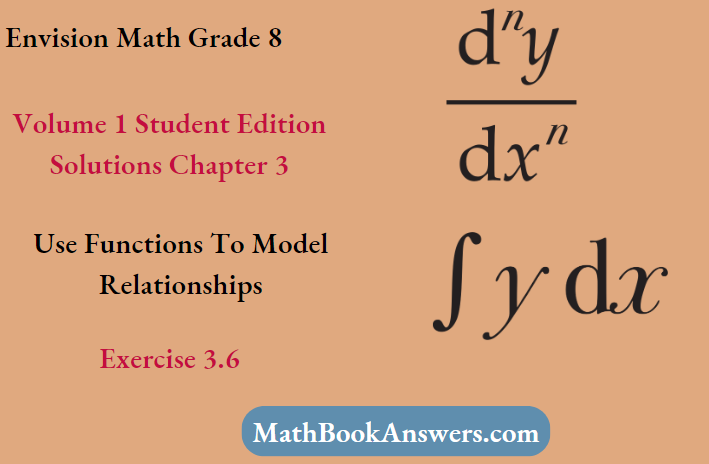
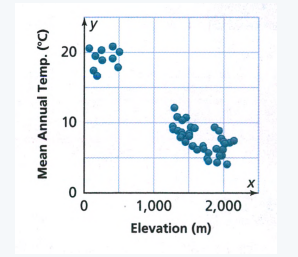
Given : a scatter plot
We have to check which statement are correct.
Given scatter plot
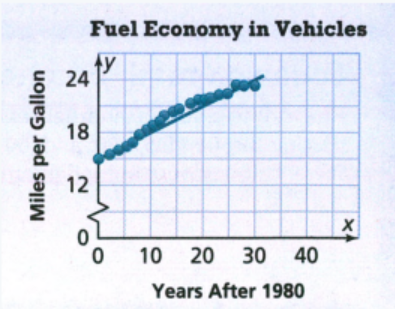
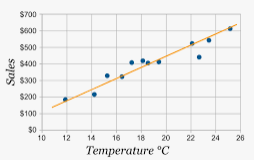
From the scatter plot it is clear that:
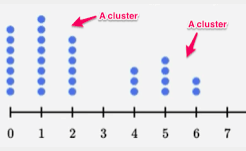
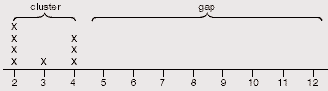
Majority of the elevations are in a cluster between 1,250 meters and 2,250 meters.
There is a gap in the data between 500 meters and 1,250 meters.
As the elevation increases the mean annual temperature decreases.
Therefore, first, second and fourth statements are correct.
First, second and fourth statements are correct
Envision Math Grade 8 Volume 1 Chapter 4 Solutions
Envision Math Grade 8 Volume 1 Student Edition Solutions Chapter 4 Investigate Bivariate Data Topic 4.1Page 230 Exercise 1 Answer
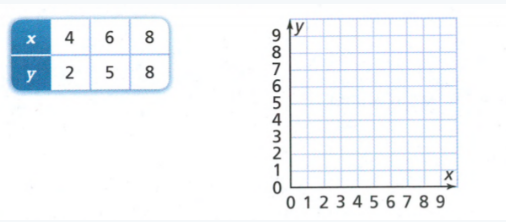
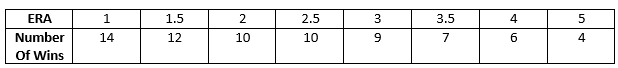
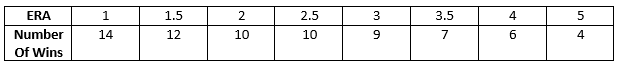
A table is given and we have to construct a scatter plot.
We will take ERA on x−axis and number of wins on y−axis and plot the graph from the data given in the table.
Given table:
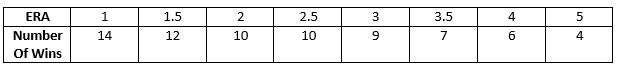
Taking ERA on x−axis and number of wins on y−axis and plotting the graph.
We get the following scatter plot:
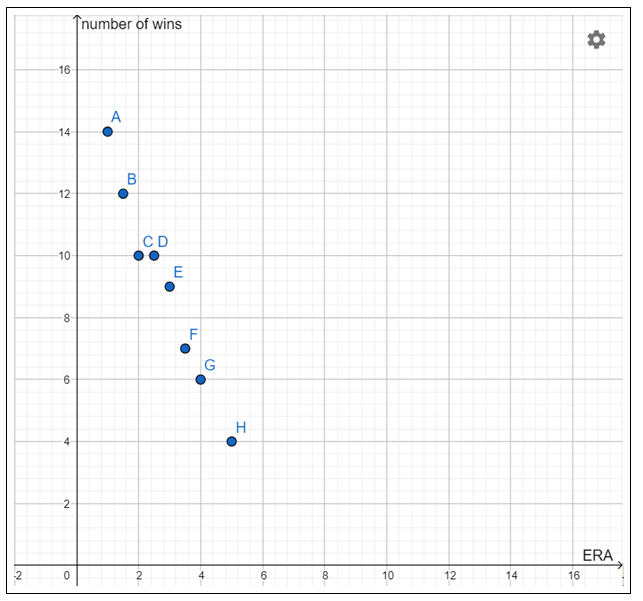
The scatter plot is :
Given: a table
We have to explain the relationship between ERA and number of wins.
From part 1(a) we have the following scatter plot
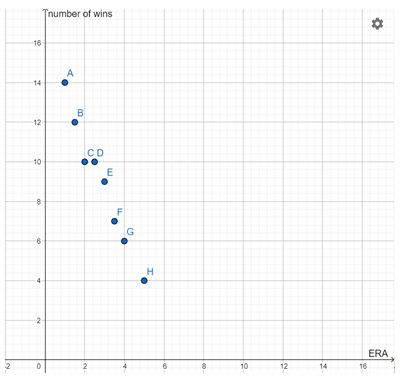
From the scatter plot it is clear as the points are closer to the trend line it is strong negative association.
We can conclude that as the ERA increases number of wins decreases.
It is strong negative association.
A table is given.
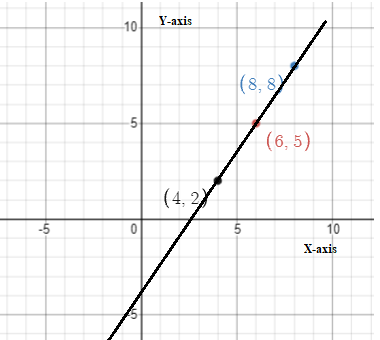
First, we will draw a trend line then we will find the slope and y-intercept using scatter plot.
Drawing trend line by placing a pencil in middle of the points on the scatter plot obtained in part 1(a).
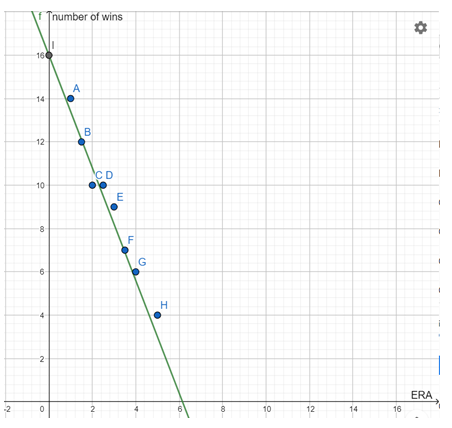
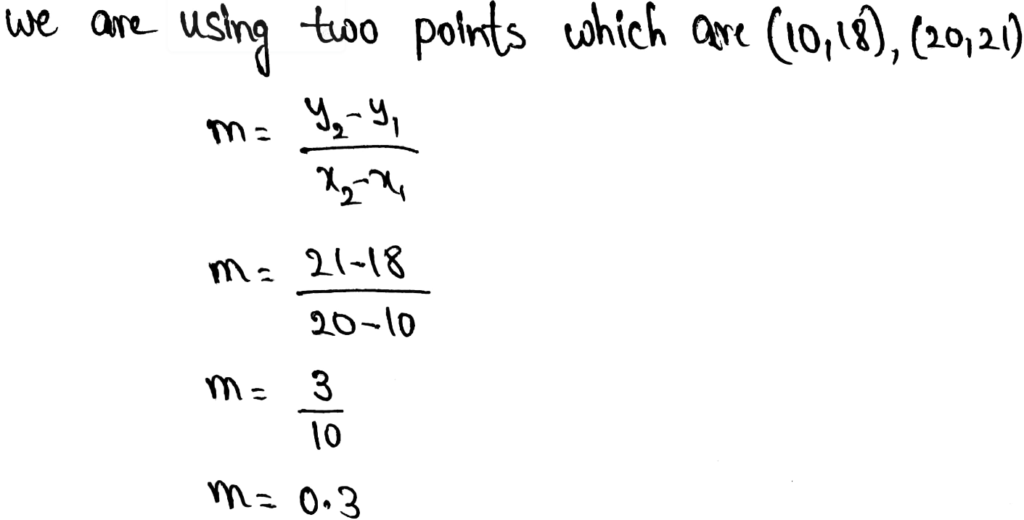
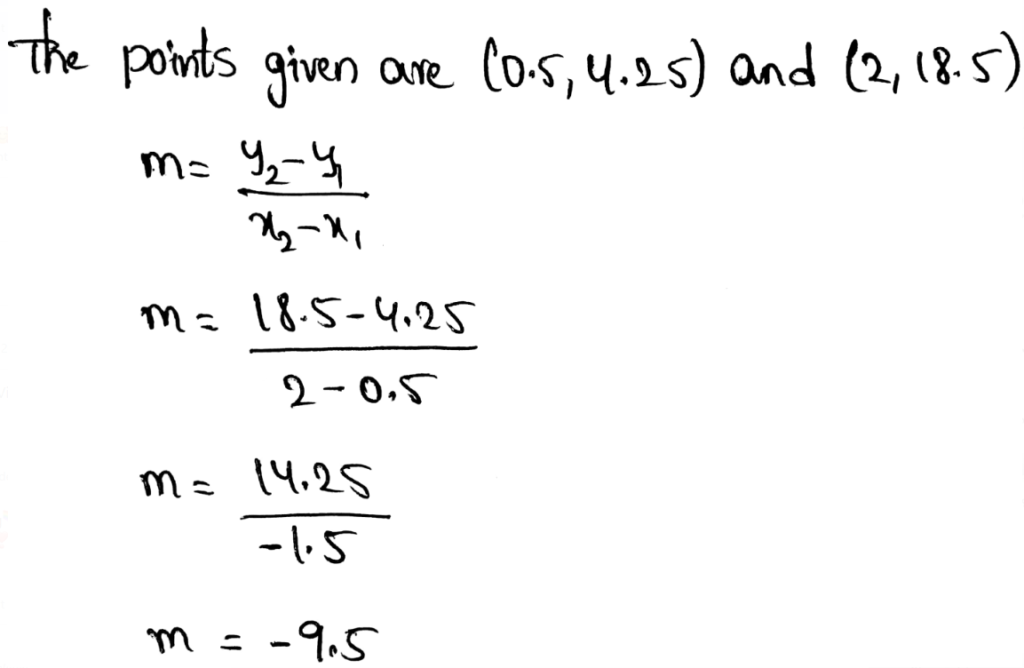
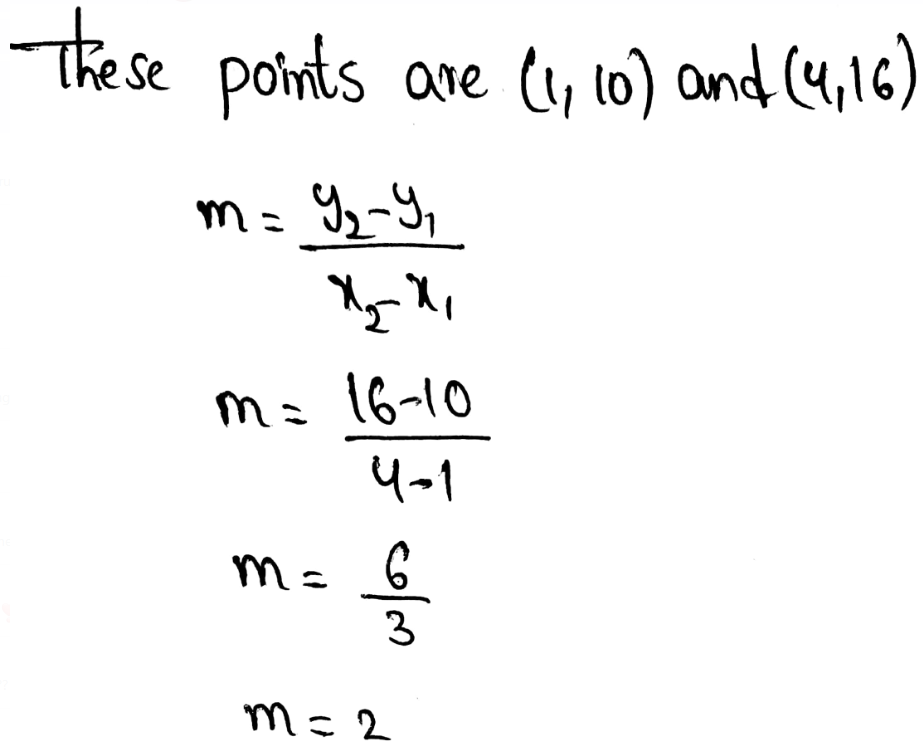
Taking points (1,14) and (2.5,10)
Slope = m=\(\frac{y_2-y_1}{x_2-x_1}=\frac{10-14}{2.5-1}=-2.6\)
Substituting values of slope and y-intercept in y=mx+c
We get the equation:
y = −2.6x + 16
Given ERA is 6, therefore, x = 6
Substituting x = 6 in y = −2.6x + 16
We get,
y = −2.6(6) + 16 = 0.4
Therefore, the number of wins of a pitcher with an ERA of 6 is 0.4.
Scatter plot with trend line:
The equation is y = −2.6x + 16
The number of wins of a pitcher with an ERA of 6 is 0.4
Investigate Bivariate Data Envision Math Solutions
Envision Math Grade 8 Volume 1 Student Edition Solutions Chapter 4 Investigate Bivariate Data Topic 4.1Page 231 Exercise 1 Answer
Given: a table of poll results
We have to use the table and describe the poll result.
Given table
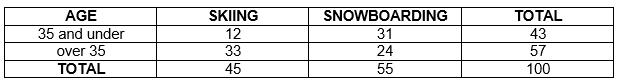
From the table it is clear that there are 43 people that are under 35 or are 35 years old and there are 57 people that are older than 35 years old.
Therefore, we can say that majority of the people are over 35 years old.
Majority of the people are over 35 years old.
Given: a table of poll results
We have to determine that what information the owner can get from the table.
Given table
From the table it is clear that:
Most of the people that are 35 or under 35 years old are there for snowboarding.
Most of the people that are older than 35 years are there for skiing
Therefore, we can say that most of the people that are under 35 or are 35 years old, they prefer snowboarding and the people that are older than 35 years, they prefer skiing.
Most of the people that are under 35 or are 35 years old, they prefer snowboarding and the people that are older than 35 years, they prefer skiing.
Given: a table of poll results
The majority of people that come to ski resort are over 35 years old, and they prefer skiing.
The rest of the people are 35 or under 35 years old and they prefer snowboarding over skiing.
Overall snowboarding is preferred over skiing.
The majority of people that come to ski resort are over 35 years old, and they prefer skiing.
The rest of the people are 35 or under 35 years old and they prefer snowboarding over skiing.
Overall snowboarding is preferred over skiing.
Envision Math Grade 8 Chapter 4.1 Explained
Envision Math Grade 8 Volume 1 Student Edition Solutions Chapter 4 Investigate Bivariate Data Topic 4.1 Page 231 Exercise 1 Answer
Given table:
we have to use a different method to show the relationship between people’s age and the activity they prefer.
To display the data to show the relationship between people’s age and the activity they prefer we can use any other kind of diagram other than the table.
We can use any kind of diagram to show the relationship between people’s ages and which activity they prefer.
Page 232 Question 1 Answer
We have to explain how does a two-way frequency table show the relationships between sets of paired data.
Two-way frequency tables are a visual representation of the possible relationships between two sets of categorical data.
The categories are labeled at the top and the left side of the table, with the frequency (count) information appearing in the four (or more) interior cells of the table. The “totals” of each row appear at the right, and the “totals” of each column appear at the bottom.
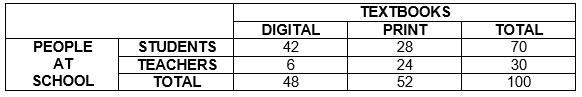
For example: you conducted a survey at your school asking 100 people, whether they prefer digital or print textbooks.
Out of 100 people 42 students and 6 teachers like digital textbooks and 28 students and 24 teachers prefer print textbooks.
Here, teacher and students are one category (row category) and digital and print textbook are second type of category (column category).
Constructing two-way frequency table for this survey we get:
Explained how does a two-way frequency table show the relationships between sets of paired data.
Page 232 Exercise 1 Answer
Given table:
We have to complete the two-way frequency table by simply calculating the data missing in rows and columns.
Given table is :
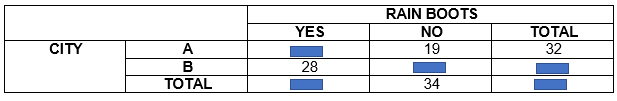
The total of a row is represented on the right
Therefore, 32 − 19 = 13
13 is the value which will goes into top left corner.
The total of a column is represented at the bottom
Therefore, total YES votes are 13 + 28 = 41.
Total NO votes are 34
Therefore, 34 − 19 = 15
15 will go into middle of NO column.
Total votes of city B are 28 + 15 = 43
We know that total number of people are 75.
The complete two-way frequency table is:
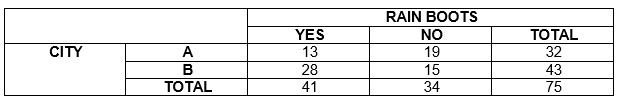
The complete two-way frequency table is:
Envision Math Grade 8 Volume 1 Student Edition Solutions Chapter 4 Investigate Bivariate Data Topic 4.1 Page 233 Exercise 2 Answer
Given: in total 100 students were asked.
Out of the 100 students, 19 girls rode in a car, 7 girls rode the bus, and 27 girls took the train.
Out of the boys, 12 took the train, 25 rode in a car and 10 rode the bus.
We have to construct a two-way frequency table.
We will simply write the given data in the table and we have to tell which mode of transportation is more preferred.
Given: out of the 100 students, 19 girls rode in a car, 7 girls rode the bus, and 27 girls took the train.
Out of the boys, 12 took the train, 25 rode in a car and 10 rode the bus.
Total students asked = 100
Constructing the two-way frequency table by writing the given data into the table.
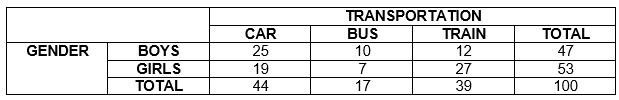
From the table it is clear that most preferred transport (used) is car, out of 100 students that were asked 44 students go by car.
Two-way frequency table:
Most used mode of transportation is the car.
Page 232 Exercise 1 Answer
Given: two-way frequency table

We have to tell what pattern do we see from the table.
Given table:
From the table it is clear that most of the people have rain boots, out of 75 people 41 people have rain boots.
Most of the people own rain boots.
Solutions For Envision Math Grade 8 Bivariate Data
Envision Math Grade 8 Volume 1 Student Edition Solutions Chapter 4 Investigate Bivariate Data Topic 4.1 Practice Page 234 Exercise 1 Answer
we have to explain how does a two-way frequency table show the relationship between sets of paired categorical data.
Two-way frequency tables are a visual representation of the possible relationships between two sets of categorical data.
The categories are labeled at the top and the left side of the table, with the frequency (count) information appearing in the four (or more) interior cells of the table. The “totals” of each row appear at the right, and the “totals” of each column appear at the bottom.
The two-way frequency table show the relationship between paired categorical data in the columns and rows.
The total the bottom right corner displays the total number of each cell in the table.
A two-way frequency table show the relationship between sets of paired categorical data.
In the columns and rows and the table makes easy to draw a conclusion and makes interpretation easy.
Page 234 Exercise 3 Answer
We have to explain how we can use the structure of a two-way frequency table to complete it.
First, we look for the column or row which have two values in it and to find the last value we use simple addition and subtraction to complete the table.
Let’s suppose we have a two-way frequency table with some data already in it.
We know that, the total of a row is displayed on the right and the total of a column is displayed on the bottom.
When we have two values in the row or column, we can find the last value by simple addition or subtraction, the total count is always equal to the sum of values in row or column.
The total count is always equal to the sum of values in row or column.
we can use addition or subtraction to find the last value when two values are already given in a row or column.
Envision Math Grade 8 Volume 1 Student Edition Solutions Chapter 4 Investigate Bivariate Data Topic 4.1 Page 234 Exercise 4 Answer
Given:
Total players are 60
We have to complete the table.
We can us addition or subtraction to complete the table, first we will look for that row or column which have two values in it.
Total number of players are 60.
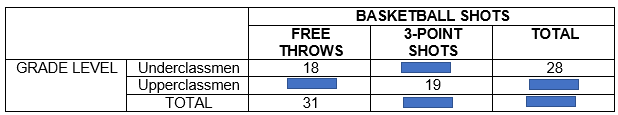
Given table:
First, we will look for that row or column which have two values in it.
The total number of underclassmen students are 28
Therefore, 28 − 18 = 10
10 is the value that will come in the middle of first row.
The total number of the free throws are 31
Therefore, 31 − 18 = 13
13 is the value that will come in the middle of first column.
The total number of upperclassmen will be 13 + 19 = 32
Total number of 3-point shots are = 10 + 19 = 29
We know total players are 60.
Putting the calculated values in the table we get,
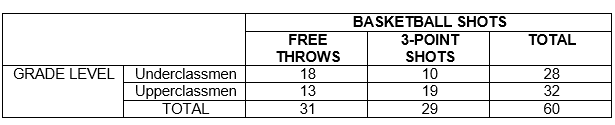
The complete two-way frequency table is:
Envision Math Grade 8 Chapter 4 Homework Answers
Envision Math Grade 8 Volume 1 Student Edition Solutions Chapter 4 Investigate Bivariate Data Topic 4.1 Page 234 Exercise 5 Answer
Given a table:
We have to explain whether the given statement is correct or not.
Given statement is false.
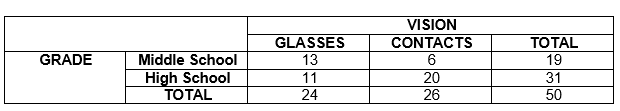
Given table is:
From the table it is clear that there are more high school students that wear contacts than middle school students that wear glasses
20 > 13
The given statement is incorrect.
Page 235 Exercise 8 Answer
Given:
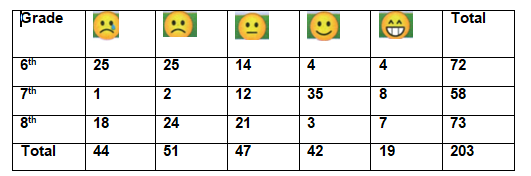
We are given the frequency table. We have to solve this frequency table to conclude the survey.
We consider the blank as x
Now,
The second column,
25 + 2 + 24 = x
∴ x = 51
The third column,
14 + x + 21 = 47
∴ x = 47 − 35
x = 12
Now, we consider the Total row,
We have:
44 + 51 + 47 + 42 + x = 203
∴ x = 203 − 184
x = 19
Now, we consider the fifth column:
We have:
4 + 8 + x = 19
∴ x = 19 − 12
x = 7
Now, we consider the third row:
We have:
x + 24 + 21 + 3 + 7 = 73
∴ x = 73 − 55
x = 18
Now, we consider the first column:
We have:
x + 1 + 18 = 44
∴ x = 44 − 19
x = 25
Now, we consider the first row:
We have:
25 + 25 + 14 + x + 4 = 72
∴ x = 72 − 68
x = 4
Now we consider the total column:
We have:
72 + x + 73 = 203
∴ x = 203 − 145
x = 58
Now, we consider the second row:
We have:
1 + 2 + 12 + x + 8 = 58
∴ x = 58 − 23
x = 35
Envision Math Grade 8 Chapter 4.1 Practice Problems
Envision Math Grade 8 Volume 1 Student Edition Solutions Chapter 4 Investigate Bivariate Data Topic 4.1 Page 235 Exercise 9 Answer
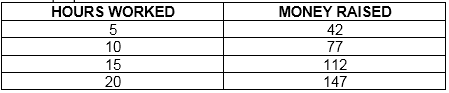
We are given the frequency table. Observe the given table to solve this question.
We observe the table.
The students studying for 1 to 2 hours are 147 in number.
The number of studying for 5 to 6 hours are 104
The statement states that more students study for 5 to 6 hours than for 1 to 2 hours.
This statement is False as the number of students studying for 5 to 6 hours is less than 1 to 2 hours.
The statement is false because the number of students studying for 1 to 2 hours is more than 5 to 6 hours.
Page 236 Exercise 10 Answer
Given:
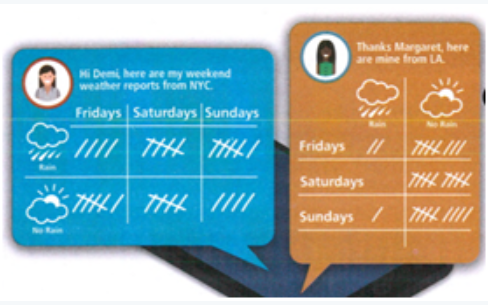
Construct a single, two-way frequency table to show the results.
We observe rain in NYC on Friday is 4, Saturday is 5, and Sunday is 6.
We observe that no rain in NYC on Friday is 6, Saturday is 5 and Sunday is 4.
We observe that rain in LA on Friday is 2, Saturday is 0 and Sunday is 1.
We observe that no rain in LA on Friday is 8, Saturday is 10, Sunday is 9.
Given:
Through A.
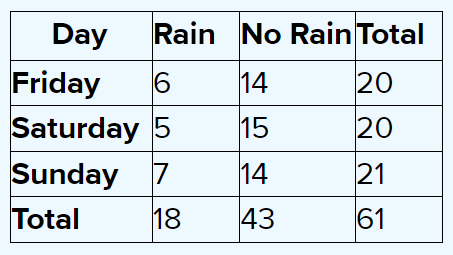
We observe the frequency table from a.
We understand that the day that received the least rain in both LA and NYC is Saturday.
Saturday only has rain as 5.
Saturday saw the least rain in both NYC and LA with frequency as 5.
How To Solve Envision Math Grade 8 Topic 4.1
Page 236 Exercise 11 Answer
Given:
The total number of animals was 74.
There were 39 cats out of which 25 were male and 14 were female.
There were 35 dogs out of which 23 were male and 12 were female.
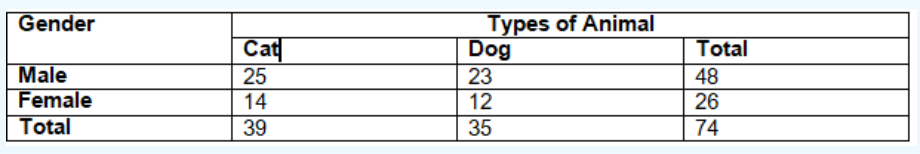
This is the required table.
Given:
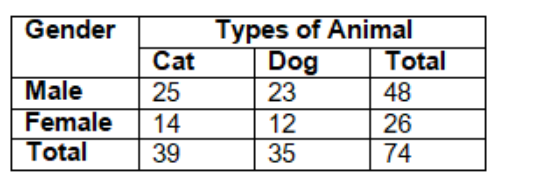
Through A.
We observe the frequency table from a.
We understand that the total number of males at the adoption centre is 48.
We also observe that the total number of females at the adoption centre is 26.
We observe that for males there a greater need for adoption at the centre.
Males have a greater need to be adopted at the adoption center because the number of males at the adoption center is greater than the females.