Carnegie Learning Algebra II Student Skills Practice 1st Edition Chapter 3 Skills Practice
Page 329 Problem 1 Answer
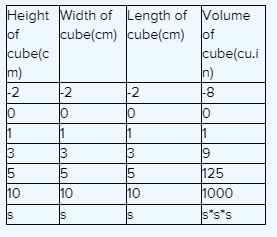
To give an example of the polynomial function, we need to write a function which has a variable with exponent.
The exponent should be positive and should be an integer.
We can choose any constant and can perform any operation like add, subtract, multiply or divide
We will first choose a variable from a to z.
Let us assume that we choose, x
Now let us assume that we choose the exponent to be 2
Our polynomial will look like x2
Let us assume we choose the constant to be 5 and operation to be add.

Our polynomial will look like x2+5
Example of polynomial function is x2+5.
Carnegie Learning II Chapter 3 Exercise 3.3 solutions
Carnegie Learning Algebra II Student Skills Practice 1st Edition Chapter 3 Exercise 3.3 Skills Practice Page 329 Problem 2 Answer
To find a quartic function we will first write the variable with exponent as 4.
After this we can add other variable with exponents less than 4.
We can also perform any operation like add, subtract, divide or multiply with constants.
Let us select a variable x We have to use the exponent as 4
we get our function: x4
Now we can add more variable x with exponent value less than 4.
let’s choose 2 as exponent and operation as subtract we get,x4+x2
On adding a constant 6 we get,x4+x2+6
The example of quartic function is: x4+x2+6
Page 329 Problem 3 Answer
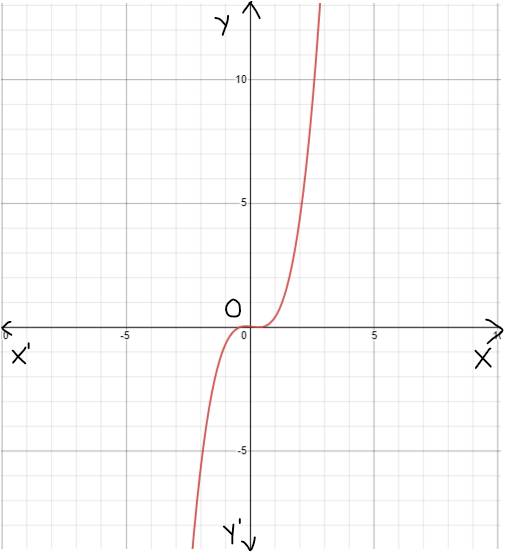
Given : The function c(x)=x3,h(x)=−3c(x)
and the reference points to plot the graph.
Our objective is to find whether the given function is even, odd, or neither.
Procedure:
Use the reference points to find the points of h(x).
Use the given points to create a table to plot the graph for each function.
Check whether the function satisfies the even function condition or odd function condition.
Finally, we came with a solution.
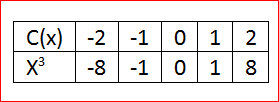
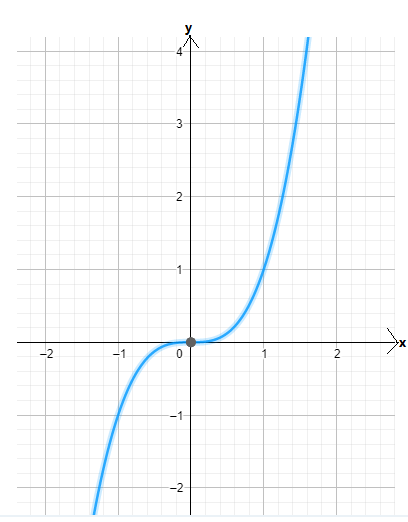
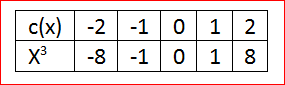
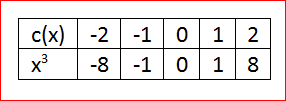
Let us find the values for c(x)=x3
for x=0, we have
⇒c(0)=03
⇒c(0)=0
forx=1, we have
⇒c(1)=13
⇒c(1)=1
for x=2, we have
⇒c(2)=23
⇒c(2)=8
By this method we can have the table of values
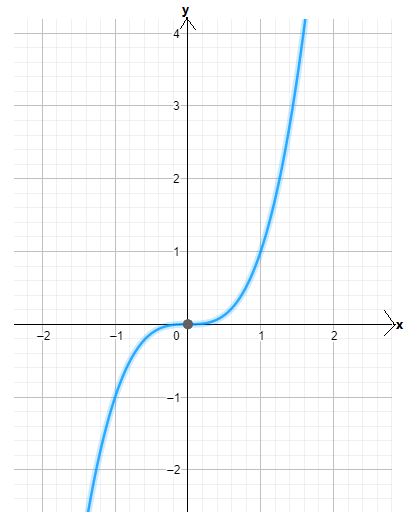
On creating the graph, we get
Let us find the values for
h(x)=−3c(x)
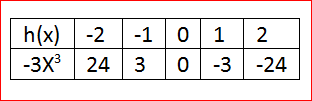
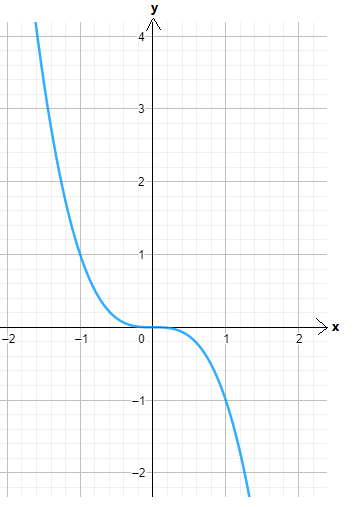
h(x)=−3x3
for x=0, we have
⇒h(0)=−3(0)3
⇒h(0)=0
for x=1, we have
⇒h(1)=−3(1)3
⇒h(1)=−3
for x=2, we have
⇒h(2)=−3(2)3
⇒h(2)=−24
On creating the graph, we get
Since both the graphs have 180-degrees symmetry about the origin, both are odd functions.
And they satisfy the condition f(x)=−f(x)
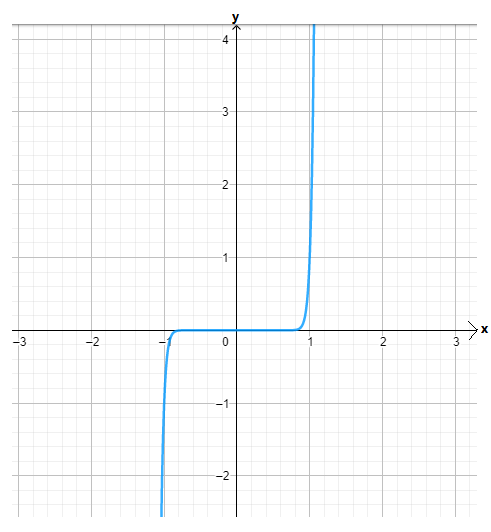
c(x)=x3
c(−x)=−x3
⇒−x3
This function satisfies the odd function condition.
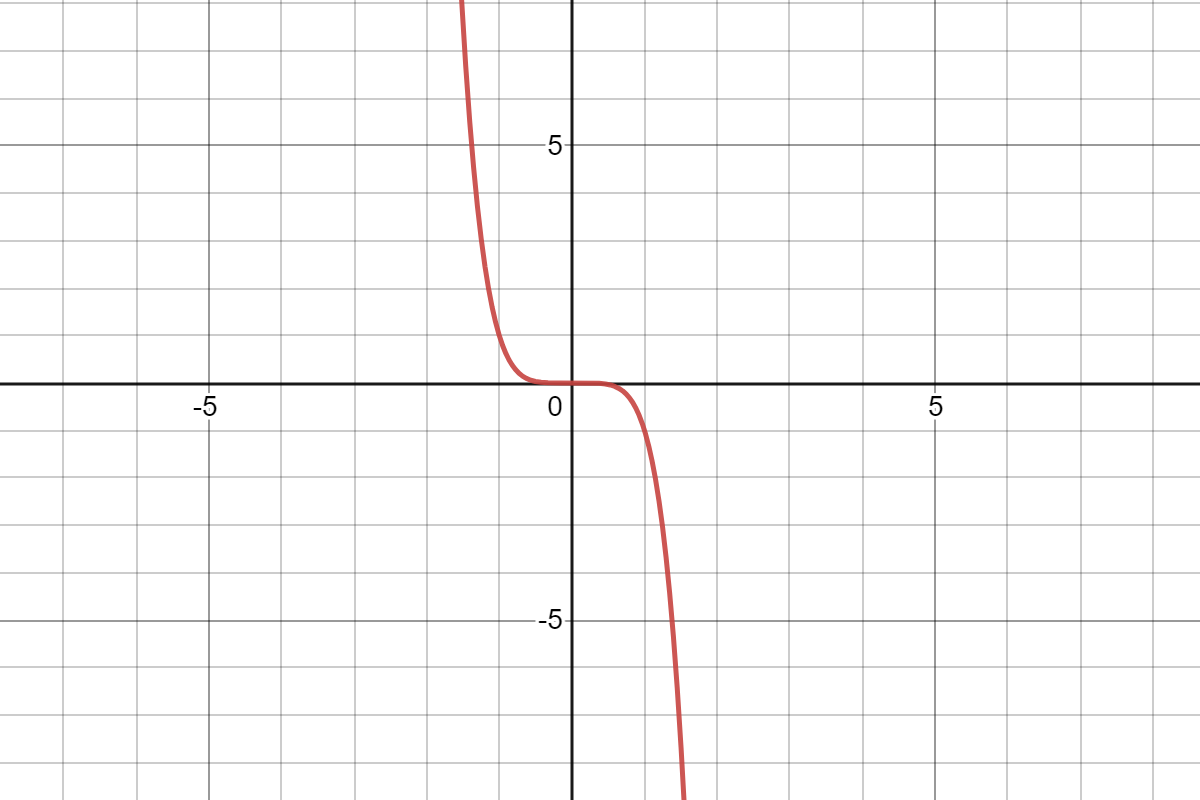
h(x)=−3x3
h(−x)=−3(−x3)
⇒3x3
This function also satisfies the odd function condition.
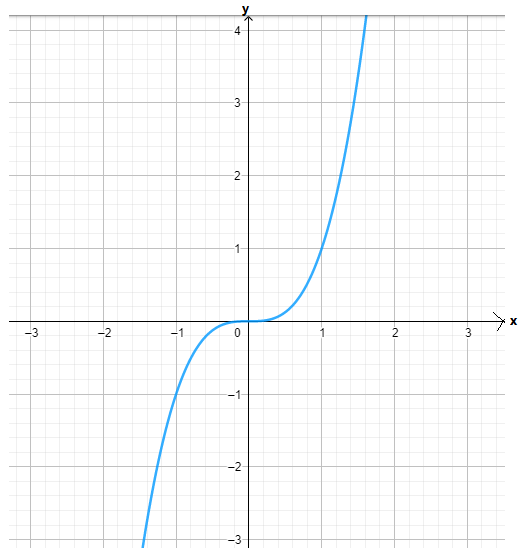
The graph of the functions c(x) and h(x) is sketched below
Both the functions c(x) and h(x) are odd functions.
Carnegie Learning Algebra II Student Skills Practice 1st Edition Chapter 3 Exercise 3.3 Skills Practice Page 330 Problem 4 Answer
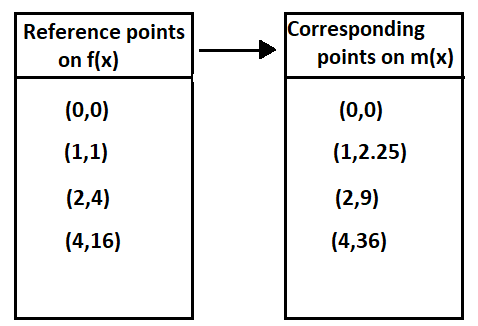
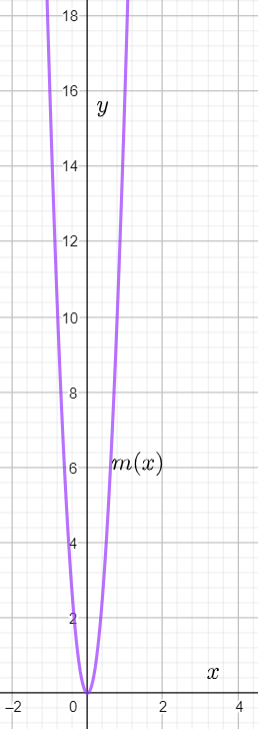
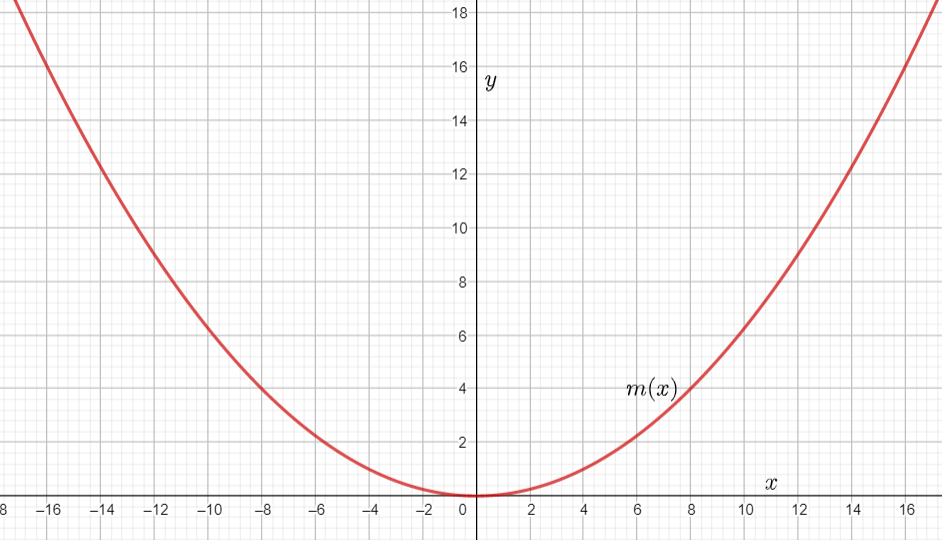
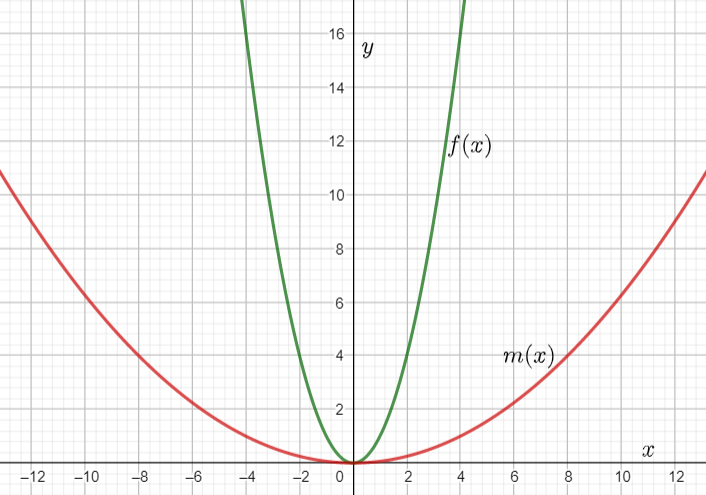
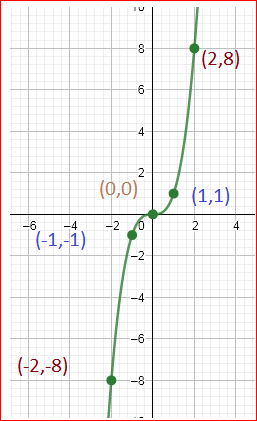
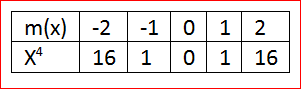
Given : The function m(x)=x4,n(x)=m(x)+4 and the points to plot the graph.
Our objective is to find whether the given function is even, odd, or neither.
Procedure:
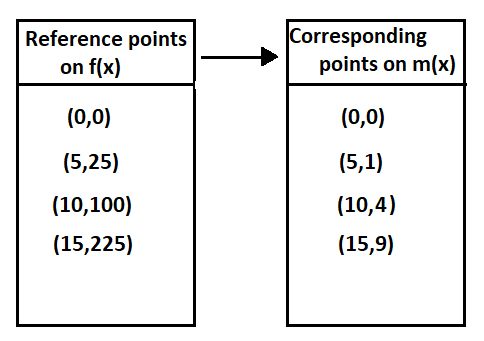
Use the reference points to find the points of n(x).
Use the given points to create a table to plot the graph for each function.
Check whether the function satisfies the even function condition or odd function condition.
Finally, we came with a solution.
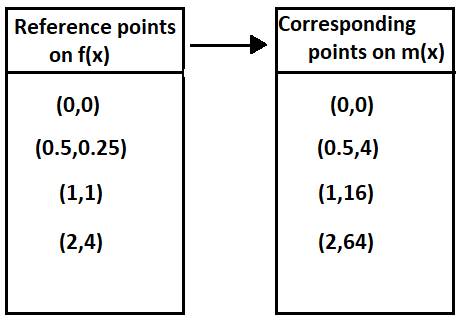
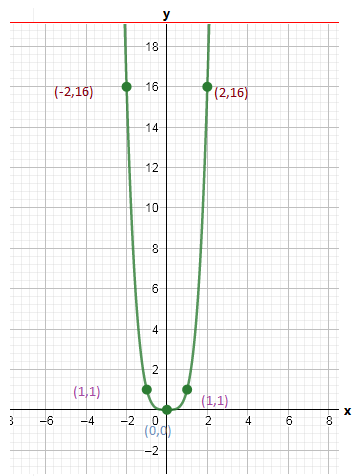
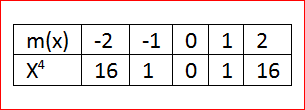
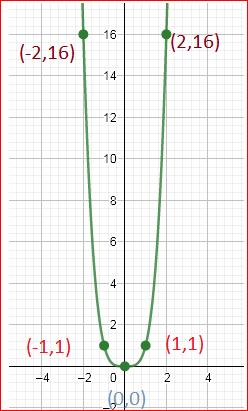
Let us create the table of values for m(x)=x4
Given the points,When x=0, we have
m(0)=04
⇒0
When x=1, we have
m(1)=14
⇒1
When x=2, we have
m(2)=24
⇒16
By this method we can have the table of values
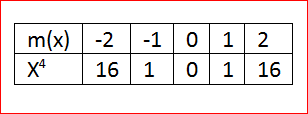
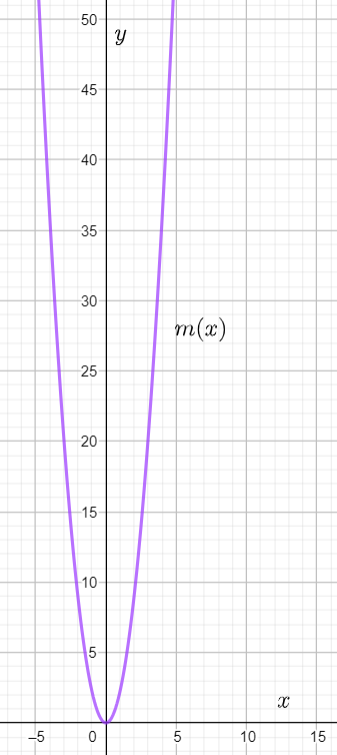
By using this table we can plot the graph as

Let us create a table of values for
n(x)=m(x)+4
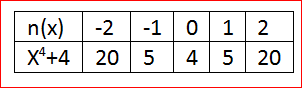
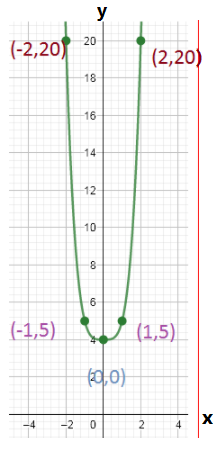
n(x)=x4+4
Whenx=0, we have
n(0)=04+4
n(0)=4
When x=1, we have
n(1)=14+4
n(1)=5
When x=2, we have
n(2)=24+4
n(2)=20
By this method we can have the table of values
By using this points plot the graph as

Use the conditions in both the functions.
m(x)=x4
m(−x)=(−x)4
m(−x)=x4
This function satisfies the condition f(−x)=f(x)
so, the function m(x) is even.
n(x)=x4+4
n(−x)=(−x)4+4
n(−x)=x4+4
This function also satisfies the condition f(−x)=f(x)
so, the function n(x) is even.
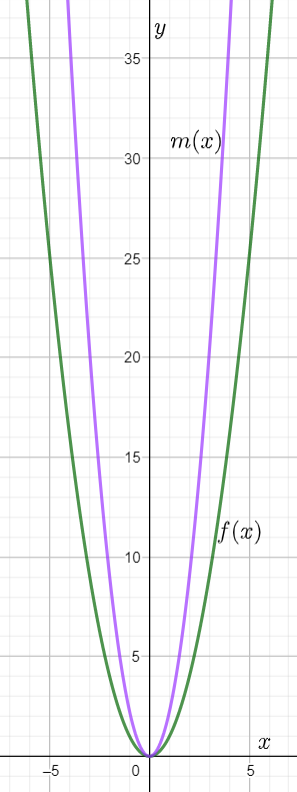
We have found that both the functions m(x) and n(x) are even because these functions satisfy the even function condition and they are symmetrical about the y−axis.
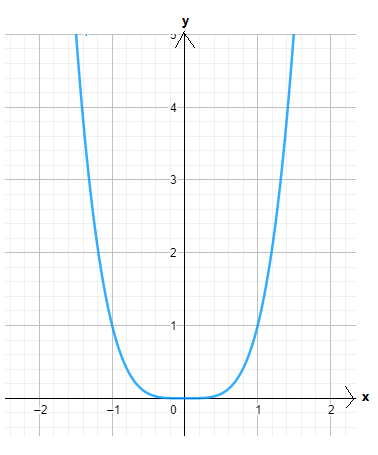
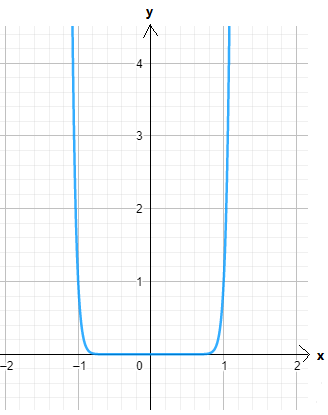
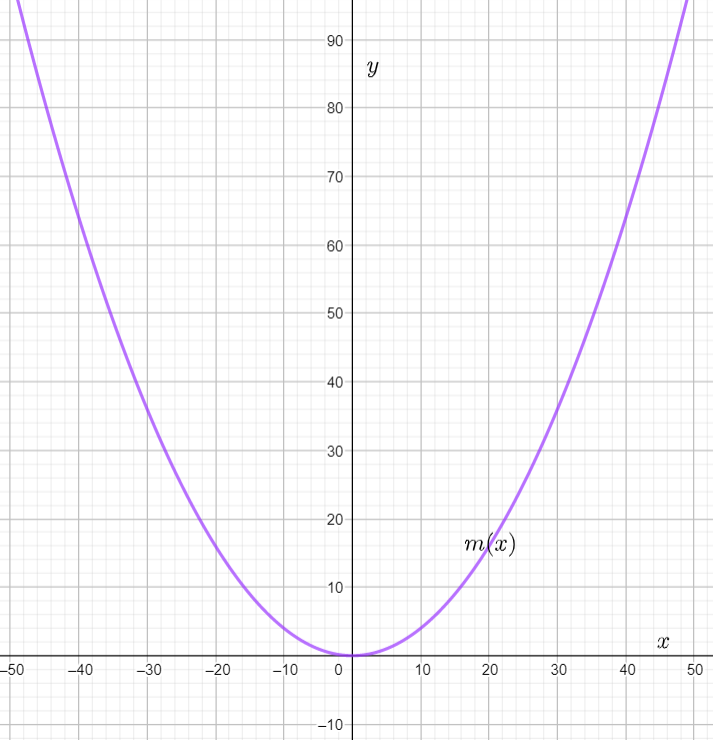
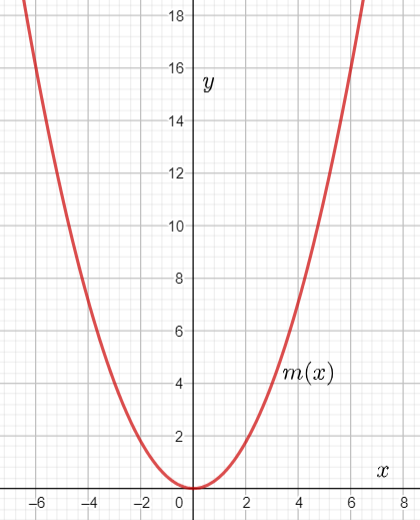
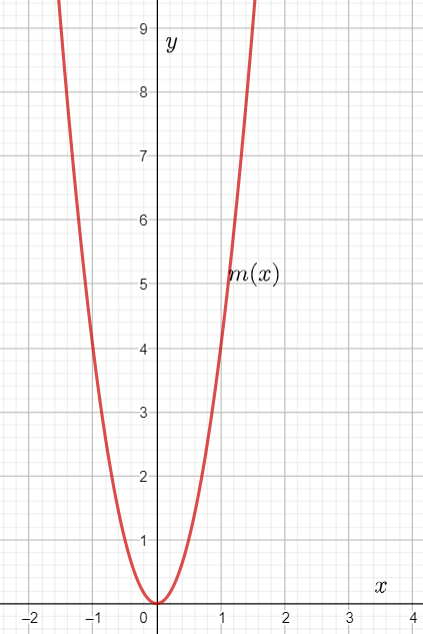
The graph of m(x)=x4 is
The graph of n(x)=m(x)+4 is
Skills Practice Carnegie Learning II Exercise 3.3 answers
Carnegie Learning Algebra II Student Skills Practice 1st Edition Chapter 3 Exercise 3.3 Skills Practice Page 330 Problem 5 Answer
Given: The function c(x)=x3,g(x)=1/4 c(x) and the reference points to plot the graph.
Our objective is to find whether the given function is even, odd, or neither.
Procedure:
Use the reference points to find the points of g(x).
Use the given points to create a table to plot the graph for each function.
Check whether the function satisfies the even function condition or odd function condition.
Finally, we came with a solution.
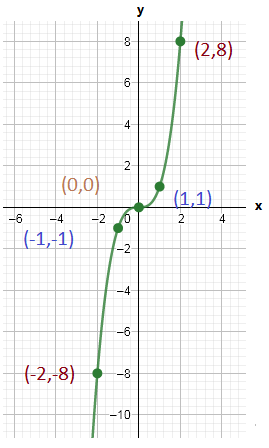
Let us create the table of values forc(x)=x3
When x=0, we have
c(0)=03
c(0)=0
When x=1, we have
c(1)=13
c(1)=1
When x=2, we have
c(2)=23
c(2)=8
By this way we can have the table of va
By using this table we can plot the graph as

Let us create the table of values for
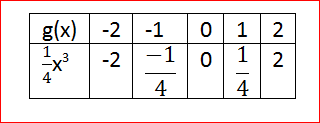
g(x)=1/4 c(x)
g(x)=1/4x3
When x=0, we have
g(0)=1/4(0)3
g(0)=1/4
Whenx=1, we have
g(1)=1/4(1)3
g(1)=1/4
Whenx=2, we have
g(2)=1/4(2)3
g(2)=2
By this way we can have the table of values
By using this table we can plot the graph as
Use the conditions in both the functions
c(x)=x3
c(−x)=(−x)3
c(−x)=−x3
This function satisfies the conditionf(−x)=−f(x)
so, the function c(x) is odd.
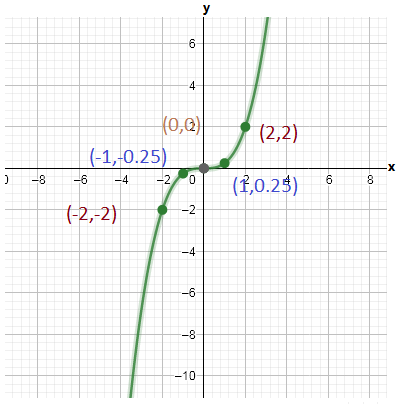
g(x)=1/4x3
g(−x)=1/4(−x)3
g(−x)=−1/4x3
This function satisfies the condition f(−x)=−f(x) so, the function g(x) is odd.
We have found that both the functions c(x) and g(x) are odd because these functions satisfy the odd function condition and they are symmetrical about the origin.
The graph of c(x)=x3 is
The graph of g(x)=1/4 c(x) is
Page 330 Problem 6 Answer
Given: The function m(x)=x4,p(x)=m(x−1) and the reference points to plot the graph.
Our objective is to find whether the given function is even, odd, or neither.
Procedure:
Use the reference points to find the points of p(x).
Use the given points to create a table to plot the graph for each function.
Check whether the function satisfies the even function condition or odd function condition.
Finally, we came with a solution.
Let us create the table of values for m(x)=x4
When x=0,we have
m(0)=04
m(0)=0
When x=1, we have
m(1)=14
m(1)=1
By this way we can have the table of values
By using the table we can plot the graph as
Let us create the table of values for
p(x)=m(x−1)
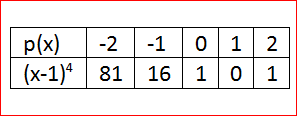
p(x)=(x−1)4
When x=0, we have
p(0)=(0−1)4
p(0)=1
Whenx=1, we have
p(1)=(1−1)4
p(1)=0
By this way we can have the table of values
By using the table we can plot the graph as

Use the condition in both the functions
m(x)=x4
m(−x)=(−x)4
m(−x)=x4
This function satisfies the condition f(−x)=f(x) so, the function is even.
p(x)=(x−1)4
p(−x)=(−x−1)4
This function does not satisfy both the conditions, hence this function is neither odd nor even.
We have found that the function m(x) is an even function and p(x) is neither odd nor even.
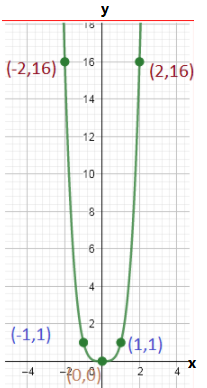
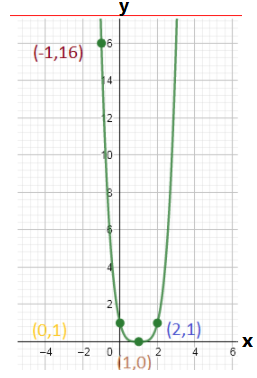
The graph of m(x)=x4 is

The graph of p(x)=m(x−1) is
Carnegie Learning II practice questions Chapter 3 Exercise 3.3
Carnegie Learning Algebra II Student Skills Practice 1st Edition Chapter 3 Exercise 3.3 Skills Practice Page 331 Problem 7 Answer
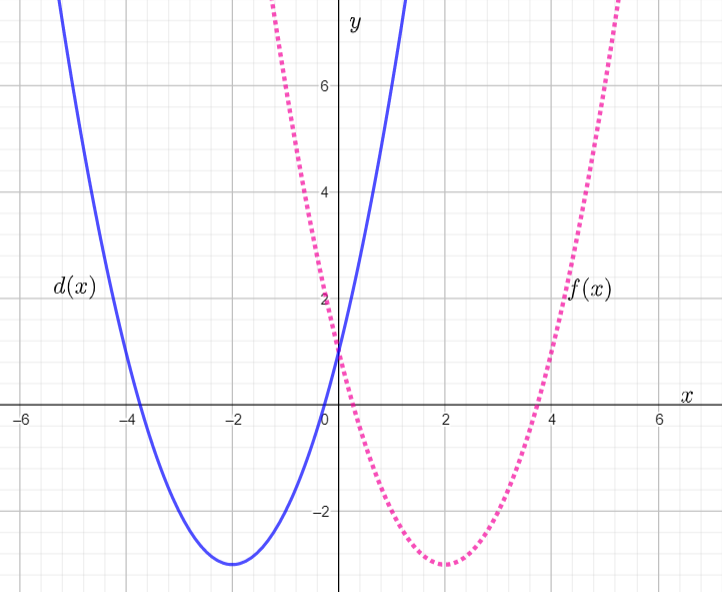
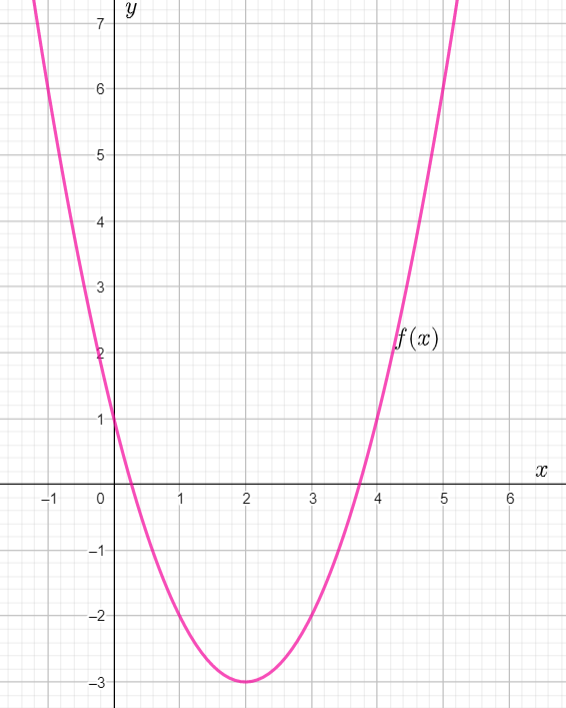
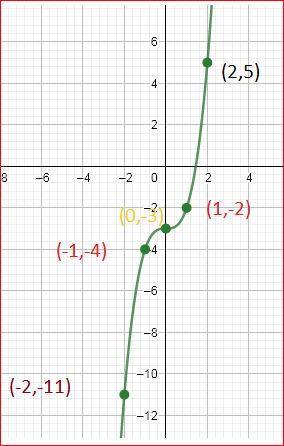
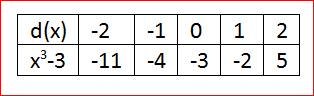
Given: The function c(x)=x3,d(x)=c(x)−3 and the reference points to plot the graph.
Our objective is to find whether the given function is even, odd, or neither.
Procedure:
Use the reference points to find the points of d(x).
Use the given points to create a table to plot the graph for each function.
Check whether the function satisfies the even function condition or odd function condition.
Finally, we came with a solution.
Let us create the table of values for c(x)=x3
Whenx=0, we have
c(0)=03
c(0)=0
When x=1, we have
c(1)=13
c(1)=1
By this way we can have the table of values
By using the table plot the graph as
Let us create the table of values for
d(x)=c(x)−3
d(x)=x3−3
Whenx=0, we have
d(0)=03−3
d(0)=−3
Whenx=1, we have
d(1)=13−3
d(1)=−2
By this way we can have the table of val
By using the table we can plot the graph as
Use the condition in both the functions
c(x)=x3
c(−x)=(−x)3
c(−x)=−x3
This function satisfy the conditionf(−x)=−f(x)
so, the function is odd.
d(x)=x3−3
d(−x)=(−x)3−3
d(−x)=−x3−3
This function does not satisfy both the conditions so, the function is neither even nor odd.
We have found that the function c(x) is an odd function because this satisfy the odd function condition and it is symmetrical about the origin and the function d(x) is neither even nor odd.
Page 331 Problem 8 Answer
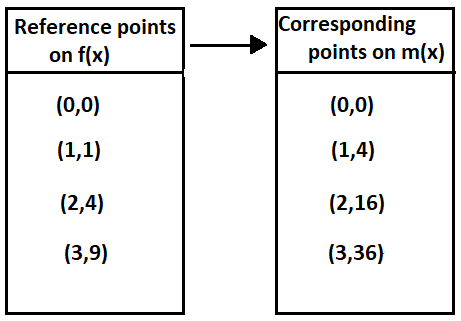
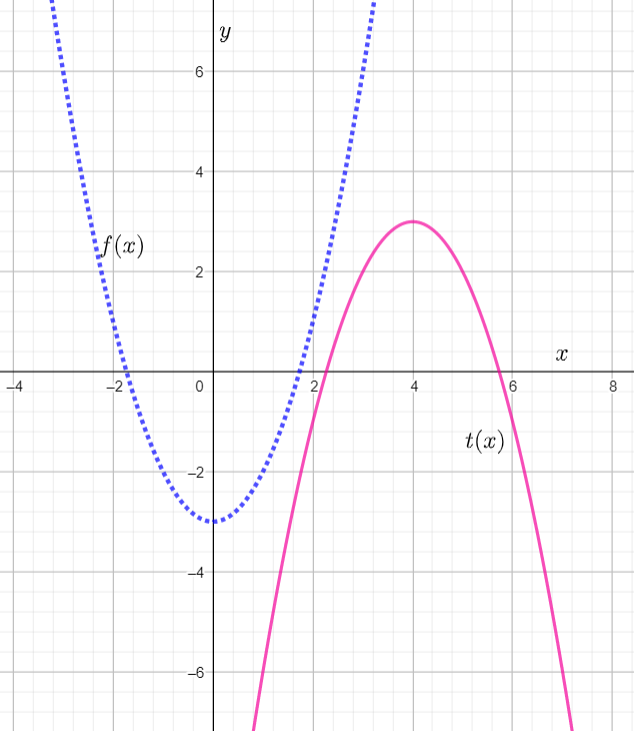
Given : The function m(x)=x4,t(x)=m(−2x) and the reference points to plot the graph.
Our objective is to find whether the given function is even, odd, or neither.
Procedure:
Use the reference points to find the points of.
Use the given points to create a table to plot the graph for each function.
Check whether the function satisfies the even function condition or odd function condition.
Finally, we came with a solution.
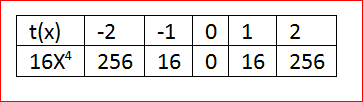
Let us create a table of values form(x)=x4
Whenx=0, we have
m(0)=04
m(0)=0
By this way we can have the table of values as
By using the table we can plot the
Let us create the table of values for
t(x)=m(−2x)
t(x)=(−2x)4
t(x)=16x4
When x=0, we have
t(0)=16(0)4
t(0)=0
By this way we can have the table of values as
By using the table we can plot the graph as
Use the condition in both the functions
m(x)=x4
m(−x)=(−x)4
m(−x)=x4
This function satisfy the condition f(−x)=f(x) hence this function is even.
t(x)=16x4
t(−x)=16(−x)4
t(−x)=16x4
This function satisfy the conditionf(−x)=f(x) hence this function is even.
We have found that both the functions are even because they satisfy the even function condition and they are symmetrical to y−axis.
Carnegie Learning Algebra II Student Skills Practice 1st Edition Chapter 3 Exercise 3.3 Skills Practice Page 332 Problem 9 Answer
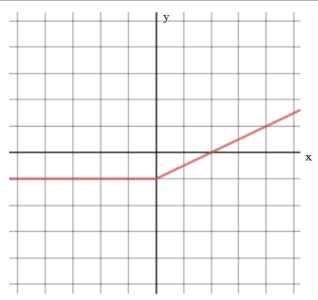
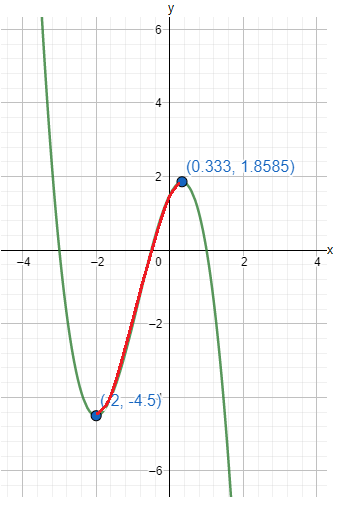
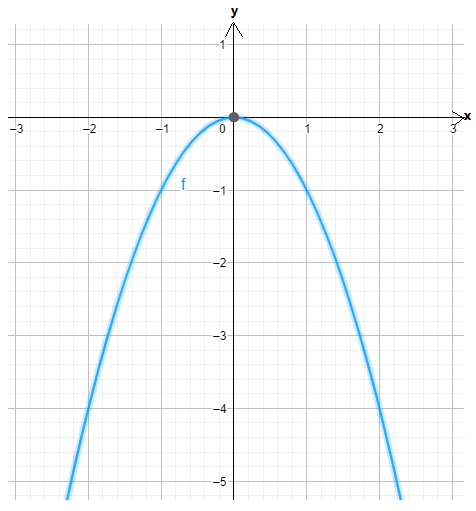
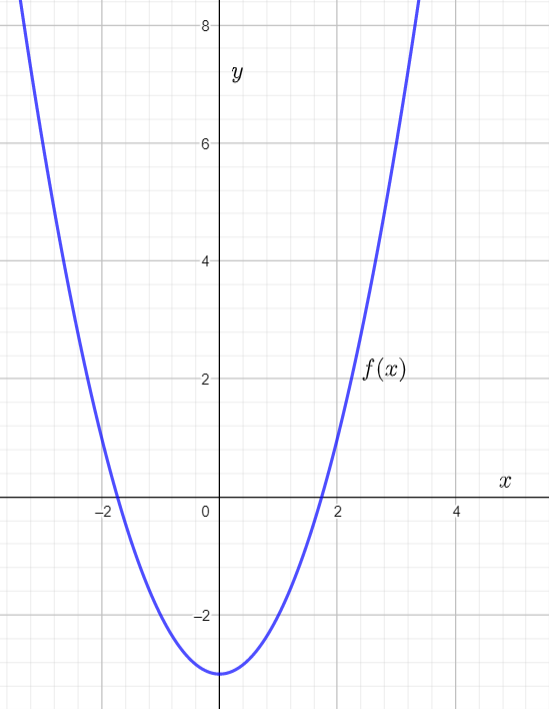
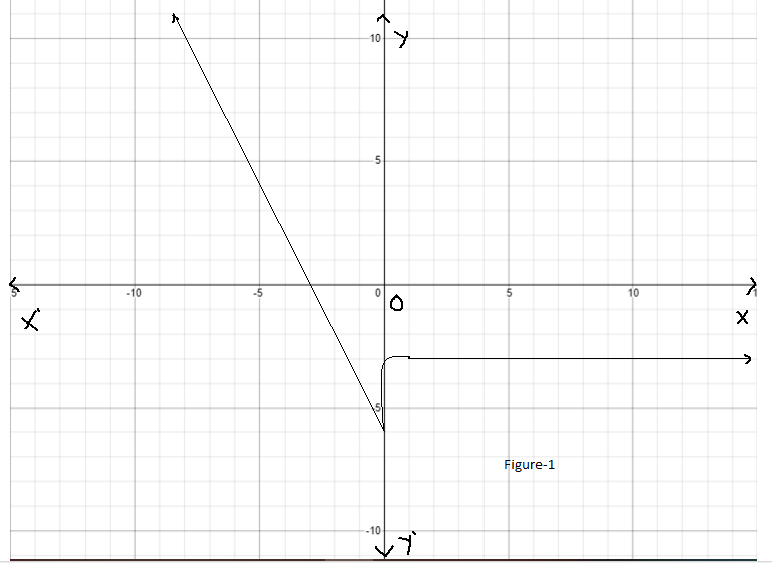
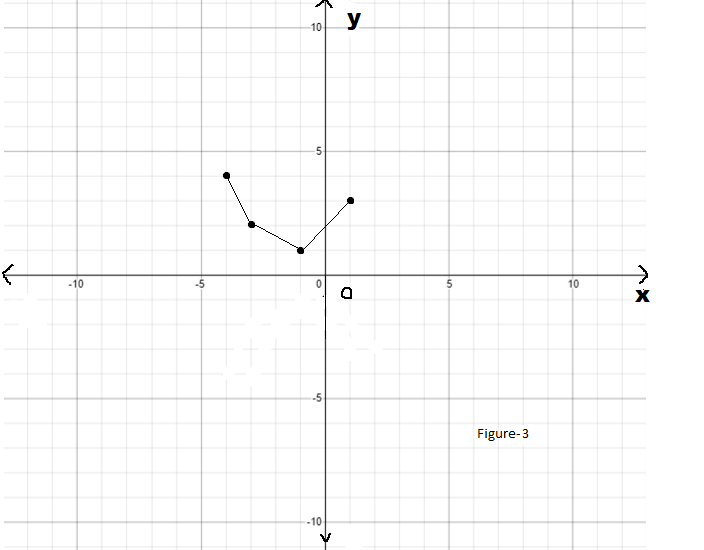
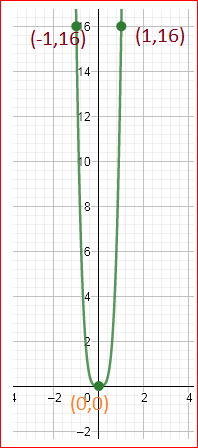
It is given the graphs of the functions g(x) and f(x). It is asked to write the function g(x) in terms of f(x).
First, observe that the function g(x) is obtained by reflecting the function f(x) about they−axis followed by a translation in the upward direction by 2 units.
Now, if the function is reflected along the y axis then the resulting function will be y=−f(x).
Now, take a translation of 2units in the upward direction.
Then the resulting function will be y=−f(x)+2.
So, to write the function g(x) in the term of the function f(x) will be g(x)=−f(x)+2.
If the function g(x) is written by the function f(x) then that will be g(x)=−f(x)+2.
Page 332 Problem 10 Answer
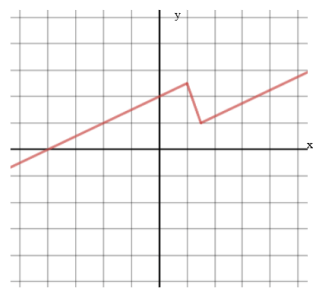
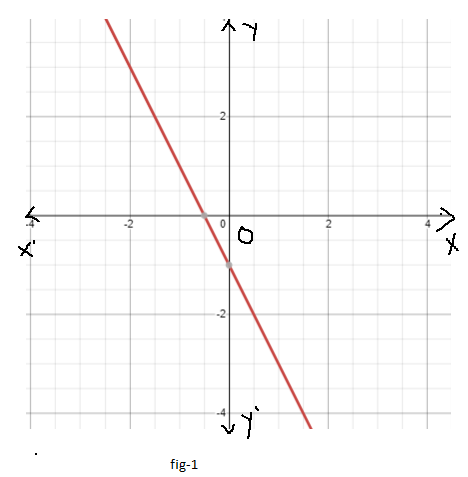
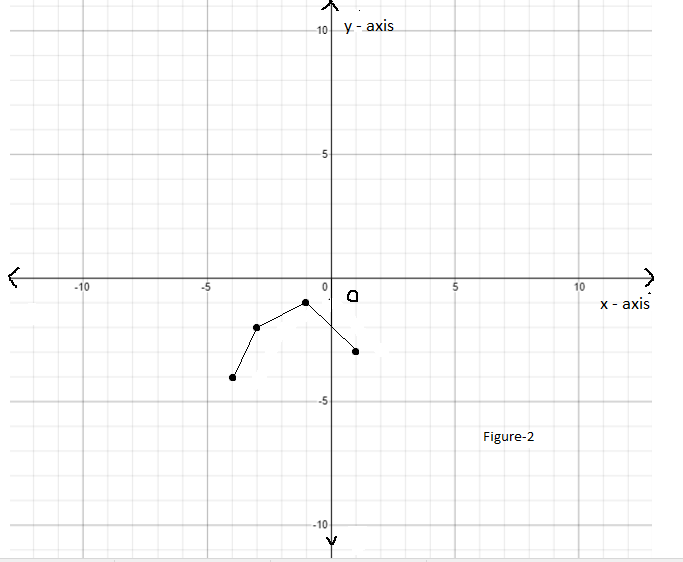
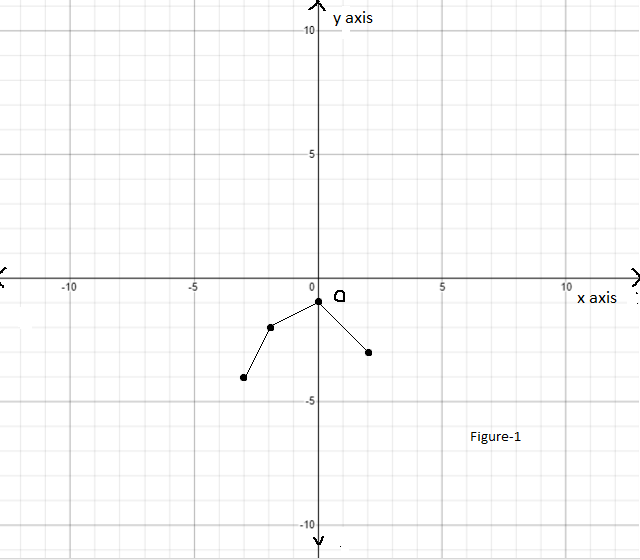
It is given the graphs of the function f(x) and g(x). It is asked to find the graph of the function g(x) in terms of f(x).
First, observe that to obtain the graph of the function g(x),f(x) is shifted 3 units at the right.
So, to obtain the function of g(x) add 3 units with the function f(x).
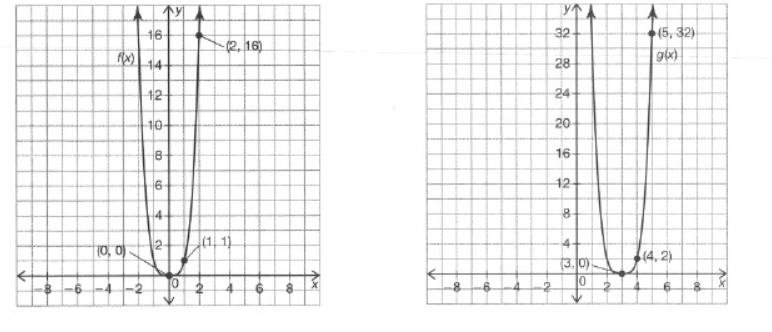
So, g(x)=f(x)+3.
The function g(x) can be written in terms of f(x) as g(x)=f(x)+3.
Page 333 Problem 11 Answer
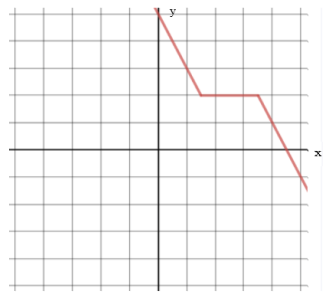
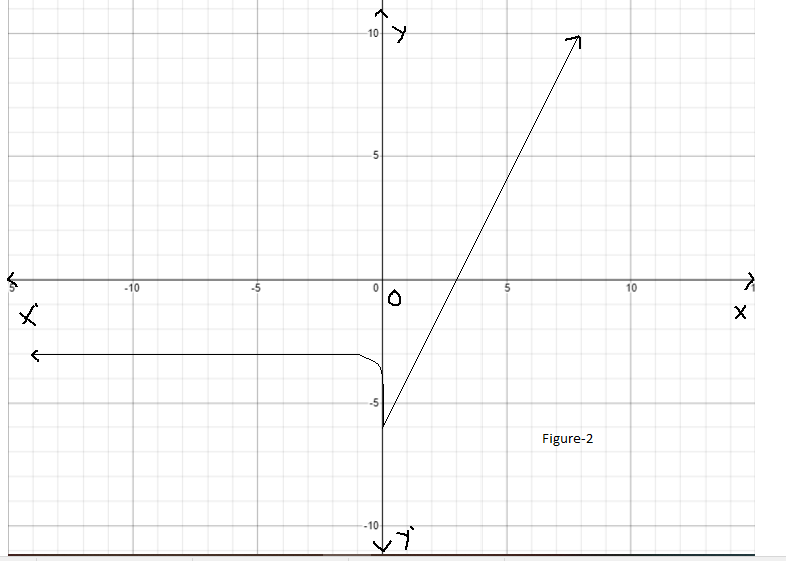
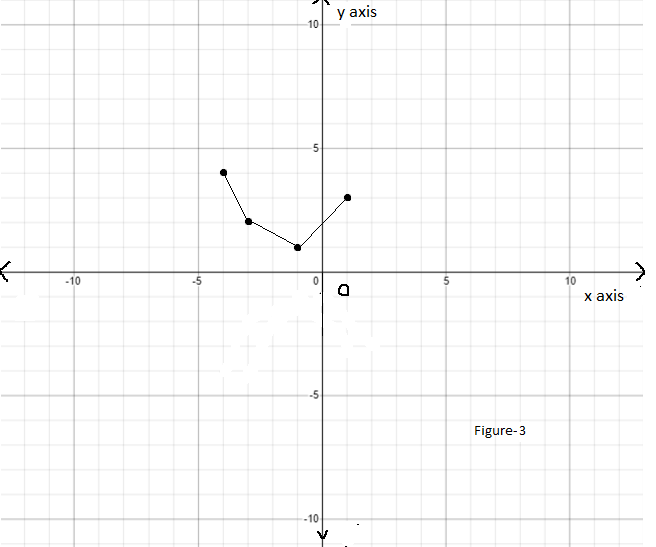
It is given the graphs of the function f(x) and g(x). It is asked to write the function g(x) in terms of f(x) .
First, observe that the function is inverted with respect axis to obtain the function.
Now, if is inverted with respect to axis then the resultant function will be.
Now, the resultant function is shifted unit in the negative direction of axis.
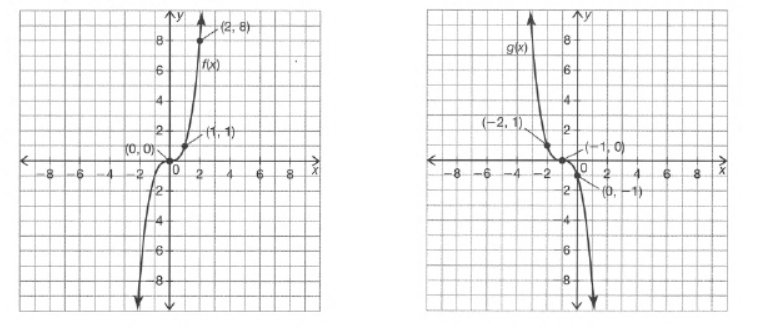
So, the resultant function will be.
So, the function for will be.
The graph of the function g(x) can be represented by the function f(x) as g(x)=−f(x+1).
Chapter 3 Exercise 3.3 Carnegie Learning II key
Carnegie Learning Algebra II Student Skills Practice 1st Edition Chapter 3 Exercise 3.3 Skills Practice Page 333 Problem 12 Answer
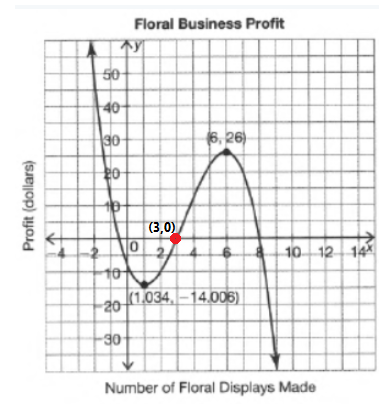
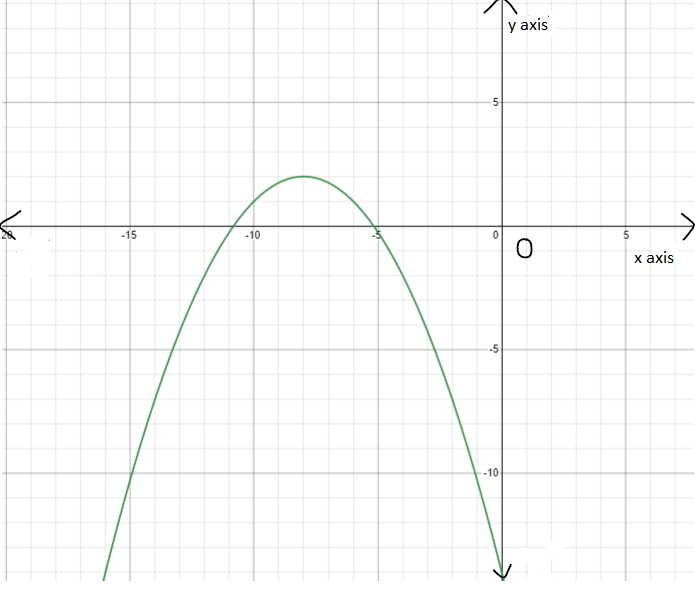
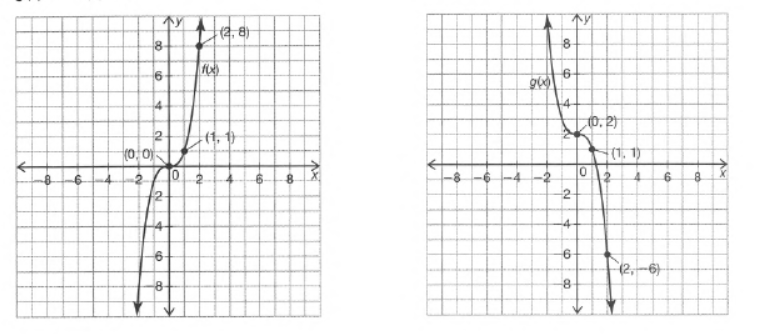
It is given the graph of the functions f(x) and g(x). It is asked to write the function g(x) in terms of f(x).
First, observe that the function g(x) is obtained by shifting and inverting the function f(x).
Now, consider that the function is shifted a units and magnified by b units.
So, the resulting function g(x) will be g(x)=bf(x+a).
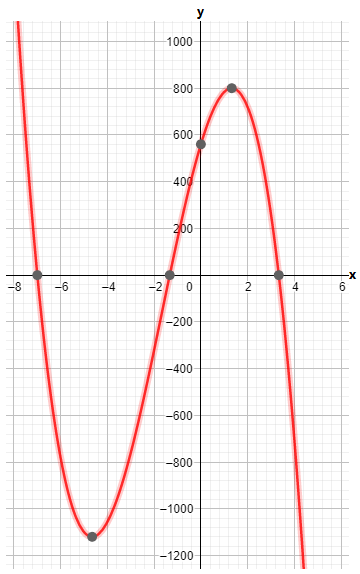
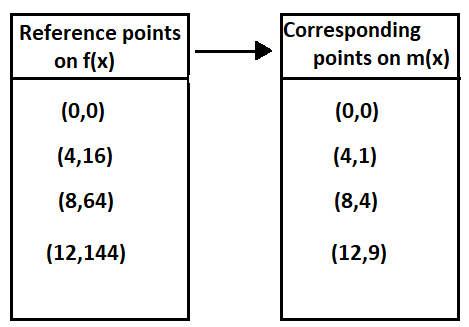
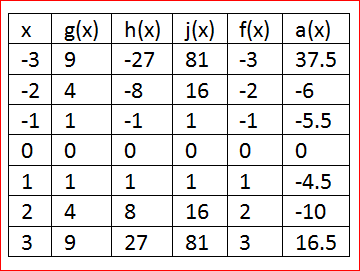
Now, from the graph of the function f(x) we have
f(0)=0, f(2)=16.
From the given graph of g(x), we have g(0)=−8, g(−2)=0 and g(−1)=−1/2.
The function of g(x) is g(x)=bf(x+a) ……. (1)
Substitutex=−2in (1).
g(−2)=bf(−2+a)
0=bf(−2+a)
Now, observe thatb≠0 otherwise, an absurd situation will arise.
So, f(a−2)=0
f(a−2)=f(0)
a−2=0
a=2
So, g(x)=f(x+2) …… (2)
Now, substitute x=0 in (2).
g(0)=bf(2)
−8=b16
b=−8/16
b=−1/2
So, the function g(x) will be g(x)=−1/2 f(x+2).
The function g(x) can be written in the term of the function f(x) as g(x)=−1/2f(x+2).
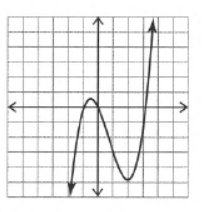
Page 334 Problem 13 Answer
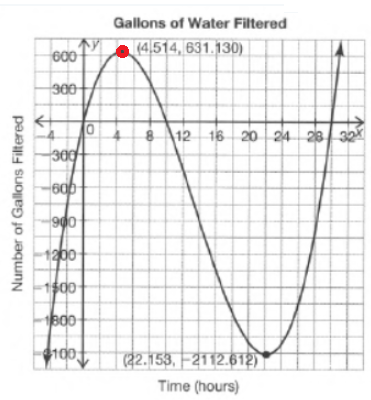
It is given the graph of the functions f(x) and g(x).
It is asked to write the function g(x) in terms of f(x).
First, observe that the function g(x) is obtained by shifting up along the yaxis followed by a magnification.
Consider that the function f(x) is shifted up along y axis at a unit a and the function f(x) is magnified at a unit b
Consider that the function of g(x) in terms of f(x) is as follows:
g(x)=f(x−1)+3
An equation for g(x) in terms of f(x) is g(x)=f(x−1)+3.
Carnegie Learning Algebra II Student Skills Practice 1st Edition Chapter 3 Exercise 3.3 Skills Practice Page 334 Problem 14 Answer
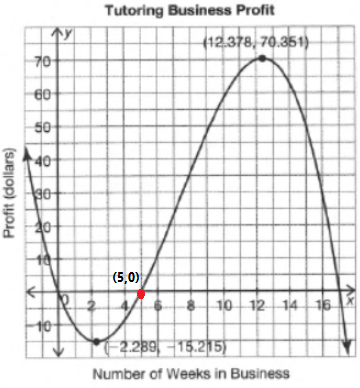
It is given the graph of the functions f(x) and g(x). It is asked to express the function g(x) in terms of f(x).
First, observe that the function g(x) is obtained by magnifying the function f(x) followed by the translation.
Consider that to obtain the function g(x) the function f(x) is magnified by b units and translated by a units.
Then the function g(x) will be g(x)=bf(x)+a.
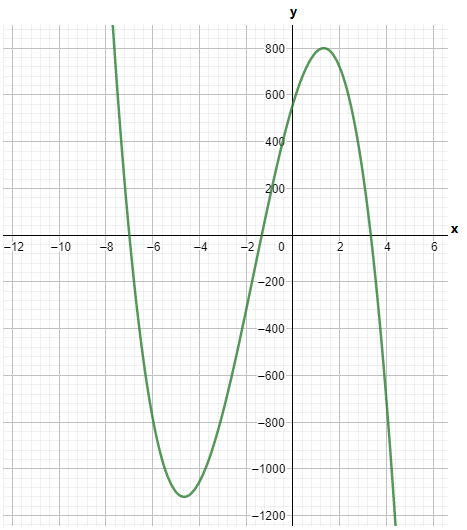
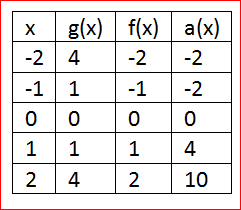
Now, observing the graph of a function f(x)
we get f(0)=−10, f(1)=−9, f(2)=54.
Consider, the function g(x)=bf(x)+a …… (1)
Substitute x=0 in equation (1).
g(0)=bf(0)+a
−24=b(−10)+a
a−10b=−24…… (2)
Substitute x=1 in the equation (1).
g(1)=bf(1)+a
−22=b(−9)+a
a−9b=−22……(3)
Solve the equation(2) and(3) .
10b−9b=24−22
b=2
Now, substitute the value of b=2 in equation (3).
a=−22+9×(2)
a=−4
So, the function g(x) will be g(x)=2f(x)−4.
The function g(x) can be expressed by the function f(x) as g(x)=2f(x)−4.
Page 335 Problem 15 Answer
Given: The functions
p(x)=x4
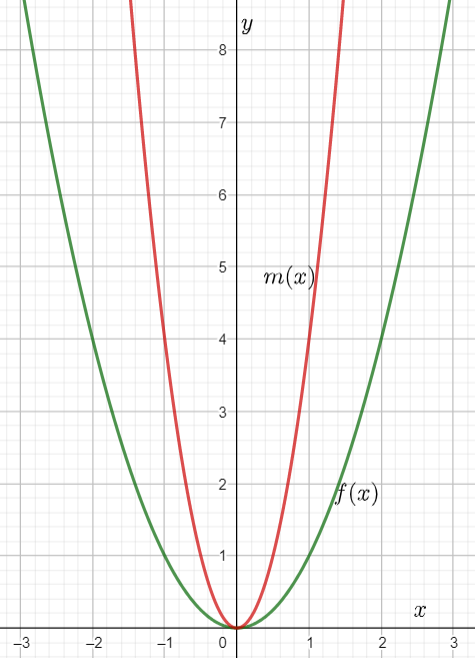
m(x)=−p(0.5x)+2
Our objective is to find the specific equation form(x)
Procedure:
Explain the transformed function using the form in the tip.
Find the value of p(0.5x). Now, find the specific equation of m(x).
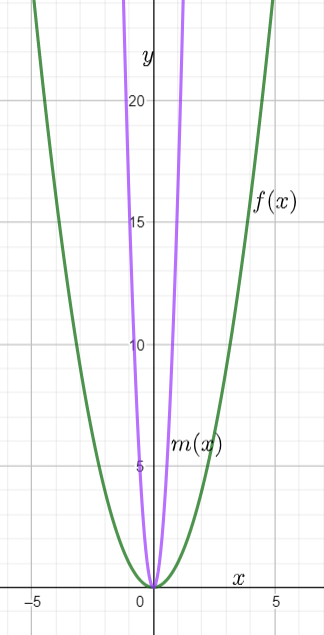
The given function is p(x)=x4 and the transformed function ism(x)=−p(0.5x)+2
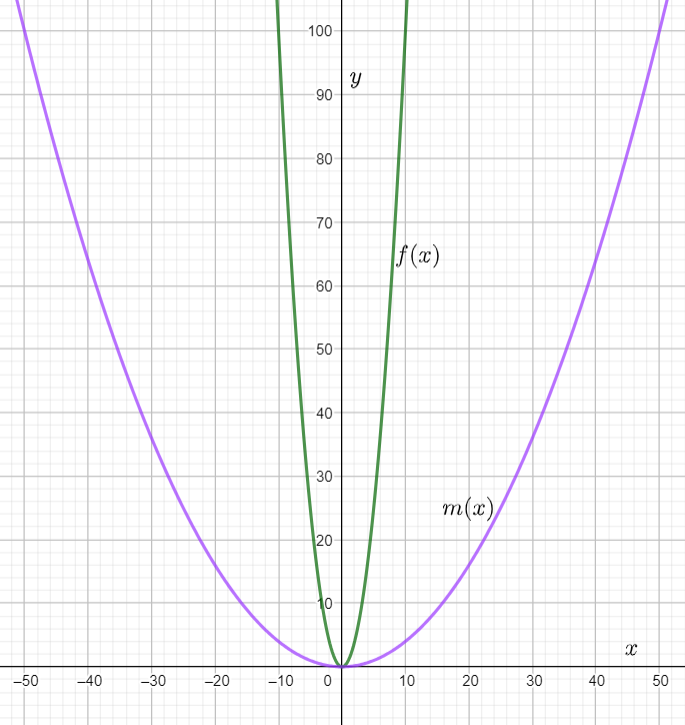
The graph of both the functions is
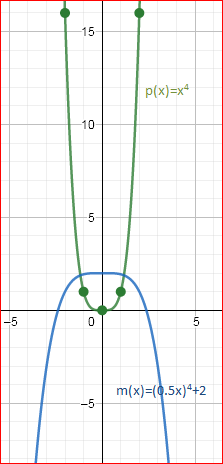
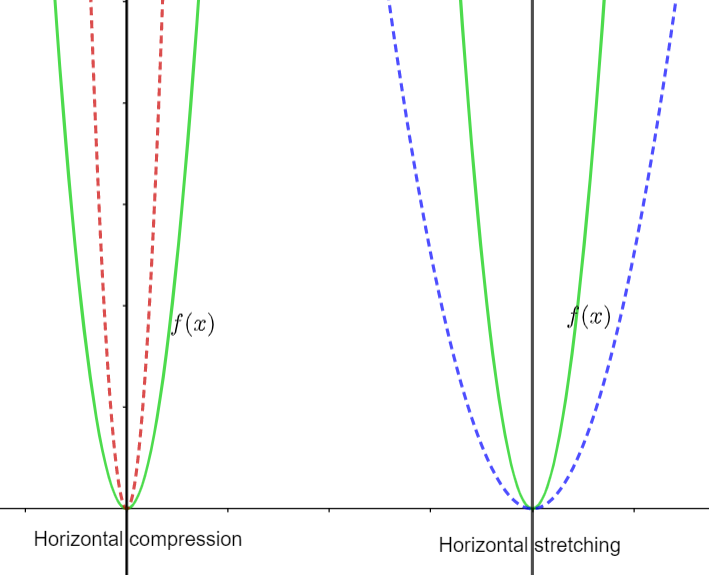
From the above graph we can conclude that the graph is horizontally stretched by a factor 2, translated two units up and reflected about the line y=2
The reflection of a function causes the graph to appear as a mirror image of the original function. That is f(−x) is a reflection of f(x) across the y−axis.
Finding the equation of m(x)
p(x)=x4
p(0.5x)=p(0.5x)4
p(0.5x)=0.0625x4
m(x)=−p(0.5x)+2
m(x)=−0.0625x4+2
We have found the specific equation of m(x) as−0.0625x4+2.
Carnegie Learning Algebra II Student Skills Practice 1st Edition Chapter 3 Exercise 3.3 Skills Practice Page 335 Problem 16 Answer
Given: The functions
p(x)=x3
m(x)=4p(x−3)−5
Our objective is to find the specific equation of m(x).
Procedure:
Explain the transformed function using the form in the tip.
Find the value of 4p(x−3). Now, find the specific equation of m(x).
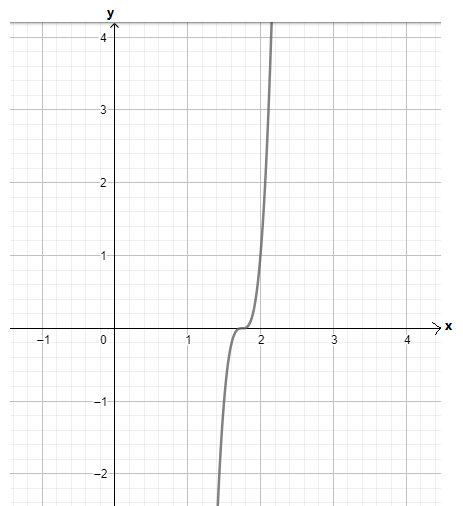
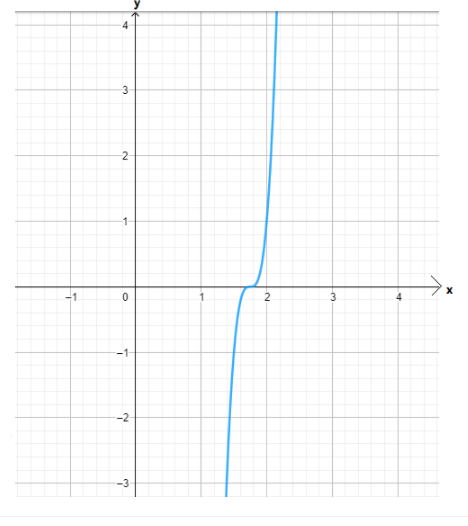
The given function is p(x)=x3 and the transformed function is m(x)=4p(x−3)−5
The graph of both the functions is

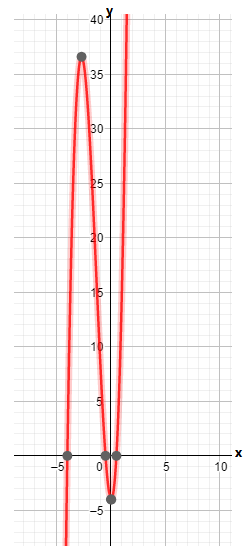
From the above graph we can conclude that the graph is vertically shifted downwards by 5 units, the graph is vertically stretched by a factor of 4 units and the graph is horizontally shifted to the right by 3 units.
Finding the equation of m(x)
p(x)=x3
4p(x−3)=4p(x−3)3
m(x)=4p(x−3)−5
m(x)=4(x−3)3−5
We have found the specific equation of m(x) as 4(x−3)3−5.
Page 335 Problem 17 Answer
Given : The functions
p(x)=x5
m(x)=0.5p(−x)+4
Our objective is to find the specific equation of m(x)
Procedure:
Explain the transformed function using the form in the tip.Find the value of p(−x).Now, find the specific equation of m(x).
The given function is p(x)=x5 and the transformed function ism(x)=0.5p(−x)+4
The graph of both the functions is
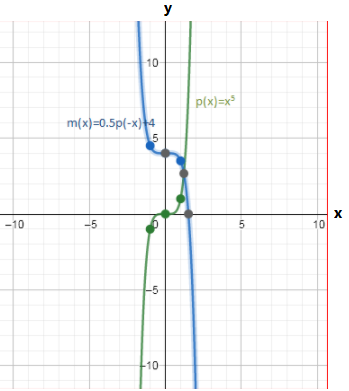
From the above graph we can conclude that the graph is vertically shifted upwards by 4 units and the graph is vertically stretched by the factor of 0.5 units.
Finding the equation of m(x)
p(x)=x5
p(−x)=(−x)5
m(x)=0.5p(−x)+4
m(x)=−0.5x5+4
We have found the specific equation of m(x) as−0.5x5+4.
The graph of p(x)=x5 and m(x)=0.5p(−x)+4 is shown below
How to solve Chapter 3 Exercise 3.3 II Carnegie Learning
Carnegie Learning Algebra II Student Skills Practice 1st Edition Chapter 3 Exercise 3.3 Skills Practice Page 336 Problem 18 Answer
Given: The functions
p(x)=x3
m(x)=−p(x+5)
Our objective is to find the specific equation ofm(x)
Procedure:
Explain the transformed function using the form in the tip.Find the value of−p(x+5).Now, find the specific equation of m(x).
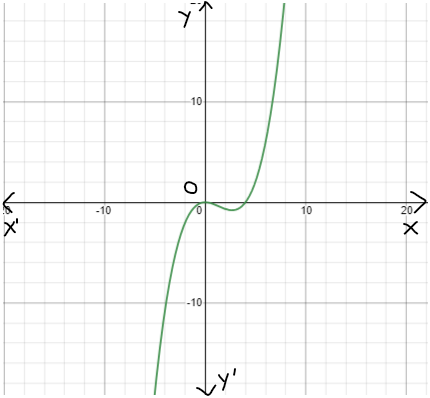
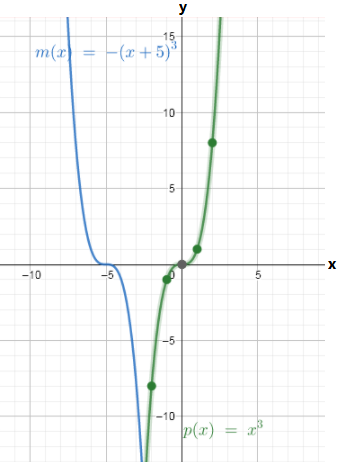
The given function is p(x)=x3 and the transformed function ism(x)=−p(x+5)
The graph of both the functions are

From the above graph we conclude that the graph is reflected about the line and the graph is horizontally shifted to the left by 5 units.
p(x)=x3
p(x+5)=(x+5)3
m(x)=−p(x+5)
m(x)=−(x+5)3
We have found the specific equation of m(x) as−(x+5)3.
The graph of p(x)=x3 and m(x)=−p(x+5) is shown below
Page 336 Problem 19 Answer
Given: The functions
p(x)=x4
m(x)=2p(−x−2)
Our objective is to find the specific equation of m(x)
Procedure:
Explain the transformed function using the form in the tip.Find the value of p(−x−2).Now, find the specific equation of m(x).
The given function is p(x)=x4 and the transformed function ism(x)=2p(−x−2)
The graph of both the functions are
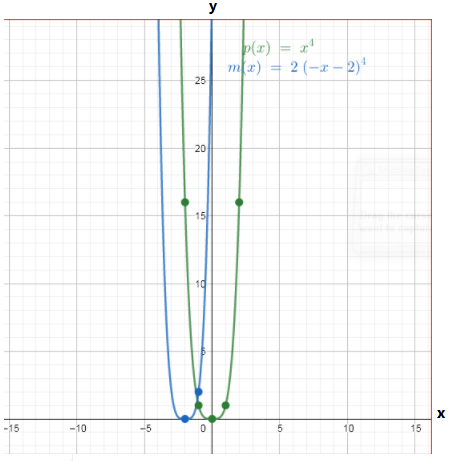
From the above graph we can conclude that is vertically stretched by a factor of 2 units and the graph is horizontally shifted to the right by the factor of 2 units
p(x)=x4
p(−x−2)=(−x−2)4
m(x)=2p(−x−2)
m(x)=2(−x−2)4
We have found the specific equation of m(x) as 2(−x−2)4.
The graph of p(x)=x4 and m(x)=2p(−x−2) is shown below

Page 336 Problem 20 Answer
Given: The functions
p(x)=x5
m(x)=p(x+4)−1
Our objective is to find the specific equation of m(x)
Procedure:
Explain the transformed function using the form in the tip.
Find the value of p(x+4). Now, find the specific equation of m(x).
The given function is p(x)=x5 and the transformed function ism(x)=p(x+4)−1
The graph of both the functions are
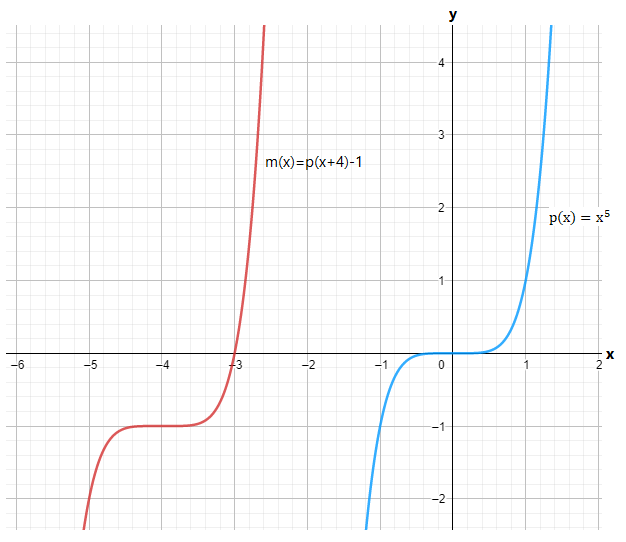
From the above graph we can conclude that the graph is horizontally shifted to the left by 4 units and the graph is vertically shifted downwards by 1 unit.
p(x)=x5
p(x+4)=(x+4)5
m(x)=p(x+4)−1
m(x)=(x+4)5−1
We have found that the specific equation of m(x) as(x+4) is 5−1.
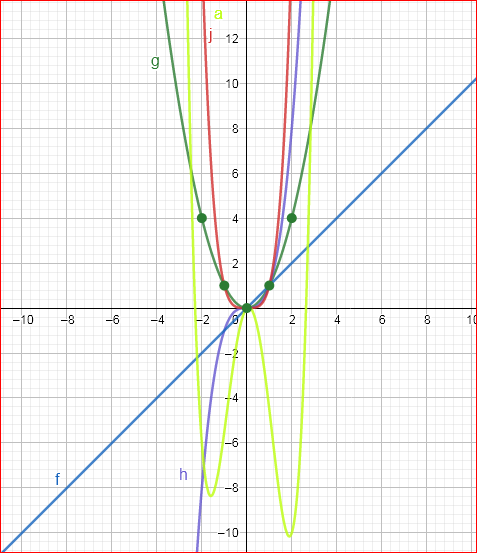
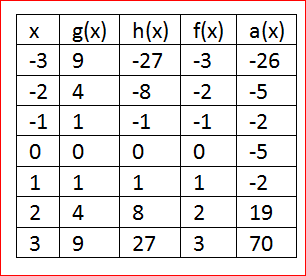
Carnegie Learning Algebra II Student Skills Practice 1st Edition Chapter 3 Exercise 3.3 Skills Practice Page 337 Problem 21 Answer
Given :
The functions
f(x)=x
g(x)=x2
h(x)=x3
j(x)=x4
k(x)=x5
Our objective is to find the specific equation of a(x)=g(x)+3f(x)
Procedure:
Create the table with the values given in the function a(x).
Sub the values in the function a(x).
Plot the graph using the table values.
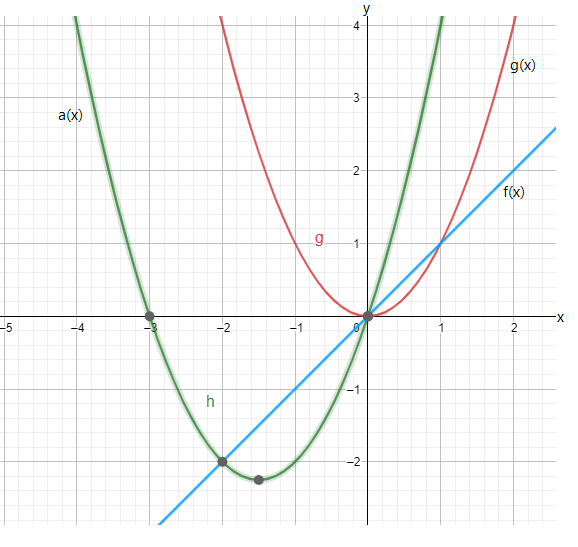
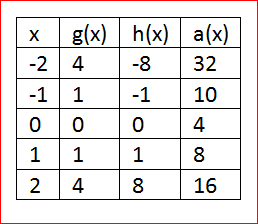
From the given equationa(x)=g(x)+3f(x)
Create the table values using the function g(x) and f(x)
Sub the values of the function g(x) and f(x) in a(x)
a(x)=g(x)+3f(x)
a(x)=x2+3x
The graph which shows the given functions as follows
We have found the specific equation fora(x)=x2+3x.
The graph is shown below
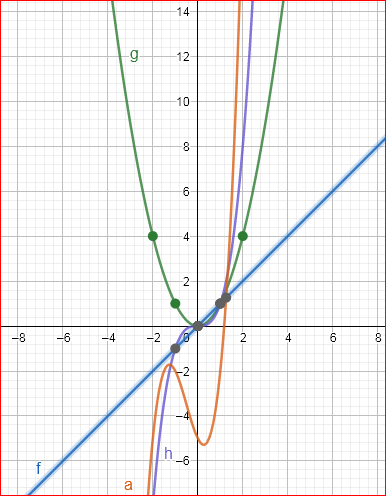
Page 337 Problem 22 Answer
Given: The functions
f(x)=x
g(x)=x2
h(x)=x3
j(x)=x4
k(x)=x5
Our objective is to find the specific equation of a(x)=0.5j(x)−g(x)
Procedure:
Create the table with the values given in the function a(x).
Sub the values in the function a(x).
Plot the graph using the table values.
From the given equation a(x)=0.5j(x)−g(x)
Create the table values using the function j(x) and g(x)
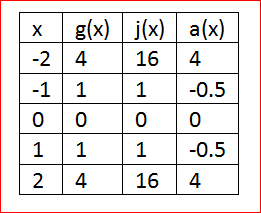
Sub the values of the function j(x) and g(x) ina(x)
a(x)=0.5j(x)−g(x)
a(x)=0.5x4−x2
The graph which shows the given functions as follows
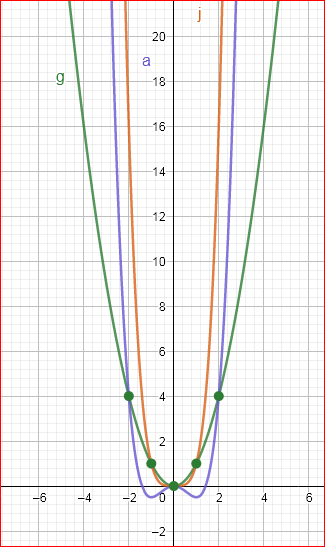
We have found the specific equation fora(x)=0.5x4−x2.
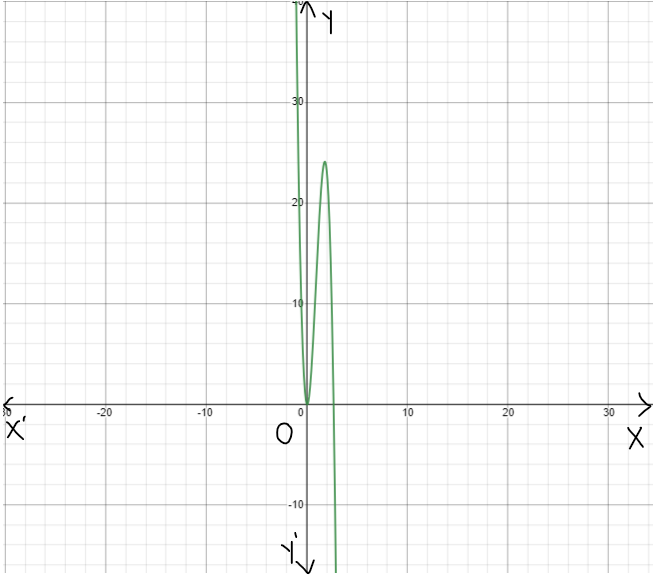
Carnegie Learning Algebra II Student Skills Practice 1st Edition Chapter 3 Exercise 3.3 Skills Practice Page 338 Problem 23 Answer
Given : The functions
f(x)=x
g(x)=x2
h(x)=x3
j(x)=x4
k(x)=x5
Our objective is to find the specific equation a(x)=k(x)+2j(x)−h(x)
Procedure:
Create the table with the values given in the function a(x).
Sub the values in the function a(x).
Plot the graph using the table values.
From the given equation a(x)=k(x)+2j(x)−h(x)
Create the table values using the function k(x),j(x) and h(x)
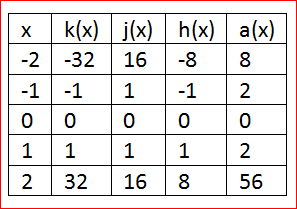
Sub the values of the function k(x),j(x) and h(x) in a(x)
a(x)=k(x)+2j(x)−h(x)
a(x)=x5+2x4−x3
The graph which shows the given functions as follows
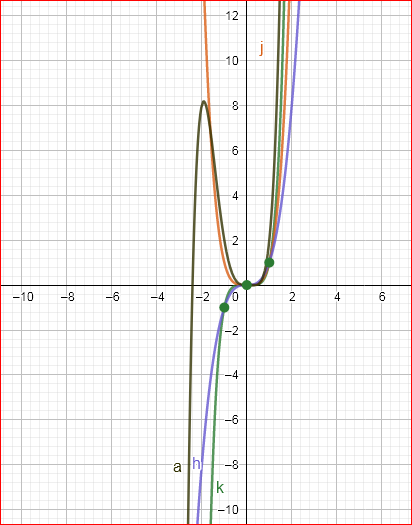
We have found the specific equation fora(x)=x5+2x4−x3.
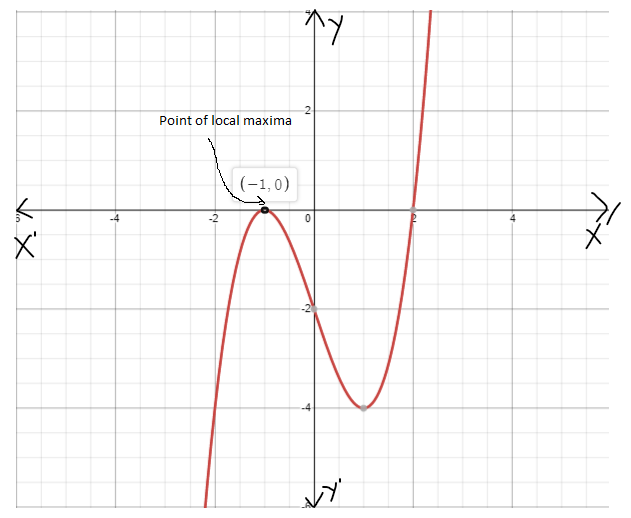
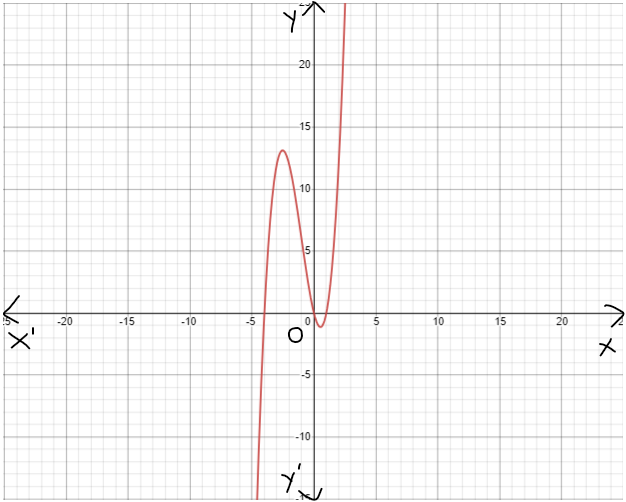
Page 338 Problem 24 Answer
Given: The functions
f(x)=x
g(x)=x2
h(x)=x3
j(x)=x4
k(x)=x5
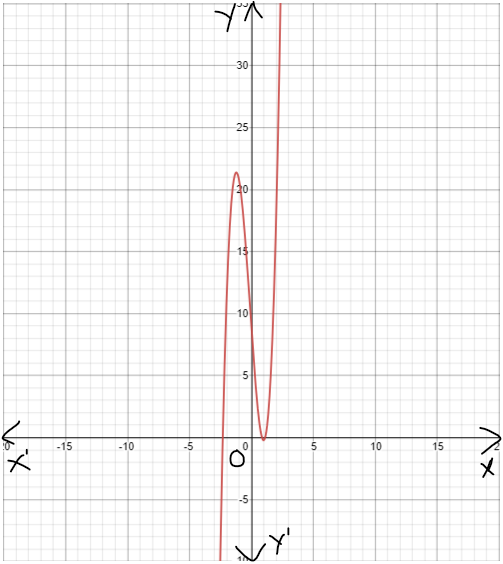
Our objective is to find the specific equation a(x)=−h(x)+5g(x)+4
Procedure:
Create the table with the values given in the function a(x).
Sub the values in the function a(x).
Plot the graph using the table values.
From the given equation a(x)=−h(x)+5g(x)+4
Create the table values using the function h(x) and g(x)
Sub the values of the function g(x) and h(x) in a(x)
a(x)=−h(x)+5g(x)+4
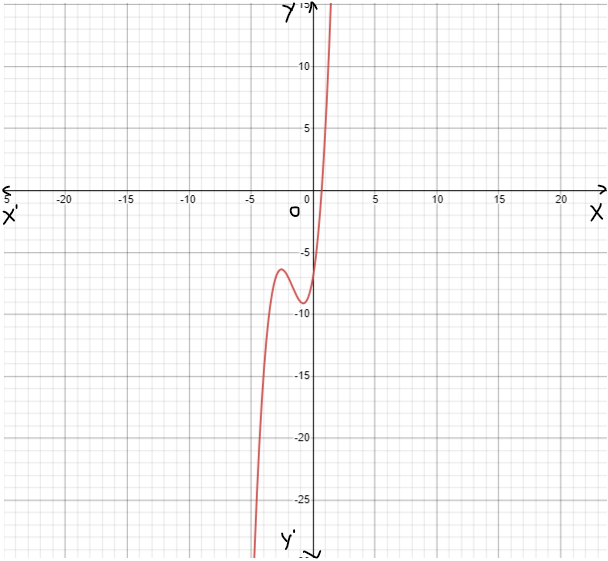
a(x)=−x3+5x2+4
The graph which shows the given functions as follows
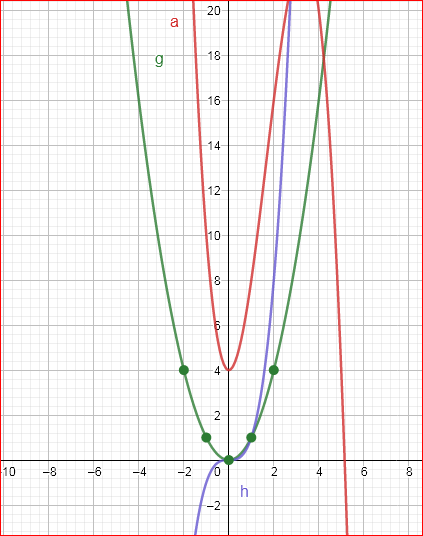
We have found the specific equation fora(x)=−x3+5x2+4.
Carnegie Learning II answer key Chapter 3 Exercise 3.3
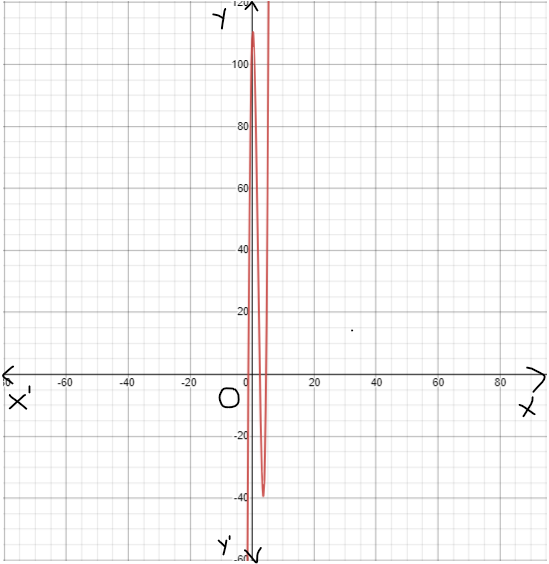
Carnegie Learning Algebra II Student Skills Practice 1st Edition Chapter 3 Exercise 3.3 Skills Practice Page 339 Problem 25 Answer
Given :
The functions
f(x)=x
g(x)=x2
h(x)=x3
j(x)=x4
k(x)=x5
Our objective is to find the specific equation of a(x)=j(x)−0.5h(x)−6g(x)+f(x)
Procedure:
Create the table with the values given in the function a(x).
Sub the values in the function a(x). Plot the graph using the table values.
From the given equationa(x)=j(x)−0.5h(x)−6g(x)+f(x)
Create the table values using the function j(x),h(x),g(x) and f(x)
Sub the values of the function j(x),h(x),g(x) and f(x) in a(x)
a(x)=j(x)−0.5h(x)−6g(x)+f(x)
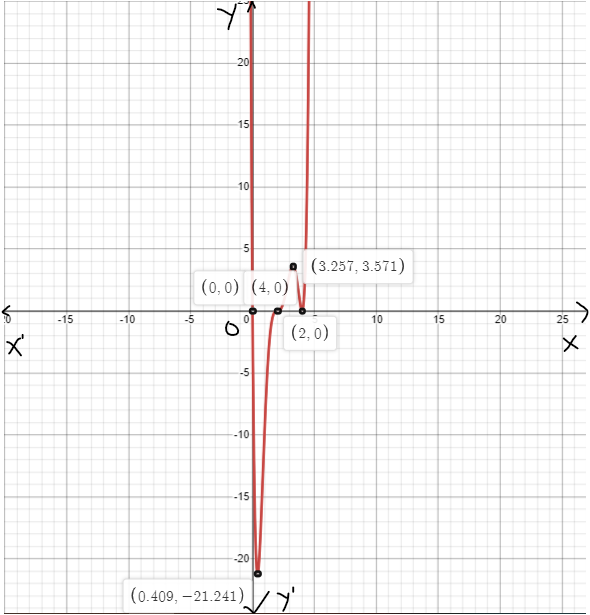
a(x)=x4−0.5x3−6x2+x
The graph which shows the given functions as follows
We have found the specific equation fora(x)=x4−0.5x3−6x2+x.
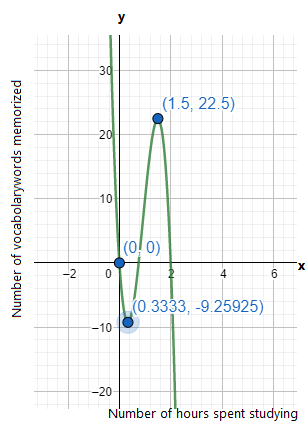
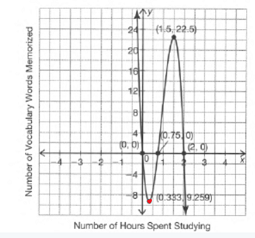
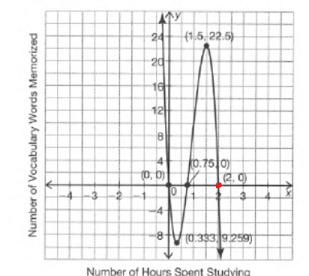
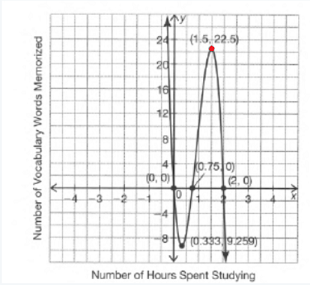
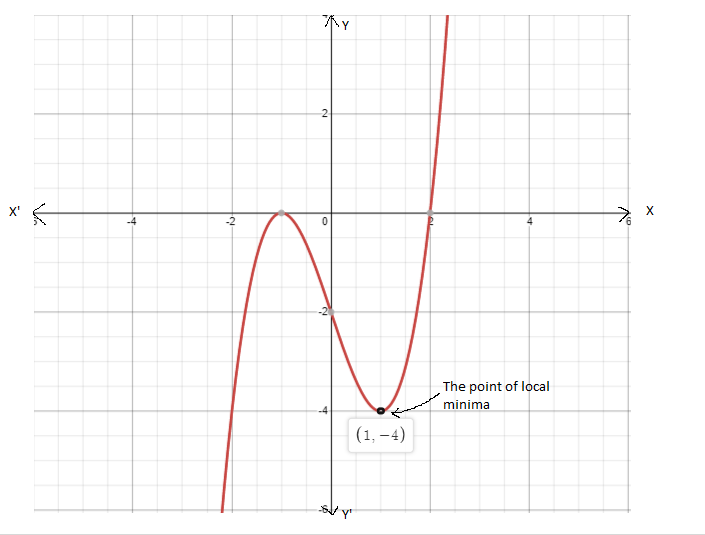
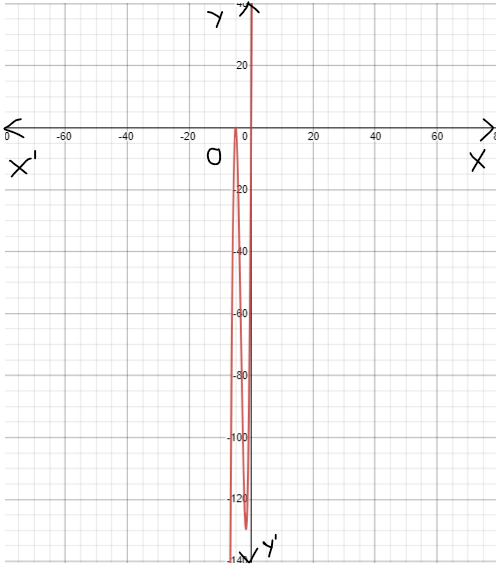
Page 339 Problem 26 Answer
Given:
The functions
f(x)=x
g(x)=x2
h(x)=x3
j(x)=x4
k(x)=x5
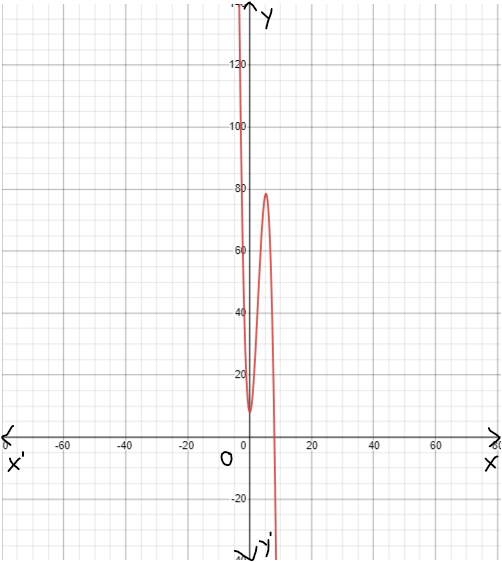
Our objective is to find the specific equation of a(x)=2h(x)+3g(x)−2f(x)−5
Procedure:
Create the table with the values given in the function a(x).Sub the values in the function a(x).
Plot the graph using the table values.
From the given equation a(x)=2h(x)+3g(x)−2f(x)−5
Create the table values using the functions h(x),g(x) and f(x)
Sub the values of the function h(x),g(x) and f(x) in a(x)
a(x)=2h(x)+3g(x)−2f(x)−5
a(x)=2x3+3x2−2x−5
The graph which shows the given functions as follows
We have found the specific equation fora(x)=2x3+3x2−2x−5.