Carnegie Learning Algebra I Student Text Volume 1 3rd Edition Chapter 4 Exercise: 4.2 Sequences

Carnegie Learning Algebra I Student Text Volume 1 3rd Edition Chapter 4 Sequences

Page 224 Problem 1 Answer

We have been given to Carefully cut out sequences A through P. We have been asked to make sure you do not cut away the letter representing the sequence.By using the snipping tool, we will cut the sequences A through P and paste them one by one.

Sequence A-
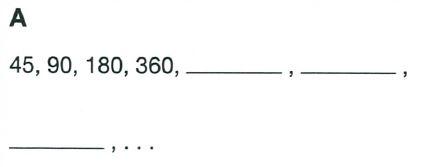
Carnegie Learning Algebra I, Student Text, Volume 1, 3rd Edition, Chapter 4 Sequences 1

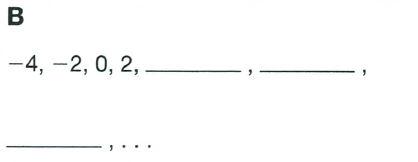
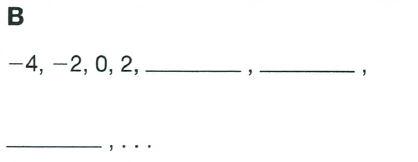
Sequence B-

Carnegie Learning Algebra I, Student Text, Volume 1, 3rd Edition, Chapter 4 Sequences 1 1

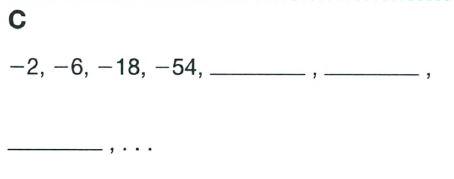
Sequence C-

Carnegie Learning Algebra I, Student Text, Volume 1, 3rd Edition, Chapter 4 Sequences 1 2

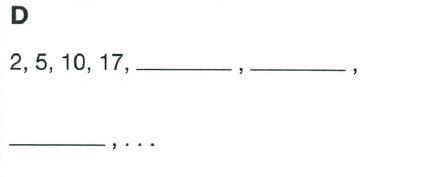
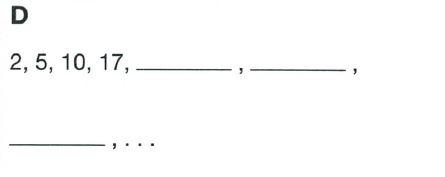
Sequence D-

Carnegie Learning Algebra I, Student Text, Volume 1, 3rd Edition, Chapter 4 Sequences 1 3

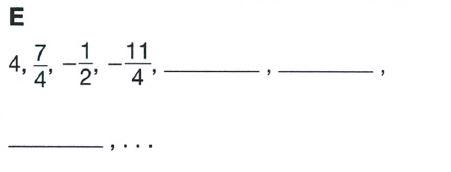
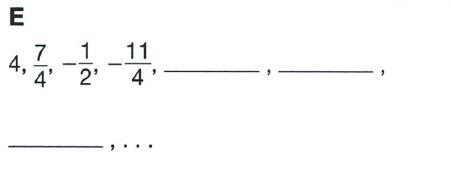
Sequence E-

Carnegie Learning Algebra I, Student Text, Volume 1, 3rd Edition, Chapter 4 Sequences 1 4

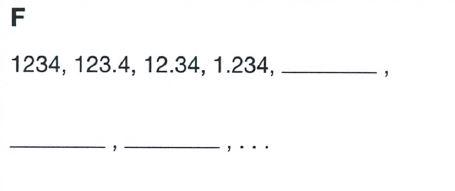
Sequence F-

Carnegie Learning Algebra I, Student Text, Volume 1, 3rd Edition, Chapter 4 Sequences 1 5

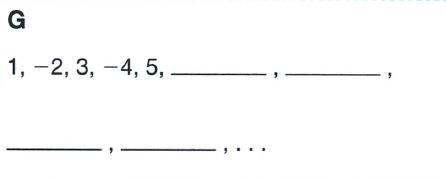
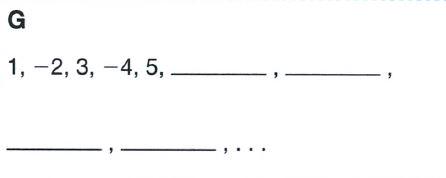
Sequence G-

Carnegie Learning Algebra I, Student Text, Volume 1, 3rd Edition, Chapter 4 Sequences 1 6

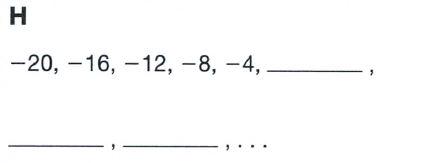
Sequence H-

Carnegie Learning Algebra I, Student Text, Volume 1, 3rd Edition, Chapter 4 Sequences 1 7

Sequence I-

Carnegie Learning Algebra I, Student Text, Volume 1, 3rd Edition, Chapter 4 Sequences 1 8

Sequence J-

Carnegie Learning Algebra I, Student Text, Volume 1, 3rd Edition, Chapter 4 Sequences 1 9

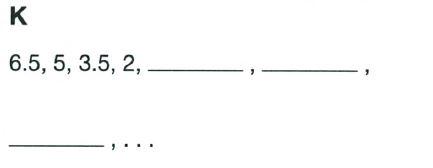
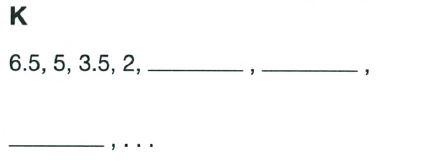
Sequence K-

Carnegie Learning Algebra I, Student Text, Volume 1, 3rd Edition, Chapter 4 Sequences 1 10

Sequence L-

Carnegie Learning Algebra I, Student Text, Volume 1, 3rd Edition, Chapter 4 Sequences 1 11

Sequence M-

Carnegie Learning Algebra I, Student Text, Volume 1, 3rd Edition, Chapter 4 Sequences 1 12

Sequence N-

Carnegie Learning Algebra I, Student Text, Volume 1, 3rd Edition, Chapter 4 Sequences 1 13

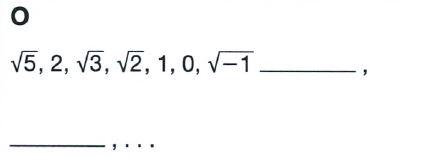
Sequence O-

Carnegie Learning Algebra I, Student Text, Volume 1, 3rd Edition, Chapter 4 Sequences 1 14

Sequence P-

Carnegie Learning Algebra I, Student Text, Volume 1, 3rd Edition, Chapter 4 Sequences 1 15

The cutout of the Sequences A through P by ensuring that no sequence cut away the letter is-

Sequence A-
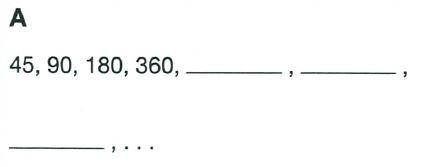
Carnegie Learning Algebra I, Student Text, Volume 1, 3rd Edition, Chapter 4 Sequences a

Sequence B-

Carnegie Learning Algebra I, Student Text, Volume 1, 3rd Edition, Chapter 4 Sequences b

Sequence C-

Carnegie Learning Algebra I, Student Text, Volume 1, 3rd Edition, Chapter 4 Sequences c

Sequence D-

Carnegie Learning Algebra I, Student Text, Volume 1, 3rd Edition, Chapter 4 Sequences d

Sequence E-

Carnegie Learning Algebra I, Student Text, Volume 1, 3rd Edition, Chapter 4 Sequences e

Sequence F-

Carnegie Learning Algebra I, Student Text, Volume 1, 3rd Edition, Chapter 4 Sequences f

Sequence G-

Carnegie Learning Algebra I, Student Text, Volume 1, 3rd Edition, Chapter 4 Sequences g

Sequence H-

Carnegie Learning Algebra I, Student Text, Volume 1, 3rd Edition, Chapter 4 Sequences h

Sequence I-

Carnegie Learning Algebra I, Student Text, Volume 1, 3rd Edition, Chapter 4 Sequences i

Sequence J-

Carnegie Learning Algebra I, Student Text, Volume 1, 3rd Edition, Chapter 4 Sequences j

Sequence K-

Carnegie Learning Algebra I, Student Text, Volume 1, 3rd Edition, Chapter 4 Sequences k

Sequence L-

Carnegie Learning Algebra I, Student Text, Volume 1, 3rd Edition, Chapter 4 Sequences l

Sequence M-

Carnegie Learning Algebra I, Student Text, Volume 1, 3rd Edition, Chapter 4 Sequences m

Sequence N-

Carnegie Learning Algebra I, Student Text, Volume 1, 3rd Edition, Chapter 4 Sequences n

Sequence O-

Carnegie Learning Algebra I, Student Text, Volume 1, 3rd Edition, Chapter 4 Sequences o

Sequence P-

Carnegie Learning Algebra I, Student Text, Volume 1, 3rd Edition, Chapter 4 Sequences p

Carnegie Learning Algebra I Chapter 4.2 Sequences Solutions

Carnegie Learning Algebra I Student Text Volume 1 3rd Edition Chapter 4 Exercise: 4.2 Sequences Page 224 Problem 2 Answer

We have been given to determine the unknown terms of each sequence.We have been asked to describe the pattern under each sequence.We will use the proprieties of sequence.

45,90,180,360,…

The solution goes this way:

45,45×2=90,92×2=180,180×2=360

The sequence follow the pattern of multiplication of 2 to the previous term to get to the next successive term.

So, a5=360×2=720

a6=720×2=1440

a7=1440×2=2880

The next numbers in the sequence are 720,1440,2880.

−4,−2,0,−2,…

In this sequence, the terms are proceeding further in +2 pattern. And thus following Arithmatic Progression.

a5=a4+2=2+2=4

a6=a5+2=4+2=6

a7=a6+2=6+2=8

The next numbers in the sequence are 4,6,8−2,−6,−18,−54,…

The solution goes this way:−2,−2×3=−6,−6×3=−18,−18×3=−54…and so on.

If we analyse this we find that the numbers in the sequence follows a certain pattern that is generated by multiplying the previous term with 3 and so on respectively.

Thus, the next numbers should be in this pattern:

a5=−54×3=−162

a6=−162×3=−486

a7=−486×3=−1458

​The next numbers in the given sequence are −162,−486,−1458

2,5,10,17…and so on

The solution goes this way: 2,2+3=5,5+5=10,10+7=17,… and so on.

If we analyse this we find that the numbers in the sequence follows a certain pattern that is generated by adding successive numbers 3,5,7,9,11… and so on respectively, which are odd numbers.

Thus, the next numbers should in this pattern:

a5=17+9=26

a6=26+11=37

a7=37+13=50

The next numbers in the sequences are 26,37,50 E.4,7/4,1/2,−11/4.…

The solution goes this way:4,4−9/4=7/4,7/4−9/4=−2/4

=−1/2,−1/2−9/4

=−11/4 and so on.

If we analyse this we find that the numbers in the sequence follows a certain pattern that is generated by subtracting −9/4 from the previous term.

Thus, the next numbers should be in this pattern

a5=−11/4−9/4

=−20/4

a6=−20/4−9/4

=−29/4

a7=−29/4−9/4

=−38/4

The next numbers in the sequence are −20/4,−29/4,−38/4.

  1. 1234,123.4,12.34,1.234,…

The solution goes this way:

1234,1234/10

=123.4,123.4/10

=12.34,12.34/10

=1.234… and so on

If we analyse this we find that the numbers in the sequence follows a certain pattern that is generated by dividing the previous term by 1/10.

Thus, the next numbers should be in this pattern:

a5=1.234/10

=0.1234

a6=0.1234/10

=0.01234/a7

=0.01234/10

=0.001234

The next numbers are 0.1234,0.01234,0.001234

1,−2,3,−4,5,…

Firstly, we note that the absolute value of the terms increase by 1.

1,2,3,4,5,6,7,8,9,…

So, we can show the absolute value fo the nth term by n.

Secondly, we observed that the signs (+,−) of each term alternates, and we start with a positive term:+,−,+,−,+,−,+,−,+,−,+,−….

And, we can achieve the correct sign for the nth term by (−1)n+1

If we follow the above conclusions we get that,

The sign for fifth term is + and the term for it is 4+1=5

The sign for sixth term is −and the term for it is−(5+1)=−6

The sign for seventh term is + and the term for it is6+1=7

The next term of the sequence are 5,−6,7−20,−16,−12,−8,−4,…

In this sequence, the terms are proceeding further in +4 pattern.

Thus,

a5=a4+4=−4+4=0

a6=a5+4=0+4=4

a7=a6+4=4+4=8​

The next terms are 0,4,8

1,10,100,1000,…

The solution goes this way: 1,1×10=10,10×10=100,100×10=1000 and so on

If we analyse this we find that the numbers in the sequence follows a certain pattern that is generated by multiplying 10 respectively

Thus, the next numbers should be in this pattern :

a5=1000×10=10000

a6=10000×10=100000

a7=100000×10=1000000

Thus, the next numbers are 10000,100000,1000000.

−5,−5/2,−5/4,−5/8.…

The solution goes this way:

−5,−5×1/2=−5/2,−5/2×1/2

=−5/4,−5/4×1/2

=−5/8….. and so on

If we analyse this we find that the numbers in the sequence follows a certain pattern that is generated by multiplying by 1/2 respectively

Thus, the next numbers should be in this pattern :

a5=−5/8×1/2=−5/16

a6=−5/16×1/2=−5/32

a7=−5/32×1/2=−5/64

The next terms in the sequence are −5/16,−5/32,−5/64,5,5,3.5,2,…

The solution is as follows: 6−5−1.5=5,5−1.5=3.5,3.5−1.5=2…and so on.

If we analyse this we find that the numbers in the sequence follows a certain pattern that is generated by subtracting  1.5 respectively from the previous term

Thus, the next numbers should be in this pattern :

a5=2−1.5=0.5

a6=0.5−1.5=−1

a7=−1−1.5=−2.5

The next terms in the given sequence are0.5,−1,−2.5

86,85,83,80,76,…

The solution is as followed: 86,86−1=85,85−2=83,83−3=80,80−4=76… and so on

If we analyse this we find that the numbers in the sequence follows a certain pattern that is generated by subtracting successive numbers 1,2,3,4… and so on respectively, which are natural numbers.

Thus, the next numbers shoule be in this pattern

a5=76−5=71

a6=71−6=65

a7=65−7=58​

The next numbers in the sequence are 71,65,58

M.−16,4,−1,1/4.…

The pattern goes this way:−16,−16×(−1/4)=4,4×(−1/4)=−1,−1×(−1/4)=1/4 and so on

Firstly we note that the numbers are multiplied by−1/4 respectively from each previuos term.

Thus, the next numbers should be in this pattern

a5=1/4×(−1/4)=−1/16

a6=−1/16×(−1/4)=1/64

a7=1/64×(−1/4)=−1/256

The next numbers in the sequence are −1/16,1/64−1/256.

  1. 1473.2,1452.7,1432.2,1411.7,….

The solution is as followed:14732.2−2.5=1452.7,14527−20.5=1432.2,1432.2−20.5=1411.7 and so on

If we analyse this we find that the numbers in the sequence follows a certain pattern that is generated by subtracting 20.5 from each previous number.

Thus, the next numbers should be in this pattern:

a5=1411.7−20.5=1391.2

a6=1391.2−20.5=1370.7

a7=1370.7−20.5=1350.2​

The next terms in the given sequence are 1391.2,1370.7,1350.2.

O.√5,2,√3,√2,1,0,√−1.…

The pattern goes this way: √5,√4=2,√3,√2,√1=1 and so on…

We observed that the pattern is the square root of natural numbers in receding order from 5.

Thus, the next numbers should be in this pattern :

a5=√−2

a6=√−3

a7=√−4

The next numbers in the sequence are  √−2,√−3,√−4−4,12,−36,108,….

The solutions is as followed:−4,−4×(−3)=12,12×(−3)=−36,−36×(−3)=108 and so on Firstly, we observed that the previous numbers are multipled by -3 to get the next successive term.

Thus, the next numbers should be in this pattern:

a5=108×(−3)=−324

a6=−324×(−3)=972

a7=972×(−3)=−2916

The next terms in the given sequence are −324,972,−2916.

The next three terms for all the above given sequences are as follows:

A.720,1440,2880

B.4,6,8

C.−162,−486,−1458

D.26,37,50

E.−20/4,−29/4,−38/4.

F.0.1234,0.01234,0.001234

G.5,−6,7

H.0,4,8

I.10000,100000,1000000.

J.−5/16,−5/32,−5/64

K.0.5,−1,−2.5

L.71,65,58

M.−1/16,1/64,−1/256.

N.1391.2,1370.7,1350.2.

O.√−2,√−3,√−4

P.−324,972,−2916.

Carnegie Learning Algebra Sequences Exercise 4.2 Answer Key

Carnegie Learning Algebra I Student Text Volume 1 3rd Edition Chapter 4 Exercise: 4.2 Sequences Page 224 Problem 3 Answer

We have been given that sort the sequences into groups based on common characteristics.

We have been asked to list the letters of the sequences in each group and To provide a rationale as to why you created each group.

We will  be Using the properties of sequence.

A sequence is an ordered list of objects. Like a set, it contains members (also called elements or terms).

The number of ordered elements (possibly infinite) is called the length of the sequence.

Unlike a set, order matters, and a particular term can appear multiple times at different positions in the sequence.

The sequence are grouped as

Adding/Subtracting: B,E,H,K,N

Multiplying/Dividing: A,C,F,I,J,M,P

Other Pattern: D,G,L,O

The sequence is an ordered list of elements, possibly infinite in length.

The sequence is grouped as:

Adding/Subtracting: B,E,H,K,N

Multiplying/Dividing: A,C,F,I,J,M,P

Other Pattern: D,G,L,O

Page 224 Problem 4 Answer

We are given a sequence 45,90,180,360,​_,____,____​.

We have to tell which mathematical operation can be performed in order to find the next terms of the sequence.

We will be using the mathematical operation concept to tell the required operation.

We are given a sequence45,90,180,360,____,____

The common ratio that we can observe here is 90/45

=2/180

90=2,so on

​From the given sequence we can observe that the value of a second term can be obtained by multiplying 2 with the first term.

Similarly, the other terms can be obtained by multiplying 2 with the previous term.

The mathematical operation that can be used to obtain the rest terms of the sequence 45,90,180,360,_,__,__is multiplication

Page 224 Problem 5 Answer

We are given a sequence−4,−2,0,2,___,___We have to tell which mathematical operation can be performed in order to find the next terms of sequence

We will be using the mathematical operation concept to tell the required operation

We are given a sequence−4,−2,0,2,___,___

The common difference that we can observe here is −2−(−4)=2

0−(−2)=2,so on

From the given sequence we can observe that the value of a second term can be obtained by adding 2 with the first term.

Similarly, the other terms can be obtained by adding 2 with the previous term.

The mathematical operation that can be used to obtain the rest terms of the sequence −4,−2,0,2,____,_____,___is addition

Carnegie Learning Algebra 1 Volume 1 Chapter 4 Exercises Help

Carnegie Learning Algebra I Student Text Volume 1 3rd Edition Chapter 4 Exercise: 4.2 Sequences Page 224 Problem 6 Answer

We are given a sequence−2,−6,−18,−54,______,______We have to tell which mathematical operation can be performed in order to find the next terms of sequence We will be using the mathematical operation concept to tell the required operation

We are given a sequence−2,−6,−18,−54,______,______

The common ratio that we can observe here is −6/−2=3/−18−6=3,​so​on

​From the given sequence we can observe that the value of a second term can be obtained by multiplying 3 with the first term.

Similarly, the other terms can be obtained by multiplying 3 with the previous term.

The mathematical operation that can be used to obtain the rest terms of the sequence−2,−6,−18,−54,___,____,____ is multiplication

Page 224 Problem 7 Answer

We are given a sequence2,5,10,17,__,__,____,_____

We have to tell which mathematical operation can be performed in order to find the next terms of sequence We will be using the mathematical operation concept to tell the required operation

We are given a sequence 2,5,10,17,____,_____,_____

We can observe here the difference between the numbers is odd numbers i.e.

5−2=3

10−5=5

17−10=7,so on​

From the given sequence we can observe that the value of a second term can be obtained by adding an odd number starting with 3 to the first term.

Similarly, the other terms can be obtained by adding odd numbers with the previous term.

The mathematical operation that can be used to obtain the rest terms of the sequence 2,5,10,17,____,_____,_____ is addition 

Page 224 Problem 8 Answer

We are given a sequence 4,7/4,−1/2,−11/4

We have to tell which mathematical operation can be performed in order to find the next terms of the sequence.

We will be using the mathematical operation concept to tell the required operation.

From the given sequence we can observe that the value of a second term can be obtained by subtracting 9/4 with the first term.

Similarly, the other terms can be obtained by subtracting 9/4 with the previous term.

We are given a sequence 4,7/4,−1/2,−11/4

We can observe the common difference as

4−7/4=9/4

7/4−(−1/2)=9/4,so on

From the given sequence we can observe that the value of a second term can be obtained by subtracting with the first term.

Similarly, the other terms can be obtained by subtracting with the previous term.

The mathematical operation that can be used to obtain the rest terms of the sequence 4,7/4,−1/2,−11/4 is the subtraction.

Algebra I Sequences Chapter 4.2 Carnegie Textbook Guide

Carnegie Learning Algebra I Student Text Volume 1 3rd Edition Chapter 4 Exercise: 4.2 Sequences Page 224 Problem 9 Answer

We are given a sequence1234,123.4,12.34,1.234,____,___

We have to tell which mathematical operation can be performed in order to find the next terms of the sequence.

We will be using the mathematical operation concept to tell the required operation

We are given a sequence1234,123.4,12.34,1.234,_____,______

Here, we can observe a common ratio of 123.4/1234=1/10

12.34/123.4=1/10,so on

​From the given sequence we can observe that the value of a second term can be obtained by multiplying with 1/10 to the first term.

Similarly, the other terms can be obtained by multiplying each term with 1/10 to the previous term.

The mathematical operation that can be used to obtain the rest terms of the sequence 1234,123.4,12.34,1.234, _____,______ is the multiplication

Page 224 Problem 10 Answer

We are given a sequence1,−2,3,−4,5,______,_____

We have to tell which mathematical operation can be performed in order to find the next terms of the sequence.

We will be using the mathematical operation concept to tell the required operation.

We are given a sequence1,−2,3,−4,5,_____,____

We can observe here a pattern like adding one and then multiplying with −1 and then subtracting one and multiplying with−1i.e.

(1+1)⋅−1=−2

(−2−1)⋅−1=3

(3+1)⋅−1=−4,​so ​on

​The mathematical operations that can be used to obtain the rest terms of the sequence1,−2,3,−4,5,_____,____ are addition, subtraction and multiplication

Page 224 Problem 11 Answer

We are given a sequence−20,−16,−12,−8,−4,___,____,_____

We have to tell which mathematical operation can be performed in order to find the next terms of the sequence.

We will be using the mathematical operation concept to tell the required operation.

We are given a sequence−20,−16,−12,−8,−4,_____ here, we can observe a common difference of 4 i.e.−16−(−20)=4−12−(−16)=4,so on​

​From the given sequence we can observe that the value of a second term can be obtained by adding 4 with the first term.

Similarly, the other terms can be obtained by adding 4 with the previous term.

The mathematical operation that can be used to obtain the rest terms of the sequence−20,−16,−12,−8,−4,_____ is the addition.

Page 224 Problem 12 Answer

We are given a sequence1,10,100,1000,….,……

We have to tell which mathematical operation can be performed in order to find the next terms of the sequence.

We will be using the mathematical operation concept to tell the required operation

We are given a sequence1,10,100,1000,….,……

Here, we can observe a common ratio of ​10/1

=10/100

10=10,so on

From the given sequence we can observe that the value of a second term can be obtained by multiplying 10 with the first term.

Similarly, the other terms can be obtained by multiplying 10 with the previous term.

The mathematical operation that can be used to obtain the rest terms of the sequence 1,10,100,1000,….,…… is the multiplication.

Solutions For Carnegie Algebra I Chapter 4.2 Sequences

Carnegie Learning Algebra I Student Text Volume 1 3rd Edition Chapter 4 Exercise: 4.2 Sequences Page 224 Problem 13 Answer

We are given a sequence−5,−5/2,−5/4,−5/8

We have to tell which mathematical operation can be performed in order to find the next terms of the sequence.

We will be using the mathematical operation concept to tell the required operation.

We are given a sequence−5,−5/2,−5/4,−5/8

Here, we can observe a common ratio of −5/2−5

=1/2−5/4−5/2

=1/2,so on​

From the given sequence we can observe that the value of a second term can be obtained by multiplying the first term with 1/2.

Similarly, the other terms can be obtained by multiplying the previous term with 1/2 he mathematical operation that can be used to obtain the rest terms of the sequence −5,−5/2,−5/4,−5/8 is the multiplication.

Page 224 Problem 14 Answer

We are given a sequence6.5,5,3.5,2,……………

We have to tell which mathematical operation can be performed in order to find the next terms of the sequence.

We will be using the mathematical operation concept to tell the required operation.

We are given a sequence6.5,5,3.5,2,……………

Here, we can observe a common difference as​6.5−5=1.5

5−3.5=1.5,​so​on

​From the given sequence we can observe that the value of a second term can be obtained by subtracting 1.5 with the first term.

Similarly, the other terms can be obtained by subtracting 1.5 with the previous term.

The mathematical operation that can be used to obtain the rest terms of the sequence 6.5,5,3.5,2,…………… is the subtraction.

Page 224 Problem 15 Answer

We are given a sequence86,85,83,80,76,____,_____

We have to tell which mathematical operation can be performed in order to find the next terms of the sequence.

We will be using the mathematical operation concept to tell the required operation.

We are given a sequence 86,85,83,80,76,___,_____

We can observe here the difference between the numbers is natural numbers i.e.

86−85=1

85−83=2

83−80=3,​so​ on​

From the given sequence we can observe that the value of a second term can be obtained by subtracting a natural number from the first term.

Similarly, the other terms can be obtained by subtracting natural numbers from the previous term.

The mathematical operation that can be used to obtain the rest terms of the sequence 86,85,83,80,76,___,_____  is the subtraction.

Carnegie Learning Algebra I Student Text Volume 1 3rd Edition Chapter 4 Exercise: 4.2 Sequences Page 224 Problem 16 Answer

We are given a sequence as−16,4,−1,1/4.We are asked to give a mathematical expression that can be performed in order to determine the next terms of the given sequence.

For that, we will use the general formula of terms of a geometric progression that is arn−1, where a,n, and r is the first term, the number of terms, and the common difference of the g.p. respectively.

We will use the general formula of geometric progression that is arn−1 to determine the next terms of the given geometric operation−16,4,−1,1/2.

Page 224 Problem 17 Answer

We are given a sequence as1473.2,1452.7,1432.2,1411.7

We are asked to give a mathematical expression that can be performed in order to determine the next terms of the given sequence.

For that, we will use the general formula a+(n−1)d, wherea,n,and d are the first term, the number of terms, and the common difference of an arithmetic sequence respectively.

The mathematical expression a+(n−1)d can be performed to determine the next terms of the given sequence1473.2,1452.7,1432.2,1411.7

Page 224 Problem 18 Answer

We are given a sequence as √5,2,√3,√2,1,0,√−1

We are asked to give a mathematical expression that can be performed in order to determine the next terms of the given sequence.

For that, we can use a general formula √6−n where n is the number of terms in the given sequence.

The mathematical expression√6−n can be used to determine the next terms of the given sequence √5,2,√3,√2,1,0,√−1

Page 224 Problem 19 Answer

We are given a sequence as−4,12,−36,108

We are asked to give a mathematical expression that can be performed in order to determine the next terms of the given sequence.

For that, we will use a general formula arn−1 where a,n,and r are the first term, the number of terms, and the common ratio of a geometric sequence respectively.

The mathematical expression arn−1 can be used to determine the next terms of the given sequence−4,12,−36,108

Page 230 Problem 20 Answer

We are given an arithmetic sequence as 11,9,7,5 having the common difference of−2.

We are asked how would the pattern change if we take a new sequence having the same starting number as the given sequence, but its common difference is 4.

The given example started at11 and had a common difference of−2.

If the common difference is 4, the pattern would become an addition of 4,instead of an addition of−2.

The pattern would become an addition of 4,instead of an addition of−2.

Page 230 Problem 21 Answer

We are given an arithmetic sequence as11,9,7,5,………..has its common difference d=−2.

We are asked whether the given sequence remains arithmetic if we change the common difference to 4.

The given sequence will remain arithmetic as it still has a common difference d=4.

A sequence having the same starting point as the given sequence11,9,7,5………,but its common difference is 4 is also an arithmetic sequence.

Because all the sequences having a common difference between their consecutive terms are arithmetic sequences.

Carnegie Learning Algebra I Student Text Volume 1 3rd Edition Chapter 4 Exercise: 4.2 Sequences Page 230 Problem 22 Answer

We are given an arithmetic equation as11,9,7,5,………..has the common difference,d=−2.

We are asked to write the first five terms of a sequence having the same starting number as the given sequence, but its common difference is 4.

For that, we will use the formula An=a+(n−1)d wherea,n, and d are the first term, the number of terms, and the common difference of a sequence respectively.

We are given the first term,a=11 and the common difference,

d=4 of a sequence.

Now we will use these values in the formula An=a+(n−1)d, we get

The second term of the sequence

A2=11+(2−1)4

=11+4

=15​

The third term of the sequence is

A3=11+(3−1)4

=11+8

=19​

The fourth term of the sequence

A4=11+(4−1)4

=11+12

=23​

The fifth term of the sequence

A5=11+(5−1)4

=11+16

=27​

The first five terms of a sequence having the first term,a=11 and the common difference d=4 are11,15,19,23 and 27.

Page 230 Problem 23 Answer

We are given a set of sequences.

We are asked to list those sequences that are arithmetic.

For that, we will find the common difference of each sequence.

We are given,B=−4,−2,0,2,……. is an arithmetic sequence as it has a common difference of 2.

H=−20,−16,−12,−8,………..is an arithmetic sequence as it has a common difference of 4.

J=−5,−5/2,−5/4,−5/8,………. is an arithmetic sequence as it has a common difference of 5/2.

K=6.5,5,3.5,2,………. is an arithmetic sequence as it has a common difference of−1.5

N=1473.2,1452,7,1432.2,……… Is an arithmetic sequence as it has a common difference of−20.5.

B,H,J,K,N are the arithmetic sequences in problem 1.

Carnegie Algebra 1 Sequence Problems Explained

Carnegie Learning Algebra I Student Text Volume 1 3rd Edition Chapter 4 Exercise: 4.2 Sequences Page 230 Problem 24 Answer

We are given a set of sequences.

We are asked to write the common difference of each arithmetic sequence.

For that, we will find the difference between the successive term of a sequence.

We are given B,E,H,K,N are arithmetic sequences.

Now we will find the difference between the successive term of a sequence, we get

The common difference of

Sequence B is d=2

Sequence H is  d=4

Sequence J is d=5/2

Sequence K Is d=−1.5

Sequence N is  d=−20.5.

The common difference on each arithmetic sequence B,H,J,K,N is 2,4,−5/2,−1.5,−20.5.

Page 231 Problem 25 Answer

We are given a geometric sequence as1,2,4,8….. having its common ratio r=2

We are asked how would the pattern change if we consider a sequence having the same starting number as the given sequence, but its common ratio is 3.

The given sequence started at 1 and had a common ratio of 2. If the common ratio is 3, the pattern would become multiplied by 3 instead of multiplied by 2.

The pattern change of the given sequence is1,3,9,27,…. having the common ratio is 3.

Carnegie Learning Algebra I Student Text Volume 1 3rd Edition Chapter 4 Exercise: 4.2 Sequences Page 231 Problem 27 Answer

We are given a geometric sequence1,2,4,8,…….

We are asked whether the new sequence has the same starting number as the sequence in the worked example, but its common ratio of 3, is still a geometric sequence.

Yes, the sequence is still geometric since the sequence still has a common ratio,

The new sequence has the common ratio 3 is still a geometric sequence.

Page 231 Problem 28 Answer

We are given a geometric sequence1,2,4,8,…….having the common ratio of 2.

We are asked to write the first 5 terms for the new sequence having the same starting number as the sequence in the worked example, but its common ratio is 3.

For that, we will use the general formula arn−1

Where a,r and n are the first term, the common ratio, and the number of terms of a geometric sequence.

We are given

The first term,a=1

The common ratio,r=3

Now we will use the formula a rn−1 to determine the first five terms of the sequence, we get

The second term of the sequence

=1(3)2−1

=(3)1

=3​

The third term of the sequence

​=1(3)3−1

=(3)2

=9​

The fourth term of the sequence

​=1(3)4−1

=(3)3

=27​

The fifth term of the sequence

=1(3)5−1

=34

=81​

The first five terms for the new sequence are : 1,3,9,27,81

Page 232 Problem 29 Answer

We have been given a sequence as the same starting number and its common ratio is 1/3

We have been asked How would the pattern change.We will use the property of sequence.

The common ratio is 1/3.

The worked out example started at 1 which means the first term is 1 and had common ratio of 2.

If the common ratio is 1/3, the pattern would become multiplied by 1/3 instead of multiplied by 2.

The pattern would change as : the pattern would become multiplied by 1/3 instead of multiplied by 2.

Carnegie Learning Algebra I Student Text Volume 1 3rd Edition Chapter 4 Exercise: 4.2 Sequences Page 232 Problem 30 Answer

We have been given a sequence has the same starting number and its common ratio is 1/3.

We have been asked that Is the sequence still geometric? Why or why not.As the common ratio is 1/3.

Therefore, Yes, the sequence is still geometric because the sequence still has a common ratio.

We conclude that Yes, the sequence is still geometric since the sequence still has a common ratio.

Page 232 Problem 31 Answer

We have been given a sequence has the same starting number and its common ratio is 1/3.

We have been asked the first 6 terms for the new sequence.

We will use the Sequence method.

The common ratio is 1/3.

Let, the first 6 terms for the new sequence : a1,a2,a3,a4,a5,a6

The first term is a1=1

So, the next five terms are :

a2:1⋅1/3=1/3

a3:1/3(1/3)=1/9

a4:1/9(1/3)=1/27

a5:1/27(1/3)=1/81

a6:1/81(1/3)=1/243

Hence, the new sequence is : 1,1/3,1/9,1/27,1/81,1/243

The first 6 terms of new sequence are : 1,1/3,1/9,1/27,1/81,1/243

Page 232 Problem 32 Answer

We have been given a sequence has the same starting number and its common ratio is−2.

We have been asked the how would the pattern change.

The common ratio is−2.

The worked out example started at 1 which means the first term is 1 and had a common ratio is 2.

If the common ratio is−2, the pattern would become multiply by−2 instead of multiply by 2.

The pattern would change as : the pattern would become multiplied by−2 instead of multiplied by 2.

Carnegie Learning Algebra I Student Text Volume 1 3rd Edition Chapter 4 Exercise: 4.2 Sequences Page 232 Problem 33 Answer

We have been given a sequence has the same starting number and its common ratio is−2.

We have been asked that Is the sequence still geometric? Explain your reasoning.

As The common ratio is−2.

Yes, the sequence is still geometric because the sequence still has a common ratio.

Yes, the sequence is still geometric because the sequence still has a common ratio.

Page 232 Problem 34 Answer

We have been given a sequence has the same starting number and its common ratio is−2

We have been asked to find the first 6 terms for the new sequence.We will use the Sequence method.

The common ratio is −2.

Let, the first 6 terms of the new sequence are : a1,a2,a3,a4,a5,a6

The first term is a1=1

So, the other five terms are :

a2:1(−2)=−2

a3:−2(−2)=4

a4:4(−2)=−8

a5:−8(−2)=16

a6:16(−2)=−32

Hence, the new sequence is :1,−2,4,−8,16,−32

The first 6 terms for the new sequence are :1,−2,4,−8,16,−32

Page 232 Problem 35 Answer

We have been given two statements are given by Devona and Chase and a sequence.

We have been asked who is correct and explain the reason.

The common ratio is the value which we multiply by to get to the next term.

Dividing by 3 is the same as multiplying by 1/3. So, the common ratio is 1/3.

Therefore, Devon a is correct.

Devon is correct as we come to conclusion that 1/3 is a common ratio.

Page 233 Problem 36 Answer

In this question, we have to analyze the sequences we cut out in Problem 1.

We have to list those sequences that are geometric.

As we know, a geometric sequence is a sequence of numbers in which the ratio of every two consecutive numbers is always a constant.

In problem 1, we cut out the sequences through A to P.

From the sequences A to P, the sequences that had to multiply or divide were A,C,F,I,J,M, and P so these sequences are geometric.

The sequences that are geometric from A to P  is A,C,F,I,J,M,and P.

Page 233 Problem 37 Answer

In this question, we have to analyze the sequences we cut out in Problem 1.

We have to write the common ratio on each geometric sequence we cut out.

As we know, a geometric sequence is a sequence of numbers in which the ratio of every two consecutive numbers is always a constant.

In problem 1, we cut out the sequences through A to P.

Sequence A was multiplying by 2 so the common ratio is r=2.

Sequence C was multiplying by 3 so the common ratio is r=3.

Sequence F was multiplying by 0.1 so the common ratio is r=0.1,

Sequence I was multiplying by 10 so the common ratio is r=10.

Sequence Jwas dividing by 2 so the common ratio is r=1/2.

Sequence M was dividing by−4 so the common ratio is r=−1/4.

Sequence P was multiplying by−3 so the common ratio is r=−3.

The common ratio in each geometric sequence A,C,F,I,J,M,P we cut out is2,3,0.1,10,1/2,−1/4,−3.

Page 233 Problem 38 Answer

In this question, we have to consider the sequences from problem 1 that are neither arithmetic nor geometric.

We have to list those sequences.As we know, a geometric sequence is a sequence of numbers in which the ratio of every two consecutive numbers is always a constant.

And we also know that the arithmetic sequence is a sequence of numbers that follow a pattern of adding a fixed number from one term to the next.

In problem 1, the sequences we are given is A to P.

The sequences that were categorized as other Pattern were D,G,L, and O.

So, these are the sequences that are neither arithmetic nor geometric.

The sequence through A to P which are neither arithmetic nor geometric is D,G,L,O.

Page 233 Problem 39 Answer

In this question, we have to consider the sequences from problem 1 that are neither arithmetic nor geometric.

We have to explain why these sequences are neither arithmetic nor geometric.

As we know, a geometric sequence is a sequence of numbers in which the ratio of every two consecutive numbers is always a constant.

And we also know that the arithmetic sequence is a sequence of numbers that follow a pattern of adding a fixed number from one term to the next.

The sequences that neither arithmetic nor geometric because they don’t have common differences and common ratios.

These sequences are not arithmetic since they do not have a common difference and they are not geometric since they do not have a common ratio.

These sequences are not arithmetic since they do not have a common difference and they are not geometric since they do not have a common ratio.

Page 234 Problem 40 Answer

We have given the first two terms of Sequence: 3,6.

Here, Dante wrote the sequence for the given terms is3,6,9,12,…And Kirs wrote the sequence for the given terms is 3,6,12,24,… We have to tell who is correct and explain our reasoning.

Only knowing the first two terms is not enough terms to determine the pattern.

The sequence was written by Dante for the given terms 3,6,9,12,… was the arithmetic sequence

If the sequence is arithmetic, then Dante sequence is correct.

The sequence was written by Kira for the given terms 3,6,12,24,… was the geometric sequence sequence

If the sequence is geometric, then kira is correct.

Since the pattern cannot be determined, either sequence could be possible answer.

Dante and Kira both are correct.

The Dante sequence is an arithmetic sequence and Kira sequence is a geometric sequence.

Page 234 Problem 41 Answer

We have given that we use question 9 here.We have to write a sequence that is neither arithmetic nor geometric.

As we know, An arithmetic progression or arithmetic sequence is a sequence of numbers such that the difference between the consecutive terms is constant.

And In Geometric Sequence, each term is found by multiplying the previous term by a constant.

From question 9, we make a sequence from the given terms 3,6,…is 3,6,10,15,21,… which is not arithmetic.

Since it does not have a common difference and it is also not geometric.

Since it does not have a common ratio.

From the sequence, we get the pattern is add 3, add 4 , add 5, add 6,… since 3+3=6,

6+4=10,10+5=15, and 15+6=21

The sequence we take is 3,6,10,15,21,…and the pattern we get from the sequence that firstly add 3,then add 4, then add 5, then add 6,… and so on.

Practice Problems Carnegie Algebra Sequences Chapter 4.2

Carnegie Learning Algebra I Student Text Volume 1 3rd Edition Chapter 4 Exercise: 4.2 Sequences Page 234 Problem 42 Answer

In this question, we have to tell how many terms our partner needs before the pattern was recognized.

Here we use question 10.From question 10, the sequence we take there is 3,6,10,15,21,….Thus, my partner needed to know the first four terms to find the pattern.

So he/she could see the terms were going up by adding 3, then 4, and then 5.

My partner needed 4 terms before the pattern was recognized.

Page 234 Problem 43 Answer

In this question, the given sequence is2,2,2,2,2,……We have to identify the type of sequence it is and describe the pattern.

As we know, patterns are a set of numbers arranged in a sequence such that they are related to each other in a specific rule.

For the given sequence2,2,2,2,2,….

When2+0=2 the sequence could be arithmetic with a common difference of 0.

When2(1)=2 so the sequence could also be a geometric sequence with a common ratio of 1.

The given sequence 2,2,2,2,… is an arithmetic sequence when d=0 and geometric sequence when r=1.


Carnegie Learning Algebra I Student Text Volume 1 3rd Edition Chapter 4 Exercise: 4.1 Sequences

Carnegie Learning Algebra I Student Text Volume 1 3rd Edition Chapter 4 Sequences

Page 214 Problem 1 Answer

In the question, we have been given the four figures and we are supposed to analyze the figure with respect to the number of dots given in the figure.

For this, we will first calculate the total number of dots in each figure and try to formulate the same.

The first figure has 25 dots, the second has 21 dots, the third has 17 dots and the fourth has 13 dots.

Carnegie Learning Algebra I, Student Text, Volume 1, 3rd Edition, Chapter 4 Sequences 1 1

We can formulate the sequence as-

Figure1=6×4+1

Figure2=5×4+1

Figure3=4×4+1

Figure4=3×4+1

Hence, in general, we can write as Figure n=4n+1 where n is the figure sequence number.

The number of dots in the given figures are 25,21,17,13.

Carnegie Learning Algebra I, Student Text, Volume 1, 3rd Edition, Chapter 4 Sequences 1

The given pattern can be generalized as Figure n=4n+1 where n is the figure sequence

Carnegie Learning Algebra I Chapter 4 Exercise 4.1 Solutions

Carnegie Learning Algebra I Student Text Volume 1 3rd Edition Chapter 4 Exercise: 4.1 Sequences Page 214 Problem 2 Answer

We have been given a figure that consists of four dots patterns.

Our task is to draw the next three figures of the pattern.

Using the formula from part (a), we will find the result.

Carnegie Learning Algebra I Student Text Volume 1 3rd Edition Chapter 4 Exercise 4.1 Sequences

We have the formula 4n+1, where n represent the figure sequence number.

Now we need to find the next three patterns.

Implies the sequence number will be 2,1,0.

Then we get the number of dots as:

4(2)+1=9

4(1)+1=5

4(0)+1

Now we will draw the patterns, shown below.

Carnegie Learning Algebra I, Student Text, Volume 1, 3rd Edition, Chapter 4 Sequences 2

The next three-figure of the pattern will be:

Carnegie Learning Algebra I, Student Text, Volume 1, 3rd Edition, Chapter 4 Sequences 2 1

Carnegie Learning Algebra I Student Text Volume 1 3rd Edition Chapter 4 Exercise: 4.1 SequencesPage 214 Problem 3 Answer

We have been given a figure that consists of four dots patterns.

We have to write the sequence numerically to represent the number of dots in each of the first 7 figures.

Using the part (a),(b), we will write the sequence numerically.

From the part (a),(b), we have the sequence of the number of dots in the below figures as 25,21,17,13,9,5,1.

So,  the numerical sequence is 25,21,17,13,9,5,1.

Carnegie Learning Algebra I, Student Text, Volume 1, 3rd Edition, Chapter 4 Sequences 3

Here the sequence numerically represents the number of dots in each of the first 7 figures is 25,21,17,13,9,5,1

Page 215 Problem 4 Answer

We have been given a figure that consists of a pattern of the number of small squares.

We need to analyze the number of small squares in each figure and also describe the pattern.

First, we will first calculate the total number of small squares in each figure and then we will formulate it.

Here we have the figure shown below.

Carnegie Learning Algebra I, Student Text, Volume 1, 3rd Edition, Chapter 4 Sequences 4

From the figure, we observe the following,

The first big square consists of 49 small square as it has seven rows and seven columns.

The second big square consists of 36 small squares as it has six rows and six columns.

The third big square consists of 25 small squares as it has five rows and five columns.

The fourth big square consists of 16 small squares as it has four rows and four columns.

Now in general, we can formate the number of the small squares as n2, where n is the figure sequence number.

The pattern of the number of the small square in each figure is 49,36,25,16 and the pattern will be given by n2.

Sequences Chapter 4 Exercise 4.1 Answers

Carnegie Learning Algebra I Student Text Volume 1 3rd Edition Chapter 4 Exercise: 4.1 Sequences Page 215 Problem 5 Answer

We have been given a figure that consists of a pattern of the number of small squares.

We need to draw the next three figures of the pattern.

Using the pattern from the part (a), we will find the result.

From the part (a), we have the pattern as n2 where n is the number of the figure sequence.

Then we will have the next third sequence as:

Carnegie Learning Algebra I, Student Text, Volume 1, 3rd Edition, Chapter 4 Sequences 5 1

32=9

22=4

12=1​

The next three figures of the pattern will be:

Carnegie Learning Algebra I, Student Text, Volume 1, 3rd Edition, Chapter 4 Sequences 5

Page 215 Problem 6 Answer

We have been given a figure that consists of a pattern of the number of small squares.

We need to write the sequence numerically to represent the number of small squares in each of the first 7

Figures Using the part (a),(b), we will find the result.

From the part (a),(b)​, we have a numeric sequence to represent the number of small squares in each of the first 7 figures will be:

72=49

62=36

52=25

42=16

Also, we will have:

32=9

22=4

12=1

So, we get the numerical sequence as 49,36,25,16,9.4.1.

The numeric sequence of  the number of the small square in each figure is 49,36,25,16,9,4,1

Carnegie Learning Algebra I, Student Text, Volume 1, 3rd Edition, Chapter 4 Sequences 6

Page 215 Problem 7 Answer

We are given that AI begins with 150 eggs to make omelets.

After making 1,2and 3 omelets he has left 144,138,132 eggs respectively.

We are required to determine the number of eggs AI has left after making each omelets.

Here, we will solve this by using the definition of Arithmetic Sequence.

AI begins with=150 eggs

After making one omelet,the number of eggs left with him =150−6

=144

After making 2 omelets,the number of eggs left with him=144−6

=138

And finally,

After making 3 omelets  the number of eggs left with him =138−6

=132

We can observe that in each case we subtract the number six from the previous answer to get the next term.

The number of eggs AI has left after making each omelets is 150,144,138,132.

Here, we can observe the pattern that in each case we subtract the number six from the previous answer to get the next term.

Page 215 Problem 8 Answer

We are given that AI begins with 150 eggs to make his famous omelets, After making one omelets he has left 144 eggs.

After making 2 omelets he has 138 eggs left. After making 3 omelets he has 132 eggs left.

We are required to determine the number of eggs left after AI makes the next two omelets.

Here, we will solve this by using the definition of Arithmetic Sequence.

AI begins making of omelets with =150

After making one omelets the number of eggs left with him=150−6=144

After making 2 omelets, the number of eggs left with him=144−6=138

After making 3 omelets, the number of eggs left with him =138−6 =132

Hence, continuing, we get, After making 4 omelets, the number of eggs left with him =132−6=126

After making 5 omelets, the number of eggs left with him=126−6=120

The number of eggs left after AI makes the next two omelets are 126,120, respectively, which is obtained using the common difference.

Carnegie Learning Algebra I Sequences Exercise 4.1 Solutions

Carnegie Learning Algebra I Student Text Volume 1 3rd Edition Chapter 4 Exercise: 4.1 Sequences Page 215 Problem 9 Answer

We are given that Al begins with 150 eggs to make his famous omelets.

After making one omelets,he has 144 eggs left.

After making 2 omelets, he has 138 eggs left. After making 3 omelets, he has 132 eggs left.

We are required to determine the sequence of the number of eggs left after AI makes each of the first five omelets.

Here, we will solve this by using the definition of Arithmetic Sequence.

We calculated the number of the number of eggs left after Al makes each of the first 5 omelets, and got the answers, 150,144,138,132,126,120, which is the required sequence of numbers. (refer previous exercise)

The sequence of number of eggs left after AI makes each of the first five omelets is150,144,138,132,126,120, obtained using the common difference 6.

Page 216 Problem 10 Answer

We are given that Mario begins the mosaic with a single tile. Then he adds to single tile to create second square made up of 4 tiles.

The third square he adds is made up of 9 tiles, and four square he adds is made up of 16 tiles.

We are required to determine the number of tiles in each square and describe the pattern.

Here, we will use the definition of perfect square.

The number of tile in first square is,1{2}=1

The number of tiles in second square is,2{2}=4

The number of tiles in third square is,3{2}=9

The number of tiles in fourth square is, 4{2}=16

We can observe that each terms represent consecutive perfect square terms.

The number of tiles in each square is1,4,9,16, and we can observe the pattern present is that they are consecutive perfect squares.

Carnegie Learning Algebra I Student Text Volume 1 3rd Edition Chapter 4 Exercise: 4.1 Sequences Page 216 Problem 11 Answer

We are given that first square is made up of single tile, 2nd square is made up of four tiles, 3rd square is made up of nine tiles,4th square is made up of 16 tiles.

We are required to determine the number of tiles in the next two squares.

Here, we have to find out next two squares i.e. 5th and 6th.

In first square , number of tiles is, 1×1=1

In 2nd square , number of tiles is, 2×2=4

In 3rd square, no. of tiles is,3×3=9

In 4th square, no. of tiles is,4×4=16

In 5th square, the no. of tiles is,5×5=25

In 6th square, the no. of tiles is,6×6=36

The number of tiles in next two squares are 25,36, which is obtained by finding consecutive perfect squares.

Page 216 Problem 12 Answer

We are given that Mario begins the mosaic with a single tile.

Then he adds to single tile to create second square made up of 4 tiles.

The third square he adds is made up of 9 tiles, and four square he adds is made up of 16.

We are required to determine the sequence of number of tiles in each of the first six square.

Here, we will solve this by using the definition of Perfect squares.

We calculated the number of tiles in each of the 6 squares got the answers, 1,4,9,16,25,36, which is the required sequence of numbers. (refer previous exercise) First mario used one tile, which is the square of 1.

Then mario used 4 tiles ,which is the square of 2.Next he used 9 tiles which is the square of 3.

Next used 16 tiles which is the square of 4.In the fifth time he will use 25 tiles ,which is the square of 5.

For the sixth time he will use 36 tiles which is the square of 6.

Hence from

12=1,22

=4,32

=9,42

=16,52

=25,62

=36

we get The Final Answer,The sequence of number of tiles in each of the first six square is 1,4,9,16,25,36, which is obtained by finding the consecutive perfect squares.

Page 217 Problem 13 Answer

We have given a sequence of polygons that has one more side than the previous polygon.

We need to analyze the number of sides in each polygon and describe the pattern.

We are going to use the concepts of arithmetic progression to solve the question.

We have:

Number of sides in the nth term

Therefore,a1=3,a2=4,a3=5 and a6=6

Now,d=a2−a1

d=4−3

∴d=1​

Again,d=a3−a2

d=5−4

∴d=1

Since the value of d is constant.

Hence, the given sequence 3,4,5,6 is an arithmetic progression.

The pattern of the polygon given in the figure, i.e., 3,4,5,6,.. is an arithmetic progression.

Exercise 4.1 Sequences Explained

Carnegie Learning Algebra I Student Text Volume 1 3rd Edition Chapter 4 Exercise: 4.1 Sequences Page 217 Problem 14 Answer

In the following question, we have been given a figure.

We need to draw the next two figures of the pattern With the help of the given figure, we will find the result.

In the given figure, we get

Number of sides of the first figure =3

Number of sides of the second figure =4

The number of sides of the third figure =5

number of sides of the fourth figure =6

The number of sides of the fifth figure =7

The number of sides of the sixth figure =8

Then the next two figures will be:

Carnegie Learning Algebra I, Student Text, Volume 1, 3rd Edition, Chapter 4 Sequences 14

The next two figures of the pattern will be:

Carnegie Learning Algebra I, Student Text, Volume 1, 3rd Edition, Chapter 4 Sequences 14 1

Page 217 Problem 15 Answer

We have given a sequence of different types of polygons.

We need to find the sequence of the number of sides first six polygons.

We are going to use the concepts of arithmetic progression to solve the question.

We have:a1=3,a2=4,a3=5 and a4=6

Let the common difference bed,

d=a{2}−a{1}

=4−3

∴d=1

d=a{3}−a{4}

=5−4

∴d=1

Since the value of d is constant.

Therefore, the given sequence, i.e.,3,4,5,…is an arithmetic progression.

Now, we will be finding the 5th term and 6th term,

a5=3+(5−1)1=3+4

∴a5=7

a+=3+(6−1)×1

=3+5

∴a6=8

The sequence of the number of sides of the first six polygons is 3,4,5,6,7,8, which is in an arithmetic progression.

Page 218 Problem 16 Answer

In this question, we have been given Jacob’s pizza has a6-foot diameter, he starts to cut one whole pizza in half.

After that he cuts each of those slices in half, then he cuts each of those slices in half, and so on.

We need to think about the size of each slice concerning the whole pizza and describe the pattern.

By using the patterns, we will calculate the result.

First, we find out the common ratio

​r=a2/a1

=2/1

=2​

Similarly, we can find out r=a3/a2

The 4th term is =1×24−1

=23

=8​

The 5th term is ​=1×25−1

=24

=16

The pattern of the size of each slice concerning whole pizza is1,2,4,8,16. Since each contestant not only has to bake a delicious pizza, but they have to make the largest pizza they can.

Page 218 Problem 17 Answer

In this question, we have been given Jacob’s pizza has a 6-foot diameter, he starts to cut one whole pizza in half.

After that he cuts each of those slices in half, then he cuts each of those slices in half, and so on.

We need to find out the size of each slice compared to the original after the next two cuts.

By using the geometric sequence, we will calculate the result.

Here, the common difference is

r=a2/a1

=2/1

=2​

The 4th term is a4

=1×24−1

=1×23

=8

Then the5th term is a5

=1×25−1

=1×24

=16​

The size of each slice compared to the original after the next two cuts are 8 and 16.

Since each contestant not only has to bake a delicious pizza, but they have to make the largest pizza they can.

Page 218 Problem 18 Answer

In this question, we have been given Jacob’s pizza has a 6-foot diameter, he starts to cut one whole pizza in half.

After that he cuts each of those slices in half, then he cuts each of those slices in half, and so on.

We need to write the sequence numerically to represent the size of each slice compared to the original after each of the first 5 cuts.

By using the geometric sequence, we will calculate the result.

Here, the common ratio is

r=a2/a1

=2/1

=2

​Now, by putting the formula the 4th term is

=1×24−1

=23

=8

the5th term is

=1×25−1

=24

=16​

The sequence of the size of each slice compared to the original after each of the first five cuts is 1,2,4,8,16. Since each contestant not only has to bake a delicious pizza, but they have to make the largest pizza they can.

Page 218 Problem 19 Answer

In this question, we have been given Miranda’s uncle purchased a rare coin for $5.

He claims that the value of the coin will triple each year, so the value of the coin will be $15 next year, again the value of the coin will be $45 and $135 in 2 years and 3 years respectively.

We need to find out how the coin value changes each year i.e. how many times the value of the coin increased according to the previous year.

By using the geometric sequence, we will calculate the result.

The common ratio in this sequence is

r=a2/a1

=15/5

=3​

We can find the next two by putting the formula,

The 5th term is

=5×35−1

=5×34

=405

The 6th term is

=5×36−1

=5×35

=1215​

The value of the coin increased 3 times according to the previous year and the pattern is 5,15,45,135,405,1215.

Page 218 Problem 20 Answer

In this question, we have been given Miranda’s uncle purchased the rare coin for $5.

He claims that the value of the coin will triple each year.

So the value of the coin in the first year will become $15, then in 2 years, the value of the coin will become $45, in 3 years the value of the coin will become $135.

We need to find out the value of the coin after 4 years and 5 years i.e. next two-term a5,a6.

By using the geometric sequence, we will calculate the result.

Here, the common ratio is

r=a2/a1=3​

Now, we can see that the next term is

The 5th term is

=5×35−1

=5×34

=405

The 6th term is

=5×36−1

=5×35

=1215​

The value of the coin after 4 years and after 5 years are 405,1215 respectively.

Since he claims that the value of the coin will triple each year.

Chapter 4 Exercise 4.1 Carnegie Learning Guide

Carnegie Learning Algebra I Student Text Volume 1 3rd Edition Chapter 4 Exercise: 4.1 Sequences Page 218 Problem 21 Answer

In this question, we have been given Miranda’s uncle purchased the rare coin for $5 He claims that the value of the coin will triple each year.

So the value  of the coin in the first year will be $15, then in two years, the value of the coin will be $45, then in three years, the value of the coin will be$135

We need to find the sequence of the value of the coin after each of the first five years. By using the geometric sequence, we will calculate the result.

Here the common ratio is

r=a2/a1

=15/5

=3​

Now, we can find the 5th term is

a5=5×35−1

a5=5×34

a5=405

The 6th term is a6=5×36−1

a6=5×35

a6=1215​

The sequence of the value of the coin after each of the first five years is 5,15,45,135,405,1215.

Since he claims that the value of the coin will triple each year.

Page 220 Problem 22 Answer

We have been given a sequence in which has first term is 64, and after that, each term is calculated by dividing the previous term by 4.

We have been asked that If Margaret is correct, explain why, and If Jasmine is correct, predict the next two terms of the sequence.

We will use dividing and calculate the result.

Jasmine is accurate as it does not stipulate that the sequence cannot include fractions.

Margaret would be correct if the sequence reflected anything that could only be expressed by full numbers.

Now, we are finding the next two-term,5th term=a×r5−1

=64×(1/4)4

=0.25

Further solving, 6th term=a×r6−1

=64×(1/4)5

=0.0625​

Jasmine is accurate as the sequence can include fractions and Margaret would be correct if the series represented only whole integers and the next two terms of this sequence are 0.25,0.0625.

How To Solve Sequences Exercise 4.1

Carnegie Learning Algebra I Student Text Volume 1 3rd Edition Chapter 4 Exercise: 4.1 SequencesPage 221 Problem 23 Answer

We have been given a pattern. We have been asked to explain the pattern shown in the figure is finite or infinite.

Here the pattern represents a finite sequence.

Each figure must have a natural number of blocks, hence the sequence must terminate with the last figure with only one block.

As a result, the sequence is complete.

There is no way to represent the next term with a figure because numerically, the next term is 0.

The pattern represents a finite sequence there is no way to represent the next term with a figure because numerically, the next term 0.

Carnegie Learning Algebra I Student Text Volume 1 3rd Edition Chapter 3 Exercise 3.4 Linear Functions

Carnegie Learning Algebra I Student Text Volume 1 3rd Edition Chapter 3 Linear Functions

Page 196 Problem 1 Answer

Given Alexis is a flower vendor who grows and sells her own fresh-cut flowers.

She has a stand in the city, and she distributes flowers to pedestrians during the day.

She charges $ 5  for each flower, and each month she randomly gives away two flowers for free.

We have to write a linear function, a(x) to represent how much money Alexis earns each month.

Use x to represent the number of flowers she sells each month. Write the function in the simplest form.

Remember Alexis earn on x−2 flower every month.

Alexis distributes x flowers every month and each month she randomly gives away two flowers for free

So she earn on x−2 flowers

She charges $ 5  for each flower

Then her total earning is a(x)=5(x−2)

A  linear function represents total earning is a(x)=5(x−2).

Carnegie Learning Algebra I Student Text Volume 1 3rd Edition Chapter 3 Exercise 3.4 Linear Functions

Page 196 Problem 2 Answer

Given Alexis is a flower vendor who grows and sells her own fresh-cut flowers.

She has a stand in the city, and she distributes flowers to pedestrians during the day.

She charges $ 5  for each flower, and each month she randomly gives away two flowers for free.

We have to answer what property did you use to write the simplified form of the function.

Distribute the x.

The function is a(x)=5(x−2)

Use distributive property a(x)=5x−10

Use the distributive property to write the simplified form of the function.

Carnegie Learning Algebra I Chapter 3 Exercise 3.4 Solutions

Carnegie Learning Algebra I Student Text Volume 1 3rd Edition Chapter 3 Exercise 3.4 Linear Functions Page 196 Problem 3 Answer

Given Alexis is a flower vendor who grows and sells her own fresh-cut flowers.

She has a stand in the city, and she distributes flowers to pedestrians during the day.

She charges $ 5  for each flower, and each month she randomly gives away two flowers for free

We have to describe the function. Is it increasing or decreasing and Is it discrete or continuous, and explain our reasoning.

The function is increasing since her earing is increasing as the number of flowers she distributes.

The x must be a whole number, the graph is discrete since the domain is not all real numbers.

The function is increasing since her earing is increasing as the number of flowers she distributes and the graph is discrete since the domain is not all real numbers.

Page 197 Problem 4 Answer

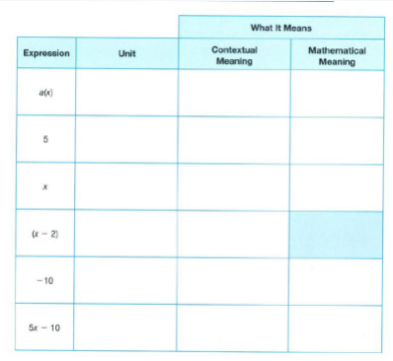
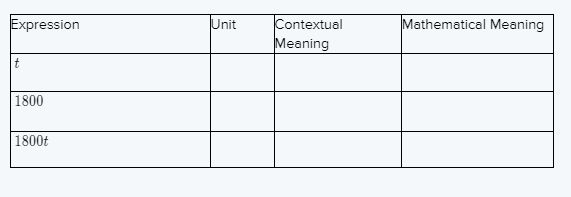
Here we have to complete the table shown.

First, determine the unit of measure for each expression.

Then, describe the contextual meaning of each part of the function.

Finally, choose a term from the word box to describe the mathematical meaning of each part.

input value output value  rate of change   y-intercept

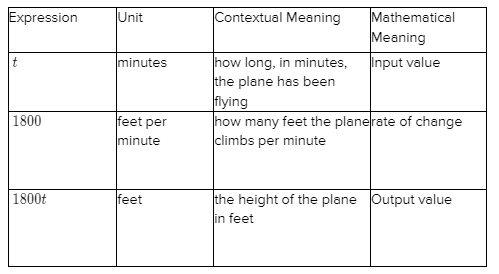
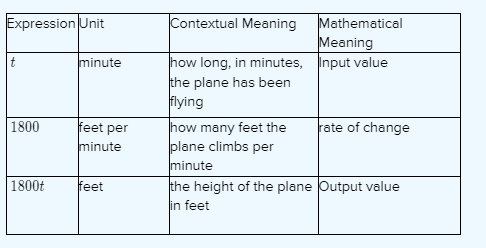
Carnegie Learning Algebra I, Student Text, Volume 1, 3rd Edition, Chapter 3 Linear Functions 4

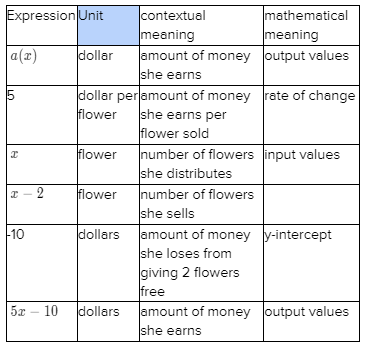
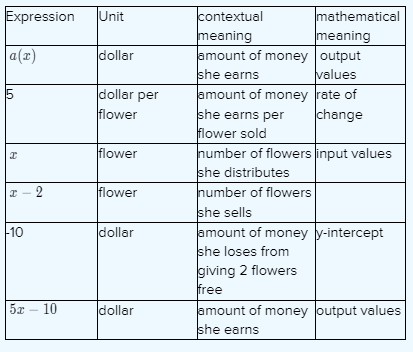
Expression a(x) addresses the measure of cash she procures so its unit is dollars and its numerical importance is the yield.

Expression 5 addresses the sum she procures per bloom sold so its unit is dollars per blossom and its numerical significance is pace of progress.

Expression x addresses the quantity of blossoms she circulates so its unit is a number of blossoms and its numerical importance is input.

Expression(x−2) addresses the quantity of blossoms she brings in cash from so its unit is blossoms yet it doesn’t have numerical importance (which is the reason the phone is concealed in the table in your book).

Expression−10 is the y-block of the improved on structure a(x)=5x−10. Its unit should then be a similar unit as a(x).

Since the y-block happens when x=0,−10 is the measure of cash she loses when she conveys 0 blossoms.

That is, it addresses the measure of cash she loses from parting with 2 blossoms.

Expression 5x−2 is equivalent to a(x) so it has a similar unit, context-oriented importance, and numerical significance as a(x).

Carnegie Learning Algebra I, Student Text, Volume 1, 3rd Edition, Chapter 3 Linear Functions 4 1

Carnegie Learning Algebra I, Student Text, Volume 1, 3rd Edition, Chapter 3 Linear Functions 4 2

Page 197 Problem 5 Answer

Given Alexis is a flower vendor who grows and sells her own fresh-cut flowers.

She has a stand in the city, and she distributes flowers to pedestrians during the day.

She charges $ 5  for each flower, and each month she randomly gives away two flowers for free.

We have to find how much will Alexis earn in a month if she distributes 45 flowers and show our work.

Substitute x=45 in equation.

The equation for the amount she earn

a(x)=5x−10

Substitutex=45

a(x)=5(45)−10

=255−10

=215

Hence, she earn $215.

If she distributes 45 flowers she earn $215.

Page 198 Problem 6 Answer

Given Bashir is also a flower vendor in a different part of the same city.

He sells flowers for $3 each and gives away 4 flowers for free each month.

He also earns an extra $6 each month by selling one of his homemade bracelets.

We have to write a linear function, b(x), to represent the amount of money Bashir earns each month and be sure to simplify our function.

Remember Bashir earn on x−4 flowers and one of his homemade bracelets.

He sells x flowers and gives away 4 flowers for free each month

So he earn onx−4 flowers

He charges $3 for each flower then he earn 3(x−4) on flower

He also earns an extra $6 each month by selling one of his homemade bracelets.

then the total earing b(x)=3(x−4)+6

simplifying the equation

b(x)=3x−12+6

b(x)=3x−6

A  linear function represents total earning is b(x)=3x−6.

Linear Functions Chapter 3 Exercise 3.4 Answers

Carnegie Learning Algebra I Student Text Volume 1 3rd Edition Chapter 3 Exercise 3.4 Linear Functions Page 198 Problem 7 Answer

Given Bashir is also a flower vendor in a different part of the same city.

He sells flowers for $3 each and gives away 4 flowers for free each month.

He also earns an extra $6 each month by selling one of his homemade bracelets.

We have to explain the meaning of the rate of change and the y-intercept of each function.

In  Alexis’ functiona(x)=5x−10 here rate of change 5 represents the amount of money she earns per flower and the y-intercept amount of money she lose by giving 2 flowers free.

In Bashir’s functionb(x)=3x−6 here rate of change 3 represents the amount of money he earns per flower and the y-intercept amount of money she lose by giving 4 flowers free but earns $6 from selling braclet.

In Alexis’ function here rate of change 5 represents the amount of money she earns per flower and the y-intercept amount of money she lose by giving 2 flowers free and in Bashir’s function here rate of change 3 represents the amount of money he earns per flower and the y-intercept amount of money she lose by giving 4 flowers free but earns $6 from selling braclet.

Page 198 Problem 8 Answer

Given Bashir is also a flower vendor in a different part of the same city.

He sells flowers for $3 each and gives away 4 flowers for free each month.

He also earns an extra $6 each month by selling one of his homemade bracelets.

We have to compare the units of the: output values, input values, rate of change, andy-intercepts of both functions and what do we notice.

The output value and input value and y-intercept have the same unit of the dollar, the input values have a unit of the number of the flower and the rate of change have unit of dollar per flower both functions have the same unit and positive rate change and negative y-intercept.

After comparing the units we notice both functions have the same unit and positive rate change and negative y-intercept.

Page 199 Problem 9 Answer

Given Bashir and Alexis decide to become business partners and combine their monthly earnings.

They will each continue to sell to their own customers in different parts of the city.

Bashir distributes twice as many flowers each month as Alexis.

We have to find at the end of the month when Alexis and Bashir combine their earnings, about how much will they will earn from each flower sold and explain our prediction.

Find the average of their both they will earn from each flower.

Alexis sells each flower at $5 and Bashir sells each flower at $3.

For combing earning find the average of their both they will earn from each flower.

Thus, 5+3/2

=8/2 =4

Hence, both combine earing is $4.

They will earn $4 from each flower sold.

Carnegie Learning Algebra I Student Text Volume 1 3rd Edition Chapter 3 Exercise 3.4 Linear Functions Page 199 Problem 10 Answer

Given suppose in one month Alexis distributes 20 flowers.

We have to use Alexis’ function to calculate her earnings and show our work.

Substitutex=20 in the equation.

The equation for the amount she earn

a(x)=5x−10

Substitutex=20

a(x)=5(20)−10

a(x)=100−10

a(x)=90

Hence, she earn $90.

Page 199 Problem 11 Answer

Given suppose in one month Alexis distributes 20 flowers.

We have to use Bashir’s function to calculate her earnings and show our work.

Substitutex=40 in the equation.

The equation for the amount he earn b(x)=3x−6

Bashir distributes twice as many flowers each month as Alexis.

So substitutex=40

b(x)=3(40)−6

=120−6

=144

Hence, he earn $144.

If in one month Alexis distributes 20 flowers then from Bashir’s function his earning is $144.

Page 199 Problem 12 Answer

Given suppose in one month Alexis distributes 20 flowers.

We have to find how much money would Bashir and Alexis make together if they combined their earnings.

Find the sum of both they earn.

Alexis earn $90 and Bashir earn $144

So they both combined earning is 90+114=204

Hence,  they both combined earning is $204.

Bashir and Alexis combined earnings is $204.

Carnegie Learning Algebra I Linear Functions Exercise 3.4 Solutions

Carnegie Learning Algebra I Student Text Volume 1 3rd Edition Chapter 3 Exercise 3.4 Linear Functions Page 199 Problem 13 Answer

Given suppose in one month Alexis distributes 20 flowers.

We have to use our answer to part (c) to determine the average selling price of each flower after Alexis and Bashir combined their earnings and does this match our prediction Find the ratio of their both earnings and their sold flower.

They both sold a 20+40=60 flower And they combined earning is $204

Then the average selling price is 204/60=3.40

This is less than our prediction.

The average selling price of each flower is $3.40 it is less than our prediction.

Page 200 Problem 14 Answer

Given Nick tried to write a new function, c(x), to represent Alexis’ and Bashir’s combined earnings. He said, “I can add the two functions like this:

c(x)=a(x)+b(x)

c(x)=5x−10+3x−6

=8x−16

Madison disagreed. She said, “That’s not right. You can’t add the functions because the x-values in the two functions don’t mean the same thing, so they might be different values.”

We have to tell who’s correct -Madison or Nick and explain your reasoning.Madison is right.

The x in a(x) addresses the quantity of blossoms Alexis dispersed and the x in $b(x)$ addresses the quantity of blossoms Bashir conveyed.

Since Bashir dispersed twice however many blossoms as Alexis, the worth of x are not the equivalent.

To consolidate the capacities to make c(x), the x in b(x)=3x−6 would need to be supplanted with 2x giving b(x)=3(2x)−6=6x−6 so the x in every situation address similar worth of the quantity of blossoms Alexis dispersed.

Madison is right x represent different values in each function so Bashir sold twice flowers as Alexis.

Page 200 Problem 15 Answer

Here we have to use our answers to Question 4 and Nick’s function to show why his function is not correct and explain our method Use Nick’s function isc(x)=8x−16

where x is the number of flowers they sell.

From  Question 4 Bashir and Alexis make together earned  $204 and they sell 60 flowers together.

Nick’s function isc(x)=8x−16where x is the number of flowers they sell.

So c(60)=8(60)−16

=480−16

=464≠204

Nick’s function is not correct because c(x)≠204.

Exercise 3.4 Linear Functions Explained

Carnegie Learning Algebra I Student Text Volume 1 3rd Edition Chapter 3 Exercise 3.4 Linear Functions Page 200 Problem 16 Answer

Here we have to answer what does the slope represents in Nick’s function and how does this compare with your answer to Question 4, part (d)The slope of the Nick equation c(x)=8x−16 is 8 it represents the average price per flower.

But in  Question 4 , part (d) average price per flower is $4 it does not increase.

In  Nick equation is 8 presents the average price per flower but in  Question 4, part (d) average price per flower is $4 it does not increase.

Page 201 Problem 17 Answer

Given Nick could actually add the two functions together.

However, he did not recognize that the input values were different for Alexis and Bashir.

To add two functions together, you must ensure the input values represent the same thing in both functions.

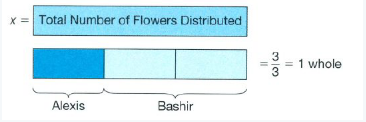
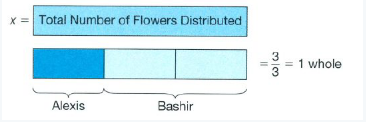
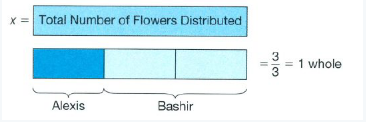
A model can be used to represent the input values Let x represent the total number of flowers Alexis and Bashir distribute each month.

The model shows that Bashir distributes twice as many flowers as Alexis each month and that together the number of flowers adds up to x.

Carnegie Learning Algebra I, Student Text, Volume 1, 3rd Edition, Chapter 3 Linear Functions 16

We have to write an expression to represent Alexis’ share of the total flowers distributed.

Then write an expression to represent Bashir’s share of the total flowers distributed.

Let $x$ represent the total number of flowers distributed.

If x is the total number of flowers distributed.

From the model  Bashir’s share of the total flowers distributed is 2/3x.And Alexis’ share of the total flowers distributed is 1/3x.

An expression to represent Alexis’ share is 1/3x and  Bashir’s share is 2/3x.

Page 201 Problem 18 Answer

Given Nick could actually add the two functions together. However, he did not recognize that the input values were different for Alexis and Bashir.

To add two functions together, you must ensure the input values represent the same thing in both functions.

A model can be used to represent the input values.

Carnegie Learning Algebra I, Student Text, Volume 1, 3rd Edition, Chapter 3 Linear Functions 18

We have to rewrite Alexis’ and Bashir’s functions so they show each person’s share of the total earnings.

Then, add the functions to determine a new function, c(x), that describes the combined amount of money Alexis and Bashir earn each month and show our work.

Replace x with  in the Alexis function with1/3x and with 2/3x in the Bashir equation.

Then add both equations.

The  Alexis function a(x)=5x−10

Replace x with 1/3x in the Alexis function right side

a(x)=5(1/3x)−10

a(x)=5/3

x−10

The Bashir equation b(x)=3x−6

Replace x with 2/3x in the Bashir equation right side

b(x)=3(2/3x)−6

b(x)=6/3

x−6

Now add both equations for the total earnings.

c(x)=a(x)+b(x)

=5/3x−10+6/3x−6

=11/3x−16

≈3.67x−16

Alexis’  person’s share equation is a(x)=5/3x−10,  Bashir person’s share equation is b(x)=6/3x−6 and the combined equationc(x)=3.67x−16.

Page 201 Problem 19 Answer

Given Nick could actually add the two functions together.

However, he did not recognize that the input values were different for Alexis and Bashir.

To add two functions together, you must ensure the input values represent the same thing in both functions.

A model can be used to represent the input values.

Let x represent the total number of flowers Alexis and Bashir distribute each month.

The model shows that Bashir distributes twice as many flowers as Alexis each month and that together the number of flowers adds up to x.

Carnegie Learning Algebra I, Student Text, Volume 1, 3rd Edition, Chapter 3 Linear Functions 19

We have to answer what does the slope of the new function mean and what does the y-intercept of the new function meanThe new function is c(x)=3.67x−16

where the slope of the equation is 3.67 it represents the average rate per flower and the y-intercept is -16 it represents the total amount of flower they in give free.

The slope 3.67 it represents the average rate per flower and the y-intercept is -16 it represents the total amount of flower they give free.

Chapter 3 Exercise 3.4 Carnegie Learning Guide

Carnegie Learning Algebra I Student Text Volume 1 3rd Edition Chapter 3 Exercise 3.4 Linear Functions Page 202 Problem 20 Answer

Given Alexis and Bashir decide to partner with an investor.

The investor will supply money for equipment, flower seeds, and other materials. In return, the investor will receive $ 0.50 for every flower distributed.

We have to answer In this case, why was it possible to determine a new function without rewriting d(x).

In both functions, x represents the total number of flowers they distribute so they have the same input values that’s why it was not we can write a new function without rewriting d(x).

Both functions have the same input values that’s why it was not we can write a new function without rewriting d(x).

Page 202 Problem 21 Answer

Given Alexis and Bashir decide to partner with an investor.

The investor will supply money for equipment, flower seeds, and other materials.

In return, the investor will receive $ 0.50 for every flower distributed We have to think about each problem situation and compare the functions t(x) and c(x) and what do we notice.

The functions t(x)=3.17x−16 and c(x)=3.67x−16.

They both have a y-intercept means the amount flower they give free it’s not affected by the amount.

The slope t(x) is 0.05 less than c(x)because the investor has a share 0.05 per flower.

They both have a y-intercept and The slope t(x) is 0.05 less than c(x).

Carnegie Learning Algebra I Student Text Volume 1 3rd Edition Chapter 3 Exercise 3.3 Linear Functions

Carnegie Learning Algebra I Student Text Volume 1 3rd Edition Chapter 3 Linear Functions

Page 188 Problem 1 Answer

Given the normal temperature for the human body is 98.6oF

we have to find the temperature is that in degrees Celsius. Use the formula to convert degrees Fahrenheit to degrees Celsius.

Formula is C=5/9(F−32)

SubstituteF=98.6

C=5/9(98.6−32)

=5/9×66.6

=37

Hence, the temperature is37oC.

The temperature is 37oC.

Carnegie Learning Algebra I Student Text Volume 1 3rd Edition Chapter 3 Exercise 3.3 Linear Functions

Carnegie Learning Algebra I Student Text Volume 1 3rd Edition Chapter 3 Exercise 3.3 Linear Functions Page 188 Problem 2 Answer

Given the directions on a box of cake batter tells you to bake your cake at 177oC

we have to find the temperature is that in degrees Fahrenheit.

Use the formula to convert degrees Celsius to degrees Fahrenheit.

Formula is C=5/9(F−32)

SubstituteC=177

177=5/9(F−32)

177×9/5=F−32

318.6=F−32

F=350.6

Hence, the temperature is 350.6oF.

The temperature is 350.6oF.

Carnegie Learning Algebra I Chapter 3 Exercise 3.3 Solutions

Page 189 Problem 3 Answer

GivenC=5/9(F−32)

Here we have to tell is there a more efficient way to determine degrees Fahrenheit than the method you used in Question 3

To determine degrees Fahrenheit more efficient way you can solve literal Equations C=5/9(F−32)

for F And then substituteC=177 to find the temperature in degrees Fahrenheit.

Solve literal Equations C=5/9(F−32) for F and then substituteC=177 to find the temperature in degrees Fahrenheit.

Page 189 Problem 4 Answer

Given C=5/9(F−32)

We have to convert the given formula to determine degrees Fahrenheit and show and explain our work.

Solve literal Equations C=5/9(F−32) for F.

Given C=5/9(F−32)

We have to convert the given formula to determine degrees Fahrenheit

So, multiply 9/5 on both sides

C×9/5=F−32

Add 32 on both sides

9C/5+32=F

The formula to determine degrees Fahrenheit is F=9C/5+32

Carnegie Learning Algebra I Student Text Volume 1 3rd Edition Chapter 3 Exercise 3.3 Linear Functions Page 189 Problem 5 Answer

Given the hottest temperature ever recorded on Earth occurred in Africa in 1922. It was recorded as 57.8oC.

we have to find the temperature is that in degrees Fahrenheit.Use the formula to convert degrees Celsius to degrees Fahrenheit.

Formula is F=9C/5+32

SubstituteC=57.8

F=9(57.8)/5+32

=104.04+32

=136.04

Hence, the temperature is136.04oF

The temperature is 136.04oF.

Page 189 Problem 6 Answer

Given dry ice melts at−78oC.

we have to find the temperature in degrees Fahrenheit does dry ice melt

Use the formula to convert degrees Celsius to degrees Fahrenheit.

Formula is F=9C/5+32

SubstituteC=−78

F=9(−78)/5+32

=−140.4+32

=−108.4

Hence, the temperature is −108.4oF.

The temperature in degrees Fahrenheit does dry ice melt is −108.4oF

Carnegie Learning Algebra I Student Text Volume 1 3rd Edition Chapter 3 Exercise 3.3 Linear Functions Page 190 Problem 7 Answer

Given in the original equations, the coefficients 9/5 and 5/9 as well as the constant 32 had meaning based on temperature.

We have to find what do the coefficients, 9 and 5 and the constant 160 represent in Carlos’s and Mikala’s equations. In the original equations, the coefficients 9/5 and 5/9

were slope of so they gave the rate of change in temperature and was a y-intercept so it gave the temperature when C=0 in F=9/5 C+32.

The coefficients, 9 and 5, and the constant 160 do not represent any things because they do not  represent slope or y-intercept.

The coefficients, 9 and 5 and the constant 160 do not represent any things in Carlos’s and Mikala’s equations.

Page 191 Problem 8 Answer

Given the equation 6x+5y=20

We have to identify the  Slope-intercept form and show our work.Solve the equation for y.

Given 6x+5y=20

We have to identify the  Slope-intercept form

Subtract 6x on both side

5y=20−6x

Divide both sides by 5

y=−6/5x+4

Hence, the Slope-intercept form is y=−6/5x+4.

The Slope-intercept form of 6x+5y=20 is y=−6/5x+4.

Page 191 Problem 9 Answer

Given the equation6x+5y=20

We have to identify the x-intercept and show we work.

Solve the equation for x and substitutey=0.

Given the equation6x+5y=20

The x-intercept is the point where the function graph meets the x-axis.

then at x-axis y=0 Substitute y=0 in equation

6x+5(0)=20

6x=20

x=10/3

Hence, the x-intercept is x=10/3.

The x-intercept form of6x+5y=20

Is x=10/3.

Linear Functions Chapter 3 Exercise 3.3 Answers

Carnegie Learning Algebra I Student Text Volume 1 3rd Edition Chapter 3 Exercise 3.3 Linear Functions Page 191 Problem 10 Answer

Given the equation6x+5y=20

We have to identify the y-intercept and show our work.Solve the equation for y and substitutex=0.

Given the equation6x+5y=20

The y-intercept is the point where the function graph meets the y-axis.

then at y-axis x=0 substitutex=0 in equation 6(0)+5y=20

5y=20

y=4

Hence, the y-intercept is y=4.

The y-intercept form of 6x+5y=20 is y=4.

Page 191 Problem 11 Answer

Given the equation 6x+5y=20

We have to identify the slope and show we work.Compare this equation with y=mx+c.

Given the equation6x+5y=20 and from previews part slope-intercept form is y=−6/5x+4

Compare this equation withy=mx+c

Thus  m=−6/5

Hence, the slope is −6/5.

The slope of 6x+5y=20 is−6/5

Page 191 Problem 12 Answer

Given the equation y=−2/3x+10

We have to identify the standard form and show our work.

First, get rid of the factor and x and y on one side and constant on the other.

Giveny=−2/3x+10

We have to identify the standard form

Multiply both sides by 3.

3×y=3(−2/3x+10)

3y=−2x+30

3y−2x=30.

Hence, the standard form is 3y−2x=30.

The standard form ofy=−2/3x+10 is 3y−2x=30.

Carnegie Learning  Algebra I Student Text Volume 1 3rd Edition Chapter 3 Exercise 3.3 Linear FunctionsPage 191 Problem 13 Answer

Given the equationy=−2/3x+10

We have to identify the x-intercept and show we work.

Solve the equation for x and substitute y=0.

Given the equation y=−2/3x+10

The x-intercept is the point where the function graph meets the x-axis.

then at x-axis y=0 Substitute y=0

0=−2/3x+10/2/3

x=10

x=30/2

x=15

Hence, the x-intercept is x=15.

The x-intercept form ofy=−2/3x+10 is x=15.

Page 191 Problem 14 Answer

Given the equation y=−2/3x+10

We have to identify the y-intercept and show our work.

Solve the equation for y and substitute x=0.

Given the equation y=−2/3x+10

The y-intercept is the point where the function graph meets the y-axis.

then at y-axis x=0 substitutex=0

y=−2/3(0)+10

y=10

Hence, the y-intercept is y=10.

The y-intercept form of y=−2/3x+10 is y=10.

Carnegie Learning Algebra I Linear Functions Exercise 3.3 Solutions

Carnegie Learning Algebra I Student Text Volume 1 3rd Edition Chapter 3 Exercise 3.3 Linear Functions Page 191 Problem 15 Answer

Given the equation y=−2/3x+10

We have to identify the slope and show we work.

Compare this equation with y=mx+c

Given the equation y=−2/3x+10

Compare this equation with y=mx+c

Thus m=−2/3

Hence, the slope is−2/3.

The slope ofy=−2/3x+10 is−2/3.

Page 192 Problem 16 Answer

Given the equation Ax+By=C

We have to identify the  Slope-intercept form and show our work.Solve the equation for y.

Given on both side Ax+By=C

We have to identify the  Slope-intercept form

Subtract Ax on both side

By=C−Ax

Divide both sides by B

y=−A/Bx+C/B

Hence, the Slope-intercept form is y=−A/Bx+C/B

The Slope-intercept form of Ax+By=C is y=−A/Bx+C/B.

Page 192 Problem 17 Answer

Given the equation Ax+By=C

We have to identify the x-intercept and show we work.

Solve the equation for x and substitute y=0.

Given the equation Ax+By=C

The x-intercept is the point where the function graph meets the x-axis.

then at x-axis y=0 Substitute y=0 in equation

Ax+B(0)=C

Ax=C

x=C/A

Hence, the x-intercept is x=C/A.

The x-intercept form of Ax+By=C is x=C/A.

Carnegie Learning Algebra I Student Text Volume 1 3rd Edition Chapter 3 Exercise 3.3 Linear FunctionsPage 192 Problem 18 Answer

Given the equation Ax+By=C

We have to identify the y-intercept and show our work.

Solve the equation for y and substitute y=0.

Given the equation Ax+By=C

The y-intercept is the point where the function graph meets the y-axis.

then at y-axis x=0

substitutex=0 in equation

A(0)+By=C

By=C

y=B/C

Hence, the y-intercept is y=B/C

The y-intercept form of Ax+By=C is y=B/C.

Page 192 Problem 19 Answer

Given the equation Ax+By=C

We have to identify the slope and show we work.

Compare this equation with y=mx+c.

Given the equationAx+By=C and from previews part slope-intercept form is y=−A/Bx+C/B

Compare this equation with y=mx+c

Thus, m=−A/B

Hence, the slope is−A/B

The slope of A x+By=C is−A/B.

Page 192 Problem 20 Answer

Here we have to tell if we want to determine the y-intercept of an equation, which form is more efficient, and explain our reasoning.

To determine the y-intercept of an equation slope-intercept form is more efficient.

Because in slope-intercept we can easily find the value of y-intercept is b by compare with y=mx+b.

To find y-intercept slope-intercept formy=mx+b  is more efficient because the y-intercept is b.

Page 192 Problem 21 Answer

Here we have to tell if we wanted to graph an equation on a calculator, which form is more efficient, and explain our reasoning.

To graph, an equation on our calculator slope-intercept form is more efficient.

Because to graph equation must be solved for y and in slope-intercept form equation already solved for y.

To graph, an equation on our calculator slope-intercept form is more efficient Because to graph equation must be solved for y and in slope-intercept form equation already solved for y.

Exercise 3.3 Linear Functions Explained

Carnegie Learning Algebra I Student Text Volume 1 3rd Edition Chapter 3 Exercise 3.3 Linear FunctionsPage 193 Problem 22 Answer

Given Think Inside the Box is manufacturing new boxes for You Pack ‘Em, We Ship ‘Em (YPEWSE).

YPEWSE told Think Inside the Box that the boxes must have a specific volume and area.

However, YPEWSE did not specify a height for the boxes.

We have to write a literal equation to calculate the volume of a box.

We know the box has a cube shape.

So the formula of volume of a box is V=Bh where B is the area of the base and h is its height.

A literal equation to calculate the volume of a box is V=Bh where B is the area of the base and h is its height.

Page 193 Problem 23 Answer

Given the equation V=Bh

We have to convert the volume formula to solve for height.

Solve the equationV=Bh for h.

Given V=Bh

We have to convert the volume formula to solve for height

Divide both sides by B.

h=V/B

The volume formula to solve for height ish=V/B.

Page 193 Problem 24 Answer

Given YPEWSE specified the volume of the box must be 450 in 3  and the area of the base must be 75 in 2.

We have to use your formula to determine the height of the new boxes.

Substitute the value in formula.

The volume formula to solve for height is h=V/B

Substitute V=450 in 3 and B=75 in 2

h=450/75

h=6

Hence, the height of the new boxes is 6 in.

The height of the new boxes is 6 in.

Page 193 Problem 25 Answer

Given the volume of an ice cream cone is the measure of how much ice cream a cone can hold.

An ice cream cone company wants to make an ice cream cone with a larger radius that still holds the same amount of ice cream.

We have to write an equation to calculate the volume of a cone.

We know the ice cream has a cone shape.

So the formula of the cone is V=1/3πr2h

where r is the radius and h is the height.

An equation to calculate the volume of a cone is V=1/3πr2h.

Carnegie Learning Algebra I Student Text Volume 1 3rd Edition Chapter 3 Exercise 3.3 Linear Functions Page 193 Problem 26 Answer

Given the equation V=1/3πr2h.we have to convert the equation to solve for the radius.

Solve the equation V=1/3πr2h for r.

Given V=1/3πr2h

We have to convert the volume formula to solve for radius.

multiply both sides by 3

3V=πr2/h

Divide both sides by πh

3V/πh=r2

Take square on both sides

r=√3V/πh

The equation to solve for the radius is r=√3V/πh.

Page 194 Problem 27 Answer

Given future value is the value of a sum of money at a specific date due to interest.

The formula A=P(1+rt) is used to determine future value.

The variable A is the future value, P is the principal, r is the interest rate, and t is the time.

A bank wants to know the interest rate of a customer’s account who earned a certain amount of future value.

We have to convert the equation to solve for rate.solve literal Equations for r

Given A=P(1+rt)

We have to convert the equation to solve for rate.

distribution P

A=P+Prt subtracting P on both sides

A−P=Prt

Divide both sides by Pt.

r=A−P/Pt

The equation to solve for rate is r=A−P/Pt.

Chapter 3 Exercise 3.3 Carnegie Learning Guide

Carnegie Learning Algebra I Student Text Volume 1 3rd Edition Chapter 3 Exercise 3.3 Linear Functions Page 194 Problem 28 Answer

Given Jillian deposited $5000 in an account 10 years ago after her college graduation.

The money she deposited now has a value of $15,000 We have to determine the interest rate of Jillian’s account.

Substitute the value in the formula.

The equation to solve for rate is r=A−P/Pt.

Substitute P=5000, t=10 and A=15000

r=15000−5000/5000(10)

=10000/50000

=0.2

=20%.

The interest rate of Jillian’s account. Is 20%.

Carnegie Learning Algebra I Student Text Volume 1 3rd Edition Chapter 3 Exercise 3.2 Linear Functions

Carnegie Learning Algebra I Student Text Volume 1 3rd Edition Chapter 3 Linear Functions

Page 174 Problem 1 Answer

Given Marshall High School, Athletic Association sells tickets for the weekly football games.

Students pay $5 and adults pay $10 for a ticket.

we have to find how much money would the athletic association collect if 100 students and 50 adults buy tickets to the game.

Find individual prices of student’s and adult’s pay for tickets and sum them.

Given students pay $5 and adults pay $10 for a ticket.

The money collected by 100 students As

=100×5=$500

The money collected by 50 adult Aa

=10×50=$500

The total amount of money= money collected by students+ The money collected by adult

=500+500

=$1000

Hence, Marshall High School, Athletic Association collected $1000.

Marshall High School, Athletic Association collected $1000 by selling tickets.

Carnegie Learning Algebra I Student Text Volume 1 3rd Edition Chapter 3 Exercise 3.2 Linear Functions

Page 174 Problem 2 Answer

Given Marshall High School, Athletic Association sells tickets for the weekly football games.

Students pay $5 and adults pay $10 for a ticket.

we have to find how much money would the athletic association collect if 125 students and 75 adults buy tickets to the game.

Find individual prices of student’s and adult’s pay for tickets and sum them.

Given students pay $5 and adults pay $10 for a ticket.

The money collected by 125 students As

=125×5=625

The money collected by 75 adult Aa

=75×10=750

The total amount of money= money collected by students+ The money collected by adult

=625+750

=$1375

Hence, Marshall High School, Athletic Association collected $1375.

Marshall High School, Athletic Association collected $1375 by selling tickets.

Carnegie Learning Algebra I Chapter 3 Exercise 3.2 Solutions

Carnegie Learning Algebra I Student Text Volume 1 3rd Edition Chapter 3 Exercise 3.2 Linear Functions Page 174 Problem 3 Answer

Given Marshall High School, Athletic Association sells tickets for the weekly football games.

Students pay $5 and adults pay $10 for a ticket.

we have to find how much money would the athletic association collect if 97 students and 116 adults buy tickets to the game.

Find individual amount of student’s and adult’s pay for tickets and sum them.

Given students pay $5 and adults pay $10 for a ticket.

The money collected by 97 students As

=97×5 =475

The money collected by 116 adult Aa

=116×10=$1160

The total amount of money= money collected by students+ The money collected by an adult

=475+1160

=$1645

Hence, Marshall High School, Athletic Association collected$1645.

Marshall High School, Athletic Association collected $1645 by selling tickets.

Page 174 Problem 4 Answer

Given Marshall High School, Athletic Association sells tickets for the weekly football games.

Students pay $5 and adults pay $10 for a ticket.

Here we have to explain how you can determine the total amount of money collected if you know the number of student tickets sold and the number of adult tickets sold.

To determine the total amount of money collected First find individual prices of student’s and adult’s pay for tickets

For example, let the ticket price is y and we sell x ticket then, the total money we get is xy.

The total amount of money collected is sum of amount of student’s and adult’s pay for tickets

We can determine the total amount of money collected find individual prices of student’s and adult’s pay for tickets and sum of amount of student’s and adult’s pay for tickets.

Linear Functions Chapter 3 Exercise 3.2 Answers

Carnegie Learning Algebra I Student Text Volume 1 3rd Edition Chapter 3 Exercise 3.2 Linear Functions Page 174 Problem 5 Answer

Given Marshall High School, Athletic Association sells tickets for the weekly football games. Students pay $5 and adults pay $10 for a ticket

Here we have to explain how your expression represents this problem situation.

The  expression previews question is5s+10a

here 5 represent the cost of a student Ticket and s represent number of student ticket sold, 10 represents the cost of a adult Ticket, and a represent number of student tickets sold, So5s+10a

represent total amount collected.

Here 5s represent the amount collected from student tickets and 10a represent the amount collected from adult tickets.

Page 176 Problem 6 Answer

Here we have to tell if we know the number of student tickets sold, can we determine the total amount of money collected.

No, we can’t determine the total amount of money collected because the total amount is a dependent function we also have to know the number of adult tickets sold to determine the total amount of money collected

No, we can’t determine the total amount of money collected because the total amount is a dependent function we also have to know the number of adult tickets sold.

Page 176 Problem 7 Answer

Here we have to tell if you know the total amount of money collected, can you determine the number of student and adult tickets sold.

No, we can’t determine the number of student and adult tickets sold.

Because the number of student or adult tickets is a dependent function we also have to know at least the number of student or adult tickets.

No, we can’t determine the number of student and adult tickets sold because the number of student or adult tickets is a dependent function we also have to know at least the number of student or adult tickets.

Page 176 Problem 8 Answer

Given the football team is playing in an out-of-town tournament.

The athletic association needs to raise $ 3000 to send the team to this tournament.

The money raised from selling tickets to a special event home game will be used toward the tournament cost.

We have to use your equation to complete the given table.Use equation 5s+10a=3000.

The first segment has a statement of s so its amount name is Number of Student Tickets and its units are tickets.

The subsequent segment has the articulation a so its amount name is Number of Adult Tickets and its units are tickets. Since every understudy ticket is $5, the articulation 5s in the third section has an amount name of Money Collected From Student Tickets and has units of dollars.

Carnegie Learning Algebra I, Student Text, Volume 1, 3rd Edition, Chapter 3 Linear Functions 8 1

Since every grown-up ticket has an expense of $10, the articulation10a in the fourth section has an amount name of Money Collected From Adult Tickets and units of dollars.

The articulation 5s+10a in the fifth section then, at that point, has an amount name of Total Amount Collected and has units of dollars.

Since the situation is 5s+10a=3000, the aggregate sum gathered is consistently $3000 so the four cells in the lower part of the fifth section are then each of the 3000:

Now fill the value of value of money Collected From adult Tickets and student Tickets by multiplying 5 by number of Student tickets  and 10 by number of adult tickets

Carnegie Learning Algebra I, Student Text, Volume 1, 3rd Edition, Chapter 3 Linear Functions 8 2

Fill in the sums for the cash gathered from understudy tickets by deducting the cash gathered from grown-up tickets from 3000. Fill in the sums for the cash gathered from grown-up tickets by deducting the cash gathered from understudies tickets from 3000

Now fill the remaining column by using equation

Carnegie Learning Algebra I, Student Text, Volume 1, 3rd Edition, Chapter 3 Linear Functions 8

The table is

Carnegie Learning Algebra I, Student Text, Volume 1, 3rd Edition, Chapter 3 Linear Functions 8 3

Page 177 Problem 9 Answer

Given  Carla and Robena sell game tickets. They have already sold 95 student tickets.

Carla says that they need to sell 252 adult tickets to reach the goal of $ 3000.

Robena says that they need to sell 253 adult tickets to reach the goal.

Here we have to tell who is correct and explain our reasoningPut the values of adult tickets in the problem function.

We know the function of this problem is 3000=5s+10a

We already sold 95 student tickets then 3000=5×95+10a

3000=475+10a

2525=10a

a=252.5

Means Robena is right they need to sell 253 adult tickets to reach the goal because we didn’t sufficient amount of money by sell 252 adult tickets.

Robena is right they need to sell 253 adult tickets to reach the goal because we didn’t sufficient amount of money by sell 252 adult tickets.

Carnegie Learning Algebra I Linear Functions Exercise 3.2 Solutions

Carnegie Learning Algebra I Student Text Volume 1 3rd Edition Chapter 3 Exercise 3.2 Linear Functions Page 178 Problem 10 Answer

Given the x-axis represent the number of student tickets sold.

Let the y -axis represent the number of adult tickets sold.

Determine the x-intercept and the y-intercept for the transformed equation here we have to explain what each intercept means in terms of the problem situation and what do we notice.

Find the points where the function graph meets the x and y-axis.

Leta=y ands=x then, y=−1/2x+300

For x-intercept At x-axisx=0 then graph intercept x-axis at point(600,0)

For y-intercept At y-axisy=0 then graph intercept y-axis at point(0,300)

Hence, equation intercept x-axis at (600,0) and y-axis at(0,300).

And the graph is

Carnegie Learning Algebra I, Student Text, Volume 1, 3rd Edition, Chapter 3 Linear Functions10

The transformed equation  intercept x-axis at (300,0) and y-axis at(0,600) and the graph is

Carnegie Learning Algebra I, Student Text, Volume 1, 3rd Edition, Chapter 3 Linear Functions 10 1

Page 179 Problem 11 Answer

Given the equationa=−1/2s+300

We have to use the x-intercept and y-intercept to graph the equation.

Plot the points of x-intercept and y-intercept now draw a straight continuous line that crossing through intercept points.

From the previews part the transformed equation intercept x-axis at(600,0) and y-axis at(0,300).

now plot the points and draw a straight continuous line that crossing through these points.

Carnegie Learning Algebra I, Student Text, Volume 1, 3rd Edition, Chapter 3 Linear Functions 11

Graph of  the equation by using x-intercept and y-intercept is

Carnegie Learning Algebra I, Student Text, Volume 1, 3rd Edition, Chapter 3 Linear Functions 11 1

Page 179 Problem 12 Answer

Given the equationa=−1/2s+300

We have to find the athletic association sold 400 student tickets.

Determine how many adult tickets they must sell to reach the $3000 goal.

Substitute the value of student tickets in the equation

The athletic association sold 400 student tickets thena=−1/2s+300

substitutes=400

a=−1/2×400+300

=−200+300

=100

Hence, the athletic association sells 100 adult tickets to reach the $3000 goal.

The athletic association sells 100 adult tickets to reach the $3000 goal.

Carnegie Learning Algebra I Student Text Volume 1 3rd Edition Chapter 3 Exercise 3.2 Linear Functions Page 179 Problem 13 Answer

Given the equation a=−1/2s+300

We have to explanation if the athletic association sold 400 student tickets and 200 adult tickets then an you use the graph to determine how much money is collected.

No. The graph just gives the various mixes of grown-up and understudy tickets offered to gather an aggregate sum of $3000.

The diagram goes through the point (400,100) not (400,200) so it can’t be utilized to discover the measure of cash gathered.

No, can’t use the graph to determine much money is collected.

Page 180 Problem 14 Answer

Given let’s consider reaching the $ 3000 goal for ticket sales by analyzing the number of adult tickets sold.

If the association knows that 150 adult tickets have been sold, how many student tickets would they need to sell to reach their goal.

We have to find transform the equation 5 s+10 a=3000 to solve for the number of student tickets.

Do Adding, Substracting, multiplication, and division to transform the equation

Given equation is 5s+10a=3000

We have to find transform this equation to solve for the number of student tickets.

Add−10a on both sides   5s=3000−10a

Divide 5 by both sides   s=600−2a

Hence, the transform the equation to solve for the number of student tickets iss=600−2a.

The transform the equation to solve for the number of student tickets iss=600−2a.

Page 180 Problem 15 Answer

Given let’s consider reaching the $ 3000 goal for ticket sales by analyzing the number of adult tickets sold.

If the association knows that 150 adult tickets have been sold, how many student tickets would they need to sell to reach their goal.

We have to find how many student tickets must the athletic association sell on homecoming weekend to reach their goal of $3000.

Use the transform the equation to solve for the number of student tickets.

The transform equation to solve for the number of student tickets iss=600−2a.

Association knows that 150 adult tickets have been sold substitute a=150

s=600−2×150

s=600−300

s=300

Hence, the athletic association sells 300 student tickets to reach the $3000 goal.

The athletic association sells 300 student tickets to reach the $3000 goal.

Page 180 Problem 16 Answer

Given let’s consider reaching the $ 3000 goal for ticket sales by analyzing the number of adult tickets sold. If the association knows that 150 adult tickets have been sold, how many student tickets would they need to sell to reach their goal.

We have to determine the x-intercept and the y-intercept of the graph described by this equation.

Explain what the intercepts mean in terms of the problem situation.

Find the points where the function graph meets the x and y-axis.

The transform equation to solve for the number of student tickets iss=600−2a

Leta=x and s=y then y=600−2x

At x-axisy=0 then graph intercept x-axix at point(300,0)

For y-intercept  At y-axisx=0 then graph intercept y-axis at point(0,600)

An intercept of any function is a point where the graph of the function crosses, or intercepts, the x-axis or y-axis

The transformed equation  intercept x-axis at (300,0) and y-axis at(0,600) and an intercept of any function is a point where the graph of the function crosses, or intercepts, the x-axis or y-axis.

Exercise 3.2 Linear Functions Explained

Carnegie Learning Algebra I Student Text Volume 1 3rd Edition Chapter 3 Exercise 3.2 Linear Functions Page 181 Problem 17 Answer

Given the equations=600−2a

we have to identify the slope of the graph. Interpret its meaning in terms of the problem situation use the formula of the slope of the graph

From the previews part, we know that the graph crossing through(300,0)

and(0,600) points. then the slope of the graph ism=600−0/0−300

=−600/300

=−2

Hence, the slope of graph is−2.

The slope of the graph is−2.

Page 181 Problem 18 Answer

Given the equation which represents the tickets problem for the athletic association.

a=−1/2s+300

We have to compare the x-intercepts and the y-intercepts of the two graphs we just created and what do we notice

The x – and y-capture for the first graph was (600,0), and (0,300) and addressed selling 600 student tickets and 0 grown-up passes to come to the $3000 objective and selling 0 student tickets and 300 grown-up passes to come to the$3000 objective.

The x-and y-blocks for the subsequent graph were (300,0) and (0,600) and addressed selling 300 grown-up tickets and 0 student passes to come to the$3000 objective and selling 0 grown-up tickets and 600 student passes to come to the the$3000 objective.

The intercept are then exchanged in the two graphs and have similar portrayals with regard to the issue.

By comparing the x-intercepts and the y-intercepts of the two graphs we notice that the intercept are then exchanged in the two graphs and have the same representations in the context of the problem.

Page 181 Problem 19 Answer

Given students that want to attend the special event game must purchase their tickets at school prior to the game.

So far, 189 students bought tickets for the game.

The athletic association wants to know how many adult tickets they must sell in order to reach their goal of $3000.

However, they want a method to make forecasting how many adult tickets they must sell more efficient.

Another way to determine the number of adult tickets that must be sold to reach a goal of $3000 is to transform the equation to isolate a first.

a=−1/2s+300

Now, substitute the information you know into the transformed equation.

We have to answer is there a way to determine the total amount of money collected from either graph and explain why or why not.

Yes. Both graphs represented the different combinations of adult and student tickets sold to collect a total of $3000.

If you didn’t know the amount collected that they represented, you could still find it by using one of the intercepts.

If we used the y-intercept(300,0) for the second graph, you would know the total amount collected is 10(300)=$3000 since the x-coordinate represents the number of adult tickets sold and each student ticket was sold for $10.

Yes. Both graphs represented the different combinations of adult and student tickets sold to collect a total of$3000.

Carnegie Learning Algebra I Student Text Volume 1 3rd Edition Chapter 3 Exercise 3.2 Linear Functions Page 181 Problem 20 Answer

Given 5s+10a=3000

we have to identify the units of measure for 5 of the given equation.Simplify the term 5s to identify the units of measure of 5.

We know this equation represents the athletic association needs to raise $ 3000 and students pay $5 and adults to pay $10 for a ticket.

So 5s total amount by selling student ticket and we knows is the count of student ticket.

Let unit of measurement of 5 is x.

then, x×student ticket=dollars

x=dollars student ticket

Hence, here 5 represents the cost of the student ticket in the given equation.

Here 5 represents the cost of the student ticket

Page 181 Problem 21 Answer

Given 5s+10a=3000

we have to identify the units of measure for s of the given equation.

Here s represents the number of the student ticket sold in the given equation.

Here s represents the number of the student ticket sold.

Page 181 Problem 22 Answer

Given 5s+10a=3000

we have to identify the units of measure for 10 of the given equation.

Simplify the term10a to identify the units of measure of 10.

We know this equation represents the athletic association needs to raise $ 3000 and students pay $5 and adults to pay $10 for a ticket.

So 10a total amount by selling adult tickets.

Let unit of measurement of 10 is x. then,  x×adult ticket=dollars

x=dollars adult ticket

Hence, here 10 represents the cost of the adult ticket in the given equation.

Here 10 represents the cost of the adult ticket.

Page 174 Problem 23 Answer

Given 5s+10a=3000

we have to identify the units of measure for an of the given equation.

Simplify the term10a to identify the units of measure of a.

We know this equation represents the athletic association needs to raise $ 3000 and students pay $5 and adults to pay $10 for a ticket.

So 10a total amount by selling adult ticket and we know 10 is the rate of per adult ticket.

Let unit of measurement of a is x. then,   dollars adult ticket.x=dollars

x=dollars.adult ticket/dollars

x=adult ticket

Hence, here a represents the number of adult tickets sold in the given equation.

Here a represents the number of adult tickets sold.

Carnegie Learning Algebra I Student Text Volume 1 3rd Edition Chapter 3 Exercise 3.2 Linear Functions Page 181 Problem 24 Answer

Given 5s+10a=3000

we have to identify the units of measure for 3000 of the given equation.

Simplify the term 5s+10a to identify the units of measure of 3000.

We know this equation represents the athletic association needs to raise $ 3000 and students pay $5 and adults to pay $10 for a ticket.

So, 3000 total amount by selling both tickets and we know 5 is the rate of per student ticket,s is the count of student ticket,10 is the rate of per adult ticket and a is the count of adult ticket.

Let unit of measurement of 3000 is x.

then, x=dollars/ student ticket.student ticket+dollars/adult ticket.adult ticket

x=dollars+dollars

x=dollars

Hence, here3000 represents the total amount collected in the given equation.

Here3000 represents the total amount collected

Page 182 Problem 25 Answer

Given analyzed the units of each part of the equation5s+10a=3000

we have to write the next sentence in the worked example after dividing out the two different units of measure and what does this tell you about the original equation So in the first product student tickets were canceled and in the second product, adult tickets were canceled.

dollars+dollars=dollars

This tells me the original in terms of dollars.

The next sentence in the worked example after dividing out the two different units of measure

dollars+dollars=dollars

This tells me the original in terms of dollars.

Page 184 Problem 26 Answer

Given the equation5s+10a=3000

we have to explain what happened to the units of students and dollars when converting from standard form to slope-intercept form in the worked example.

If we convert this equation in standard form to slope-intercept the units of students and dollars were canceled.

And the equation in terms of an adult tickets.

In standard form to slope-intercept, the units of students and dollars were canceled and the equation in terms of adult tickets.

Chapter 3 Exercise 3.2 Carnegie Learning Guide

Page 184 Problem 27 Answer

Given the equation5s+10a=3000

we have to convert the standard form of the original given equation to slope intercept form to represent the number of student tickets.

Show and explain the final units for the equation.

Analyze the units of each part of the equation.

From question 7, slope intercept form of 5s+10a=3000 is s=−2a+600

From question 9, the unit of slop -2 is student tickets

adult tickets then the units for the equation

s = −2 a + 600

student tickets=student tickets/adult tickets

adult tickets+student tickets

student tickets= student tickets=+student tickets

The final unit for the equation is student tickets.

The final unit for the equations=−2a+600 is student tickets.

Carnegie Learning Algebra I Student Text Volume 1 3rd Edition Chapter 3 Exercise 3.2 Linear Functions Page 185 Problem 28 Answer

Given Katie received a $ 75 gift card for her birthday. She decides to buy new music and movies for her electronic notebook with a gift card.

Songs cost $1.29 each and movies cost $14.99 each.

we have to write an equation to represent this problem situation.

Use s to represent the number of songs and m to represent the number of movies.

The cost of each song is $1.29 and if she buyss songs then she spends1.29s dollars and the cost of each movie is $14.99 and if she buy sm movie then she spends14.99m

Dollars She has $75 gift card for her birthday and she will spend 1.29s+14.99m

An equation to represent this problem situation is1.29s+14.99m=75

An equation to represent this problem situation is 1.29s+14.99m=75.

Page 185 Problem 29 Answer

Given Katie received a $ 75 gift card for her birthday.

She decides to buy new music and movies for her electronic notebook with the gift card.

Songs cost $1.29 each and movies cost $14.99 each and

Carnegie Learning Algebra I, Student Text, Volume 1, 3rd Edition, Chapter 3 Linear Functions 29

We have to complete the table to show what each expression represents in this problem situation.Heres represents number of songs she purchased so 1.29 represents cost of each song then1.29s represents total amount she spends on songs.

And m represents number of movies she purchased so 14.99 represents cost of each movie then 14.99m represents total amount she spends on movies.

The expression 1.29s+14.99m represents the total amount she spends and 75 represents the amound she can spends.The table to show what eachexpression represents in this problem situation is

Carnegie Learning Algebra I, Student Text, Volume 1, 3rd Edition, Chapter 3 Linear Functions 29 1

The table to show what each expression represents in this problem situation is

Carnegie Learning Algebra I, Student Text, Volume 1, 3rd Edition, Chapter 3 Linear Functions 29 2

Page 185 Problem 30 Answer

Given Katie received a $ 75 gift card for her birthday. She decides to buy new music and movies for her electronic notebook with the gift card. Songs cost $1.29 each and movies cost $14.99 each.

we have to find if Katie buys 20 songs, what is the greatest number of movies she can buy

Find the remaining amount she has after buying 20 songs then how many movies she buy in remaining amount.

Each song cost is $1.29 the 20 song cont is 1.29×20=25.8

Now remaining amount she has $75−$25.8=$49.2

If each movie cost is $14.99 then she buy 49.2/14.99≈3.27

So she can buy maximum 3 movies

If Katie buys 20 songs then now she can buy maximum 3 movies.

Page 186 Problem 31 Answer

Given Katie received a $ 75 gift card for her birthday. She decides to buy new music and movies for her electronic notebook with a gift card.

Songs cost $1.29 each and movies cost $14.99 each.

We have to find if Katie buys no movies, what is the greatest number of songs she can buy?

What does this number represent Find the remaining amount she has after buying no movies then how many songs she buy in remaining amount.

She buys no movies then she can spend all of the $75 on songs

If each song cost is $1.29  then she buys75/1.29≈58.1

So she can buy maximum 58 songs.

If Katie buys no movies then  she can buy maximum 58 songs

How To Solve Linear Functions Exercise 3.2

Carnegie Learning Algebra I Student Text Volume 1 3rd Edition Chapter 3 Exercise 3.2 Linear Functions Page 186 Problem 32 Answer

Given Katie received a $ 75 gift card for her birthday. She decides to buy new music and movies for her electronic notebook with the gift card.

Songs cost $1.29 each and movies cost $14.99 each.

we have to find if Katie buys no songs, what is the greatest number of movies she can buy and what does this number represent

Find the remaining amount she has after buying no songs then how many movies she buy in remaining amount.

She buys no songs then she can spend all of the $75 on movies

If each movie cost is $14.99 then she buys 75/14.99≈5

So she can buy maximum 5 movies.

If Katie buys no songs then she can buy maximum 5 movies.

Carnegie Learning Algebra I Student Text Volume 1 3rd Edition Chapter 3 Exercise 3.1 Linear Functions

Carnegie Learning Algebra I Student Text Volume 1 3rd Edition Chapter 3 Linear Functions

Page 165 Problem 1 Answer

Given the table shown lists the average global temperature for each decade from 1880 to 2009.

We have to tell the data represent a function if yes then describe the function and if not then why not.

The temperature decreased from decade 0 to decade 1 and again from decade 6 to decade 8 so it cannot function.

Because the function is linear and exponential and they are increasing and decreasing by a rule.

Carnegie Learning Algebra I, Student Text, Volume 1, 3rd Edition, Chapter 3 Linear Functions 1

The function is increasing and decreasing for one portion with constant rates.

The best explanation for this data is decade 0 to 1, increases from decade 1 to decade 6, decreases from decade 6 to decade 8, and then increases from decade 8 to decade 12.

The data does not represent a function because the temperature decreased from decade 0 to decade 1 and again from decade 6 to decade 8 so it cannot be a function.

Page 165 Problem 2 Answer

Given the table shown lists the average global temperature for each decade from 1880 to 2009.

We have to represent the data using a graphing calculator.

In order to enter the data in our calculator, we must represent each decade as a single value.

Follow the steps provided to graph the relationship between time and temperature on a graphing calculator

Plot the point of the given data.

Carnegie Learning Algebra I Student Text Volume 1 3rd Edition Chapter 3 Exercise 3.1 Linear Functions

The lowest temperature is around 56 and the decade is 0 and the highest temperature is around 59 and the decade is 12.

then the graph represents the data is

Carnegie Learning Algebra I, Student Text, Volume 1, 3rd Edition, Chapter 3 Linear Functions 2

The graph represents the data is

Carnegie Learning Algebra I, Student Text, Volume 1, 3rd Edition, Chapter 3 Linear Functions 2 1

Carnegie Learning Algebra I Chapter 3 Exercise 3.1 Solutions

Carnegie Learning Algebra I Student Text Volume 1 3rd Edition Chapter 3 Exercise 3.1 Linear Functions Page 165 Problem 3 Answer

Given the table shown lists the average global temperature for each decade from 1880 to 2009.

We have to tell why do you think the first decade is numbered 0  Numbered 0 is the first decade makes it y-coordinateSince when the graph on the y-axis.

The numbered 0 is the point when graph intercepts the y-axis.

Page 166 Problem 4 Answer

Given the table shown lists the average global temperature for each decade from 1880 to 2009 .

We have to tell between which consecutive decades was there a decrease in average global temperature

The average global temperature decrease between the consecutive decades of decade 0 and decade 1,  decade 6 and decade 7, and decade 8 and decade 9

The consecutive decades of decade 0 and decade 1,  decade 6 and decade 7, and decade 8 and decade 9.

Page 166 Problem 5 Answer

Given the table shown lists the average global temperature for each decade from 1880 to 2009.

We have to write the range of the data set for a given table.The range is the difference between the biggest data value and the smallest data value.

From given table the biggest data value is 58.316 and the smallest data value is 56.642.

Then the range of the data set is 58.632−56.642=1.674.

The range of the data set is 1.674.

Carnegie Learning Algebra I Student Text Volume 1 3rd Edition Chapter 3 Exercise 3.1 Linear Functions Page 166 Problem 6 Answer

Given the table shown lists the average global temperature for each decade from 1880 to 2009.

Decade Number We have to answer it is possible to predict the approximate average global temperature for 2070-2079 using the graph and explain our reasoning.

Carnegie Learning Algebra I, Student Text, Volume 1, 3rd Edition, Chapter 3 Linear Functions 6

No, it is not possible to predict the approximate average global temperature for 2070-2079.

Because the graph is both increasing and decreasing, we cannot use it to predict the approximate average global temperature.

No, it is not possible because the graph is both increasing and decreasing, we cannot use it to predict the approximate average global temperature.

Carnegie Learning Algebra I, Student Text, Volume 1, 3rd Edition, Chapter 3 Linear Functions6

Page 166 Problem 7 Answer

Given decade table about from average global temperature 1880 to 2009 .

We have to tell would it make sense to draw a smooth curve connecting the points in the plot if yes then why or not then why not.

No, it would not make sense to draw a smooth curve connecting the points in the plot.

Carnegie Learning Algebra I, Student Text, Volume 1, 3rd Edition, Chapter 3 Linear Functions 7

Because the data does not represent one function.

No, it would not make sense to draw a smooth curve connecting the points because the data does not represent one function.

Page 167 Problem 8 Answer

Given the table shown lists the average global temperature for each decade from 1880 to 2009.

We have to determine the linear regression equation for the average global temperature data.

As per the given values in the question,

we get a=0.1101758242 and b=56.57217582 then linear regression equation isy=0.1101758242x+56.57217582.

The linear regression equation isy=0.1101758242x+56.57217582.

Linear Functions Chapter 3 Exercise 3.1 Answers

Carnegie Learning Algebra I Student Text Volume 1 3rd Edition Chapter 3 Exercise 3.1 Linear Functions Page 168 Problem 9 Answer

Given the table shown lists the average global temperature for each decade from 1880 to 2009.

We have to rewrite the linear regression equation as a function.

This time, round the slope and y-intercept to the appropriate place and explain our reasoning.

Values rounded to 3 decimal place.

The temperature in a given table is rounded to 3 decimal places.

So the slope and y-intercept are also rounded to 3 decimal places.

The linear regression equation is y=0.110758242x+56.57217582 then the function is f(x)=0.110x+56.572.

The rounded linear regression equation isf(x)=0.110x+56.572.

Page 168 Problem 10 Answer

Given sketch the data points and the line of the best fit we see on the calculator.

We have to answer the data show a positive correlation or a negative correlation and how can we tell.

The slope of the graph of linear regression is positiveSo the data show a positive correlation.

Carnegie Learning Algebra I, Student Text, Volume 1, 3rd Edition, Chapter 3 Linear Functions 10

The data show a positive correlation because the slope of the graph of linear regression is positive.

Page 168 Problem 11 Answer

Given sketch the data points and the line of the best fit we see on the calculator.

Use a graphing calculator to plot the data point and line of best fit by following the given steps in book.

Yes, this line fits the data well.

Carnegie Learning Algebra I, Student Text, Volume 1, 3rd Edition, Chapter 3 Linear Functions 11

Because most of the points are closer to the line.

Yes, most of the points are closer to the line so this line fits the data well.

Carnegie Learning Algebra I Student Text Volume 1 3rd Edition Chapter 3 Exercise 3.1 Linear Functions Page 169 Problem 12 Answer

Here we have to find what is the correlation coefficient, or r-value, for your line of best fit and Interpret the meaning of the r-value.

Follow the given steps in the textbook to find the linear regression equations and also findr≈0.889.

r is positive then the data has a positive correlation coefficient.It is close to 1 then the line of best fit the data.

The value of r is ≈0.889 therefore the data has a positive correlation coefficient and the line of best fit the data.

Page 169 Problem 13 Answer

Given from previews question your graph showing the average global temperature from 1880 to 2009.

We have to Xmin and Xmax, and Ymin and Ymax for this graph and tell how he look like.

Carnegie Learning Algebra I, Student Text, Volume 1, 3rd Edition, Chapter 3 Linear Functions 13

To change Xmin and Xmax add more data than 0 through 12 such as 0 through 18, and Ymin and Ymax add more data than 56 through 59 such as 0 through 60.

Use the steps given in your textbook to graph the data.

Carnegie Learning Algebra I, Student Text, Volume 1, 3rd Edition, Chapter 3 Linear Functions 13 2

To changing the Xmin and Xmax  add more data than 0 through 12 such as 0 through 18, it makes the graph steeper

To changing the the Ymin and Ymax  add more data than 56 through 59 such as 0 through 60, it makes the graph like a horizontal line

Changing the Xmin and Xmax  add more data than 0 through 12 such as 0 through 18, it makes the graph steeper and changing the  Y min and Ymax  add more data than 56 through 59 such as 0 through 60, it makes the graph like a horizontal line

Carnegie Learning Algebra I, Student Text, Volume 1, 3rd Edition, Chapter 3 Linear Functions 13 1

Page 170 Problem 14 Answer

Given linear regression equationf(x)=0.110x+56.572

where x represent the decade number and f(x) represent the average temperature.

We have to write an appropriate unit of measure and describe the contextual meaning.

Then, choose a term from the word box to describe the mathematical meaning of each part.

Here f(x) represented the average temperature.

Therefore, the units for f(x) are ∘F, the contextual meaning is the average temperature in ∘F, and the mathematical meaning is the output value x represent the decade number x is the independent variable so it is the input value.

Its contextual meaning was the time in decades so its units are decades.

The value of 0.11 is the slope of the linear function so its mathematical meaning is the rate of change.

Since 0.11 has units of ∘F per decade and its contextual meaning is the temperature increases 0.11∘F per decade And 56.572 is the y-intercept of the linear function.

Since it has units of ∘F.

Its contextual meaning is the initial temperature was 56.572∘F in decade 0.

Now we can fill table as

Carnegie Learning Algebra I, Student Text, Volume 1, 3rd Edition, Chapter 3 Linear Functions 14

The table after filling is:

Carnegie Learning Algebra I, Student Text, Volume 1, 3rd Edition, Chapter 3 Linear Functions 14 1

Page 170 Problem 15 Answer

Given linear regression equation f(x)=0.110x+56.572 where x represent the decade number and represent the average temperature.

We have to find how much was the average global temperature changing each decade from 1880 to 2009 according to the data and explain how we know.

The slope of the equation represents the rate of change.

Then the slope of the linear regression equation is0.11 represents the temperature is increasing by about 0.11oF per decade from 1880 to 2009.

The temperature is increasing by about0.11oF per decade from 1880 to 2009 because it is the slope of the linear regression equation.

Carnegie Learning Algebra I Linear Functions Exercise 3.1 Solutions

Carnegie Learning Algebra I Student Text Volume 1 3rd Edition Chapter 3 Exercise 3.1 Linear FunctionsPage 171 Problem 16 Answer

Here we have to compare the y-intercept from the table with the y-intercept from the linear regression equation and tell what do we notice.

Does this make sense in terms of the problem situation if yes then why and if no then why not.

The y-intercept from the table is 56.876 and the y-intercept from the linear regression equation is 56.572 we notice the linear regression equation is smaller than the y-intercept from the table.

Because the temperature decreased from 0 to 1 and then increasing so this make sense of the problem situation Since the linear regression equation is molding the general trend of the data values increasing not given the exact values.

The linear regression equation is smaller than the y-intercept from the table.

It does this make sense in terms of the problem situation Since the linear regression equation is molding the general trend of the data values increasing not given the exact values.

Page 171 Problem 17 Answer

Given linear regression equation f(x)=0.112x+56.572

Here we have to use your equation to predict the average global temperature for the years 2070-2079 and show your work and explain your reasoning.

Find the difference between  1880 and 2070 years.

The difference between  1880 and 2070 years is 2070−1880=190

So the 19 decades after 1880-1890.

Substitute x=19 in the linear regression equation to predict the average global temperature for the years 2070-2079

f(x)=0.112x+56.572

f(x)=0.112(19)+56.572

=2.09+56.572

=58.662

Hence,  the average global temperature for the years 2070-2079 is 58.662oF.

The average global temperature for the years 2070-2079 is58.662oF.

Exercise 3.1 Linear Functions Explained

Page 171 Problem 18 Answer

Given linear regression equation f(x)=0.112x+56.572

We have to predict the first decade with an average global temperature of at least60oF.Solve the inequality f(x)≥60 for at least 60oF.

Linear regression equation f(x)=0.11x+56.572

For at least 60oF solve inequalityf(x)≥60

for at least60oF temperature.

0.11x+56.572≥60

0,11x≥3.428

x≥31

31 decade means 310 years Since this  predict the average global temperature for1880+310=2190

Hence, for 2190−2200.

Predict is 2190−2200 an average global temperature of at least 60o F.

Carnegie Learning Algebra I Student Text Volume 1 3rd Edition Chapter 2 Exercise 2.3 Graphs Equations And Inequalities

Carnegie Learning Algebra I Student Text Volume 1 3rd Edition Chapter 2 Graphs Equations And Inequalities

Page 103 Problem 1 Answer

Given: The cost of each popcorn box $3.75

To find alan’s total sales as a function of the number of boxes of popcorn he sells.Using the method of functions.

Given the cost of each popcorn box $3.75

The price of each popcorn box is constant so the function is linear.

The function is  f(b)=m b+c here m is the slope, c is the y−intercept and b is the number of boxes of popcorn sold.

Each box of popcorn is $3.75 the slope is m=3.75

Each student starts with a $25 credit towards sales so the y−intercept is c=25

So, the function is f(b)=3.75b+25

Alan’s total sales as a function of the number of boxes of popcorn he sells are f(b)=3.75b+25​

Carnegie Learning Algebra I Student Text Volume 1 3rd Edition Chapter 2 Exercise 2.3 Graphs Equations And Inequalities Page 103 Problem 2 Answer

Given: The function f(b)=3.75b+25

To find the independent and dependent quantities and their units.Using the method of functions.

Given the function f(b)=3.75b+25 here f(b)=3.75b+25 represent Alan’s total sales as a function of the number of boxes of popcorn he sells.

The independent quantity in this is b/ b is the unit of several boxes of popcorn he sells.

The dependent quantity is f(b)/f(b) is the unit of sales in dollars

The independent quantity is b and its unit is several boxes of popcorn he sells.

The dependent quantity is f(b) and its unit is sales in dollars.

Carnegie Learning Algebra I Student Text Volume 1 3rd Edition Chapter 2 Exercise 2.3 Graphs Equations And Inequalities

Page 103 Problem 3 Answer

Given: The function f(b)=3.75b+25

To find the rate of change.Using the method of functions.

Given the function f(b)=3.75b+25

The rate of change here is the slope.

where slope is m here m=3.75

so, the rate of change is m=3.75

This represents the price of each popcorn box

The rate of change is m=3.75 which represents the slope of the function.

Page 105 Problem 4 Answer

Given: The graph which represents the change in the total sales as a function of boxes sold.

To find: the difference between the open and closed circles on the number lines.

Method used: Inequality theorem

An open circle indictes “less than” or “greater than,” while a closed circle indicates “greater than or equal to” or “less than or equal to”.

This number line includes values that are less than or greater than or equal to.

The number line includes values that are less than or greater than or equal to.

Carnegie Learning Algebra I Chapter 2 Exercise 2.3 Solutions

Carnegie Learning Algebra I Student Text Volume 1 3rd Edition Chapter 2 Exercise 2.3 Graphs Equations And Inequalities Page 105 Problem 5 Answer

Given : The graph for total sales to number of boxes sold is given

To find: How many boxes would Alan have to sell to earn at least $ 925

Method used: Inequality theorem

We have the equation

$925≤3.75b+25 Switch sides

3.75b+25≥925

Multiply both sides by 100

3.75b×100+25×100≥925×100

Refine 375b+2500≥92500

Subtract 2500 from both sides

375b+2500−2500≥92500−2500

Simplify 375b≥90000

Divide both sides by 375/375b

375≥90000/375

Simplify b≥240

The number of boxes would Alan have to sell to earn at least $ 925 is 240

Page 106 Problem 6 Answer

Given: Alan needs to sell at least 287 boxes of popcorn to earn two 55 gift cards.To find why the answer rounded to $287.

Using the method of functional.

To find the why the answer rounded are,

The number of boxes must be a whole number so if b≥286.66…,

Then it must be rounded up to 287 since 287 is the smallest whole number that is greater than or equal to 286.66……

If the inequality had been b≤286.66…,

Then it would have been rounded down to 286 since 286 is the largest whole number that is less than or equal to 286.66…

The number of boxes must be a whole number and 287 is the smallest whole number that is greater than or equal to 286.66…

Carnegie Learning Algebra I Student Text Volume 1 3rd Edition Chapter 2 Exercise 2.3 Graphs Equations And Inequalities Page 106 Problem 7 Answer

Given: Write and solve an inequality for each. Show your work.

To solve the greatest number of boxes Alan could sell and still not have enough to earn the Cyclone Sprayer.

Using the method of inequality.

To find the the greatest number of boxes are,

A Cyclone Sprayer requires $600 n sales so if he doesn’t have enough to earn the Cyclone Sprayer,

Thenf(b)<600.

Substitutef(b)=3.75b+25 into this inequality and then solve for $b

f(b)<600

3.75b+25<600

3.75b<575

3.75b/3.75<575/3.75

b<153.33…

b$ must be less than153.33… you must round down to 153.

Therefore, the greatest number of boxes he can sell and not have enough to earn the Cyclone Sprayer is 153 boxes.

The greatest number of boxes he can sell and not have enough to earn the Cyclone Sprayer is 153 boxes.

Page 106 Problem 8 Answer

Given: Write and solve an inequality for each. Show your work.

To solve how many boxes would Alan have to sell to be able to choose his own prize.

Using the method of inequality.

To find how many boxes,

To choose his own prize, he must earn at least $1500 sof(b)≥1500.

Substitute f(b)=3.75b+25 into this inequality and then solve for $b

f(b)≥1500

3.75b+25≥1500

3.75b≥1475

3.75b/3.75≥1475/3.75

b≥393.33…

b$ must be greater than or equal to 393.33… you must round up to 394.

Therefore, he must sell at least 394 boxes to choose his own prize.

The must sell at least 394 boxes to choose his own prize.

Graphs, Equations, And Inequalities Chapter 2 Exercise 2.3 Answers

Carnegie Learning Algebra I Student Text Volume 1 3rd Edition Chapter 2 Exercise 2.3 Graphs Equations And InequalitiesPage 107 Problem 9 Answer

Given: Alan’s camping troop hikes down from their campsite at an elevation of 4800 feet to the bottom of the mountain.

To find a function, h(m) to show the troop’s elevation as a function of time in minutes.

Using the method of functional.

To find the troop’s elevation as a function of time in minutes,

The rate of change is constant to the function is linear and of the form h(m)= s m+b

Wheres is the slope, m is the number of minutes, and b is the y−intercept.

They are hiking down at a rate of 20 feet per minute so s=−20.

They start at an initial height of 4800 feet so b=4800.

The function is then h(m)=−20m+4800.

A function of time in minutes value are,h(m)=−20m+4800.

Page 107 Problem 10 Answer

Given: Alan’s camping troop hikes down from their campsite at an elevation of 4800 feet to the bottom of the mountain.

To identify the independent and dependent quantities and their units.Using the explanation method.

To find the independent and dependent quantities and their units are,

The two quantities are elevation, in feet, and time, in minutes.

Since the elevation of the troops depends on the time,

Time is the independent quantity and has units of minutes and elevation is the dependent quantity and has units of feet.

The independent quantity is time, in minutes, and the dependent quantity is elevation, in feet.

Page 107 Problem 11 Answer

Given: Alan’s camping troop hikes down from their campsite at an elevation of 4800 feet to the bottom of the mountain.

To identify the rate of change and explain what it means in terms of this problem situation.Using the functional method.

To find what it means in terms of this problem situation are,

The troop is climbing down the mountain at a rate of 20 feet per minute so the slope is −20 and Represents the number of feet the troop climbs down per minute.

−20 and represents the number of feet the troop climbs down each minute.

Carnegie Learning Algebra I Student Text Volume 1 3rd Edition Chapter 2 Exercise 2.3 Graphs Equations And Inequalities Page 107 Problem 12 Answer

Given: Alan’s camping troop hikes down from their campsite at an elevation of 4800 feet to the bottom of the mountain.

To find they−intercept and explain what it means in terms of this problem situation.Using the explanation method.

To find what it means in terms of this problem situation are,

The y−intercept is the troop’s initial elevation so the y−intercept is 4800 since they start at an elevation of 4800 feet.

The 4800 and represents the initial elevation of the troop.

Page 107 Problem 13 Answer

Given: Alan’s camping troop hikes down from their campsite at an elevation of 4800 feet to the bottom of the mountain.

To find thex−intercept and explain what it means in terms of this problem situation.Using the method of functional.

To find the what it means in terms of this problem situation are,

The x−intercept is when the troops have reached the bottom of the mountain.

They must climb down 4800 feet and are climbing down at a rate of 20 feet per minute so it will take them 4800/20

=240 minutes to climb down the mountain.

The x−intercept is then 240.

The240 and represents the number of minutes it takes for the troops to reach the bottom of the mountain.

Page 108 Problem 14 Answer

Given:

Carnegie Learning Algebra I, Student Text, Volume 1, 3rd Edition, Chapter 2 Graphs , Equations, And Inequalities 14

To find the function on the coordinate plane.

Using the method of graphical.

To find the function on the coordinate plane.

From Question l, the function ish(m)=−20m+4800

so write h(m)=−20m+4800 on the graph given in your book.

Carnegie Learning Algebra I, Student Text, Volume 1, 3rd Edition, Chapter 2 Graphs , Equations, And Inequalities 14 2

The function on the coordinate plane are:

Carnegie Learning Algebra I, Student Text, Volume 1, 3rd Edition, Chapter 2 Graphs , Equations, And Inequalities 14 1

Carnegie Learning Algebra I Exercise 2.3 Solutions Guide

Page 108 Problem 15 Answer

Given: Write and solve an inequality to verify the solution set.

To solve an inequality to verify the solution set you interpreted from the graph.Using the method of inequality.

To find the solution set you interpreted from the graph,

Substitute h(m)=−20m+4800 into the inequality h(m)<3200 from Question4.

Then solve for m.

Remember to switch the inequality sign when dividing both sides by−20:

h(m)<3200

−20m+4800<3200

−20m<−1600

−20m

−20>−1600

−20m>80

This matches with the solution of hiking more than 80 minutes to reach an elevation below 3200 feet from Question 4.

The solving h(m)<3200 gives m>80 which matches with the solution of hiking more than 80 minutes to reach an elevation below 3200 feet from Question4.

Carnegie Learning Algebra I Student Text Volume 1 3rd Edition Chapter 2 Exercise 2.3 Graphs Equations And Inequalities Page 108 Problem 16 Answer

Given: Compare and contrast your solution sets using the graph and the function.

To find the what do you notice.Using the method of functional.

To find the both solution sets were m>80.

The solution set of m>80 for the graph was an estimate that happened to be the same as the exact solution found using the function.

Both solution sets were m>80.

The solution set of m>80 for the graph was an estimate that happened to be the same as the exact solution found using the function.

Page 109 Problem 17 Answer

Given:

|h(m)|

|h(m)>3200|

|(m)≥3200|

|h(m)=3200|

|h(m)<3200|

|h(m)≤3200|

|m|​

To find the what do you notice about the inequality signs.Using the method of inequality.

The graph passes through the point(80,3200).

For values of m<80,h(m) is greater than 3200 and form<80,h(m) is less than 3200.

The table is then filled in as follows:

|​h(m)    |m|

|h(m)>3200|m<80|

|h(m)≥3200|m≤80|

|h(m)=3200|m=80|

|h(m)<3200|m>80|

|h(m)≤3200||m≥80|

The inequality sign for m is the reverse of the inequality sign for h(m).

If the inequality for h(m) has an equals then so does the inequality sign form.

The inequality sign form is the reverse of the inequality sign for h(m).

If the inequality for h(m) has an equals then so does the inequality sign form.

|​h(m)    |m|

|h(m)>3200|m<80|

|h(m)≥3200|m≤80|

|h(m)=3200|m=80|

|h(m)<3200|m>80|

|h(m)≤3200||m≥80|

Carnegie Learning Algebra I Student Text Volume 1 3rd Edition Chapter 2 Exercise 2.3 Graphs Equations And Inequalities Page 109 Problem 18 Answer

Given:

|​h(m)       |

|h(m)>3200|

|(m)≥3200  |

|h(m)=3200|

|h(m)<3200|

|h(m)≤3200|

|​m            |​

To find what you know about solving inequalities when you have to multiply or divide by a negative number.Using the method of inequality.

To find the multiply or divide by a negative number are,

Solving an inequality doesn’t remove or add the equal part of the inequality sign so if h(m) has an equals in its inequality sign then m must also have one.

Since h(m)=−20m+4800,  when solving the inequalities, both sides will have to be divided by−20.

Since you are dividing both sides by a negative number,

The inequality sign must be switched which is why h(m) and m have opposite facing inequality signs.

Solving an inequality doesn’t change the equal part of the inequality sign so if h(m) has an equals in its inequality sign then m must also.

When solving the inequalities, both sides will have to be divided by −20 so the inequality sign must be switched which is why h(m) and m have opposite facing inequality signs.

Page 110 Problem 19 Answer

Given: f(b)=3.75b+25 and the function.To solve inequalities involving the function.

Using the method of inequality.

To find the inequalities involving the function are,When solving inequalities involving the function f(b)=3.75b+25, the inequality is solved just like an equation.

When solving inequalities involving the function h(m)=−20m+4800,

The inequality is solved just like an equation, except the inequality sign must be reversed when you divide both sides by −20 to solve form.

Both get solved like equations except when solving an inequality for m that involves h(m)=−20m+4800 you must reverse the inequality sign when you divide both sides by −20.

Exercise 2.3 Graphs, Equations, And Inequalities Explained

Carnegie Learning Algebra I Student Text Volume 1 3rd Edition Chapter 2 Exercise 2.3 Graphs Equations And Inequalities Page 110 Problem 20 Answer

Given: −2/3 x≥7.

To solve each inequality and then graph the solution on the number line.

Using the method of inequality.

To find the  inequality and then graph the solution on the number line are,

Carnegie Learning Algebra I, Student Text, Volume 1, 3rd Edition, Chapter 2 Graphs , Equations, And Inequalities 20

To solve −2/3x≥7, multiply both sides by the reciprocal of −2/3 which is −3/2.

Remember to switch the inequality sign since you are multiplying both sides by a negative number.

Write the answer in decimal form so it is easier to graph:

−2/3x≥7

−3/2⋅−2/3x≤−3

2⋅7 x≤−21/2

x≤−10.5

To graph the inequality, plot a closed circle at−10.5 since the inequality sign has an equals.

Then shade to the left since x must be less than or equal to−10.5:

The inequality and then graph the solution on the number line.

x≤−10.5

Carnegie Learning Algebra I, Student Text, Volume 1, 3rd Edition, Chapter 2 Graphs , Equations, And Inequalities 20 1

Page 110 Problem 21 Answer

Given:32>23−x.To solve each inequality and then graph the solution on the number line.

Using the method of inequality.

To solve 32>23−x,

subtract23 on both sides, multiply both sides by −1, and then reverse the inequality so x is on the left side.

Carnegie Learning Algebra I, Student Text, Volume 1, 3rd Edition, Chapter 2 Graphs , Equations, And Inequalities 21

Remember to switch the inequality sign when multiplying both sides by −1.

32>23−x

32−23>23−x−23

9>−x

−1⋅9<−1⋅−x

−9<x

x>−9

To graph the inequality, plot an open circle at −9 since the inequality sign does not have an equals.

Then shade to the right since x must be greater than−9.

The inequality and then graph the solution on the number line are, x>−9

Carnegie Learning Algebra I, Student Text, Volume 1, 3rd Edition, Chapter 2 Graphs , Equations, And Inequalities 21 1

Page 110 Problem 22 Answer

Given: 2(x+6)<10.

To solve each inequality and then graph the solution on the number line.

Using the method of inequality.

To solve2(x+6)<10,

Divide both sides by 2 and then subtract 6on both sides:

2(x+6)<10

2(x+6)/2<10/2

x+6<5

x+6−6<5−6

x<−1

To graph the inequality, plot an open circle at −1 since the inequality sign does not have an equals.

Then shade to the left since x must be less than−1:

Carnegie Learning Algebra I, Student Text, Volume 1, 3rd Edition, Chapter 2 Graphs , Equations, And Inequalities 22

The inequality and then graph the solution on the number line are,x<−1

Carnegie Learning Algebra I, Student Text, Volume 1, 3rd Edition, Chapter 2 Graphs , Equations, And Inequalities 22 1

Carnegie Learning Algebra I Student Text Volume 1 3rd Edition Chapter 2 Exercise 2.2 Graphs Equations And Inequalities

Carnegie Learning Algebra I Student Text Volume 1 3rd Edition Chapter 2 Graphs Equations And Inequalities

Page 88 Problem 1 Answer

Given :1500 feet.

To complete the table to represent the problem situation.

Carnegie Learning Algebra I, Student Text, Volume 1, 3rd Edition, Chapter 2 Graphs , Equations, And Inequalities 1

Using the inequality method.

The two changing quantities are time and the height of the plane.

The height of the plane depends on the time, the height of the plane is the dependent quantity and the time is the independent quantity.

The units for time are minutes and the units for height are feet since the given rate of change has units of feet per minute.

Problem situation marked on the table.

Carnegie Learning Algebra I, Student Text, Volume 1, 3rd Edition, Chapter 2 Graphs , Equations, And Inequalities 1 1

Page 88 Problem 2 Answer

Given :1500 feet.

To write a function,g(t), to represent this problem situation.

Using the inequality method.

Carnegie Learning Algebra I Student Text Volume 1 3rd Edition Chapter 2 Exercise 2.2 Graphs Equations And Inequalities

At36000 feet, the crew aboard the 747 airplane begins making preparations to land.

The plane descends at a rate of 1500 feet per minute until it lands.

From the table in the previous question,

The height aftert minutes is−1500t+36,000

So if g(t) represents the height of the plane,

Theng(t)=−1500t+36,000.

The height of the planeg(t)=−1500t+36,000.

Carnegie Learning Algebra I Chapter 2 Exercise 2.2 Solutions

Carnegie Learning Algebra I Student Text Volume 1 3rd Edition Chapter 2 Exercise 2.2 Graphs Equations And InequalitiesPage 89 Problem 3 Answer

Given :

Carnegie Learning Algebra I, Student Text, Volume 1, 3rd Edition, Chapter 2 Graphs , Equations, And Inequalities 3

To describe the mathematical meaning of each part of the function.Using the inequality method.

Carnegie Learning Algebra I, Student Text, Volume 1, 3rd Edition, Chapter 2 Graphs , Equations, And Inequalities 3 1

t is the independent variable so its mathematical meaning is the input value.

It has units of minutes and its contextual meaning is how long the plane is descending.

Described the mathematical meaning of each part of the function.

Carnegie Learning Algebra I, Student Text, Volume 1, 3rd Edition, Chapter 2 Graphs , Equations, And Inequalities 3 2

Page 89 Problem 4 Answer

Given :

Carnegie Learning Algebra I, Student Text, Volume 1, 3rd Edition, Chapter 2 Graphs , Equations, And Inequalities 4

To graphg(t) on the coordinate plane shown.Using the graphical method.

From the table in Problem2,the graph must pass through the points(0,36,000),(2,33,000),(4,30,000),(6,27,000),(12,18,000), and(20,6,000).

Plot these points and then connect them with a straight line. Draw the line long enough to intersect the x-axis:

Carnegie Learning Algebra I, Student Text, Volume 1, 3rd Edition, Chapter 2 Graphs , Equations, And Inequalities 4 2

The graph of g(t)is:

Carnegie Learning Algebra I, Student Text, Volume 1, 3rd Edition, Chapter 2 Graphs , Equations, And Inequalities 4 1

Carnegie Learning Algebra I Student Text Volume 1 3rd Edition Chapter 2 Exercise 2.2 Graphs Equations And InequalitiesPage 90 Problem 5 Answer

Given :14,000 feet.

To use the table to determine how long it will take the plane to descend to 14,000 feet.

Using the inequality method.

The table has the ordered pairs(12,18,000) and⇒(20,6,000)

so the plane will reach a height of14,000 feet at some time between 12 and 20.

The plane is descending 1500 feet per second and 18,000−14,000=4,000,

It will take the plane about 4,000/1500≈3 minutes to go from18,000 feet to 14,000feet.

An approximation of the time it takes to reach14,000

feet is then12+3=15 minutes.

The time it takes to reach 14,000 feet is 15minutes.

Page 90 Problem 6 Answer

Given :y=14,000

To explain what the intersection point means in terms of this problem situation.

Using the graphical method.

Carnegie Learning Algebra I, Student Text, Volume 1, 3rd Edition, Chapter 2 Graphs , Equations, And Inequalities 10 1

Draw the horizontal line y=14,000 on the graph made in question 5 and find an estimate for the point of intersection.

The plane will then reach a height of 14,000 feet in approximately 15 minutes:

Determined the intersection point. The graph is a height of 14,000 feet in approximately 15 minutes.

Carnegie Learning Algebra I, Student Text, Volume 1, 3rd Edition, Chapter 2 Graphs , Equations, And Inequalities6 1

Page 90 Problem 7 Answer

Substituteg(t)=14,000 into the function

g(t)=−1500t+36,000 and solve fort:

g(t)=−1500t+36,000

14,000=−1500t+36,000

−22,000=−1500t

−22,000/−1500=−1500t/−1500

44/3=t

142/3=t

The plane will reach a height of 14,000 feet in 142/3 minutes.

The plane will reach a height of 14,000 feet in 142/3 minutes.

Graphs, Equations, And Inequalities Chapter 2 Exercise 2.2 Answers

Carnegie Learning Algebra I Student Text Volume 1 3rd Edition Chapter 2 Exercise 2.2 Graphs Equations And Inequalities Page 90 Problem 8 Answer

Given :14,000 feet.

To use the table, graph, and the function. What do you notice?

Using the inequality method.

Determine how long will it take the plane to descend to14,000 feet

I was only able to find an estimate for the solution by using a table and using the graph but,

I was able to find the exact solution using the function.

The table and graph gave an estimate for the solution and the function gave an exact solution.

The table and graph gave an estimate for the solution and the function gave an exact solution.

Page 91 Problem 9 Answer

Given :24,000.

To use the table to determine how long it will take the plane to descend to 24,000 feet.

Using the inequality method.

The table has the ordered pairs(12,18,000) and (6,27,000)

so the plane will reach a height of 24,000 feet at some time between 6 and 12.

The plane is descending 1500 feet per second and27,000−24,000=3,000,

it will take the plane3,000/1500=2 minutes to go from 27,000 feet to 24,000 feet.

It then takes the plane 6+2=8 minutes to reach 24,000 feet.

The plane to descend to 24,000 feet is 8 minutes.

Page 91 Problem 10 Answer

Given :y=24,000.

To explain what the intersection point means in terms of this situation.

Using the inequality method.

Carnegie Learning Algebra I, Student Text, Volume 1, 3rd Edition, Chapter 2 Graphs , Equations, And Inequalities 10

Draw the horizontal liney=24,000 on the graph you made in question 5 and find an estimate for the point of intersection.

The plane will then reach a height of 24,000 feet in 8 minutes:

The graph is a height of 24,000 feet in 8 minutes.

Carnegie Learning Algebra I, Student Text, Volume 1, 3rd Edition, Chapter 2 Graphs , Equations, And Inequalities 10 1

Page 91 Problem 11 Answer

Given :24,000 feet.

To solve the equation fort.

Using the inequality method.

Substitute g(t)=24,000 into the function

g(t)=−1500t+36,000 and solve fort:

g(t)=−1500t+36,000

24,000=−1500t+36,000

−12,000=−1500t

−12,000/−1500=−1500t/−1500

8=t

The plane will reach a height of 24,000 feet in 8 minutes.

The equation of t is 8 minutes.

Carnegie Learning Algebra I Student Text Volume 1 3rd Edition Chapter 2 Exercise 2.2 Graphs Equations And Inequalities Page 91 Problem 12 Answer

Given :24,000 feet.

To use the table, graph, and the function. What do you notice?

Using the inequality method.

Using the table,I was only able to find the exact solution by using the rate of change since none of the ordered pairs in the table had a height of 24,000 feet.

Using the graph, I could find the exact solution since the time was a whole number.

Using the function, I could also find the exact solution.

The exact solution since the time was a whole number.

Page 92 Problem 13 Answer

Given : For how many heights can you calculate the exact time using the table.

To calculate the exact time using the table.

Using the inequality method.

Calculate the exact time using the table:

The table only has 6 ordered pairs so there are only 6 heights,

can find the exact time using only the ordered pairs in the table.

Perfect timing using only the pairs ordered in table 6.

Page 92 Problem 14 Answer

Given in graph. To find the height for calculating the exact time,Use the method of graphical.

Find the exact time using graph only when the height is a multiple of 4,000 since y-axis has a scale of 4,000 and when the time is a multiple of 4.

The only ordered pairs that meet these requirements are

(0,36,000),(8,24,000),(16,12,000),(24,0).

Any other height would be an estimate so there are only 4 heights, can find the exact time.

For 4 heights, can calculate the exact time using the graph.

Carnegie Learning Algebra I Exercise 2.2 Solutions Guide

Carnegie Learning Algebra I Student Text Volume 1 3rd Edition Chapter 2 Exercise 2.2 Graphs Equations And Inequalities Page 92 Problem 15 Answer

Given in function.To find the height for calculating the exact time,Use the method of properties of function.

If find any height using the function, then there are infinitely many exact times can find.

The function will give infinitely many solutions.

Carnegie Learning Algebra I, Student Text, Volume 1, 3rd Edition, Chapter 2 Graphs , Equations, And Inequalities e 15

Therefore, infinitely many exact times can find in finding any height using the function.

For infinitely many heights we can calculate the exact time using the function.

Carnegie Learning Algebra I, Student Text, Volume 1, 3rd Edition, Chapter 2 Graphs , Equations, And Inequalities e 15 1

Page 92 Problem 16 Answer

Given in words, always, sometimes, never.To complete the sentence using the word bank,Use the method of property of linear function.

Tables can give an exact solution if it is one of the ordered pairs in the table and an estimate if it is not.

Therefore here the suitable word to fill the blank is “always”, then the sentence is,

“I can always use a table to determine  an approximate value”.

I can always use a table to determine an approximate value.

Page 92 Problem 17 Answer

Given in words, always, sometimes, never. To complete the sentence using the word bank,Use the method of property of linear function.

Tables can give an exact solution if it is one of the ordered pairs in the table and an estimate if it is not.

Therefore here the suitable word to fill the blank is “sometimes”, then the sentence is,

“I can sometimes use a graph to calculate an exact value”.

I can sometimes use a graph to calculate an exact value.

Carnegie Learning Algebra I Student Text Volume 1 3rd Edition Chapter 2 Exercise 2.2 Graphs Equations And Inequalities Page 92 Problem 18 Answer

Given in words, always, sometimes, never.

To complete the sentence using the word bank,Use the method of property of linear function.

A graph can give an exact solution if it is at an intersection of the grid and an estimate  if it is not.

Therefore here the suitable word to fill the blank is “always”, then the sentence is,

“I can always use a graph to determine an approximate value”.

I can always use a graph to determine an approximate value.

Page 92 Problem 19 Answer

Given in words, always, sometimes, never.

To complete the sentence using the word bank,Use the method of property of linear function.

A graph can give an exact solution if it is at an intersection of the grid and an estimate  if it is not.

Therefore here the suitable word to fill the blank is “sometimes”, then the sentence is,

“I can sometimes use a graph to calculate an exact value”.

I can sometimes use a graph to calculate an exact value.

Page 92 Problem 20 Answer

Given in words, always, sometimes, never.

To complete the sentence using the word bank,Use the method of property of linear function.

A function gives an exact solution and can be rounded to get an estimated solution.

Therefore here the suitable word to fill the blank is “always”, then the sentence is,

“I can always use a function to determine an approximate value”.

I can always use a function to determine an approximate value.

Exercise 2.2 Graphs, Equations, And Inequalities Explained

Carnegie Learning Algebra I Student Text Volume 1 3rd Edition Chapter 2 Exercise 2.2 Graphs Equations And InequalitiesPage 92 Problem 21 Answer

Given in words, always, sometimes, never.

To complete the sentence using the word bank,Use the method of property of linear function.

A function gives an exact solution and can be rounded to get an estimated solution.

Therefore here the suitable word to fill the blank is “always”, then the sentence is,

“I can always use a function to calculate an exact value”.

I can always use a function to calculate an exact value.

Page 94 Problem 22 Answer

Given in Dawson would like to exchange $70 more, Dawson should have a total of £343.54707, Erin says he should have a total of £343.55, Tre says he should have a total of £342.

To find who’s reasoning is correct,Use the method of comparison.

since the pound is made up of 100 pence, the number of pounds must be rounded to two decimal places.

Jonathon’s answer is then incorrect since he didn’t round.

Tre is incorrect because he rounded to the conversion rate to 0.6.

Erin is correct because she used the exact conversion rate and rounded the number of pounds to two decimal places.

Erin’s reasoning is correct.

Page 94 Exercise 1 Answer

Given in if Dawson only exchanges an additional $50.

To find how many total pounds will Dawson have,Use the method of solving a function.

The function is f(d)=0.622101d+300.

Substitute d=50

f(50)=0.622101(50)+300

Simplify, f(50)=31.10505+300

=331.10505

Since British pound is made up of 100 pence, round the answer into two decimal places.

∴f(50)≈331.11.

331.11 British pounds will Dawson have if he only exchanges an additional $50.

Page 95 Exercise 2 Answer

Given in a table.

Carnegie Learning Algebra I, Student Text, Volume 1, 3rd Edition, Chapter 2 Graphs , Equations, And Inequalities e2 1

To complete the table,Use the method of graphing calculator and TABLE feature.

Use the TABLE feature on the graphing calculator and and the steps given in book to complete the table.

The first three values for U.S dollars are multiples of 25 so first use ΔTbl=25:

Carnegie Learning Algebra I, Student Text, Volume 1, 3rd Edition, Chapter 2 Graphs , Equations, And Inequalities e2

he last row in the table could not be filled in since it wasn’t the graphing calculator table. From the graphing calculator table though you now it is between $250 and $275 so set Tbl Start=250 and

ΔTbl=5.

466.10 is still not in the table but it will fall between $265  and $270 so set the Tblstart=265 and ΔTbl=1.

This then gives $267 for £466.10.

Using graphing calculator and the TABLE feature the completed table is,

Carnegie Learning Algebra I, Student Text, Volume 1, 3rd Edition, Chapter 2 Graphs , Equations, And Inequalities e2 2

Carnegie Learning Algebra I Student Text Volume 1 3rd Edition Chapter 2 Exercise 2.2 Graphs Equations And Inequalities Page 96 Exercise 3 Answer

Given in table.To complete the table,Use the method of table feature.

Yes. But the TblStart and ΔTbl values had to be adjusted multiple times to fill in the last row.

All of the rows but the last one could be filled in using TblStart=100 and ΔTbl=25.

From this table, it came to knew that the last rows as between $250 and $275 so then,

Set TblStart=250 and ΔTbl=5.

From this table, it came to knew that the last row was between $265 and $270, so then,

Set TblStart=265 and ΔTbl=1

Then able to find that $267 as the value for the last row.

Yes. But the TblStart and ΔTbl values had to be adjusted multiple times to fill in the last row.

Page 96 Exercise 4 Answer

Given in Amy exchanges an additional $375.

To find the amount of total British pound,Use the method of graphing calculator.

Here x=375

Using the value feature in graphing calculator that following the steps in the book,

The input x=375

gives a result of y=533.29.

The graphing calculator is capable of plotting graphs and solving simultaneous equations.

533.29 British pounds will Amy have if she exchanges an additional $375.

Carnegie Learning Algebra I Student Text Volume 1 3rd Edition Chapter 2 Exercise 2.2 Graphs Equations And Inequalities Page 96 Exercise 5 Answer

Given in Amy exchanges an additional $650.

To find the amount of total British pound,Use the method of graphing calculator.

Here, x=650

Using the value feature on the graphing calculator following the steps in the book,

If the input is x=650, then the value of y=704.37.

The graphing calculator is capable of plotting graphs and solving simultaneous equations.

704.37 British pounds will Amy have if she exchanges an additional $650.

Page 96 Exercise 6 Answer

Given in Amy exchanges an additional $2000.To find the amount of total British pound,Use the method of graphing calculator.

Here, x=2000 Using the value feature on graphing calculator following the steps in the book,

If the input is x=2000 then the value of y=1544.20.

The graphing calculator is capable of plotting graphs and solving simultaneous equations.

1544.20 British pounds will Amy have if she exchanges an additional $2000.

Page 97 Exercise 7 Answer

Given in Solution,To verify that the solution is correct,Use the method of simplifying function

Verify that each solution is correct by substituting U.S dollar amount into the function f(d)=0.622101d+300.

Substitute d=375

f(375)=0.622101(375)+300≈533.29.

Substitute d=650

f(650)=0.622101(65)+300

≈704.37.

Substitute d=2000

f(2000)=0.622101(2000)+300

≈1544.20.

This gives the same answer.

By substituting each U.S dollar amount into the function f(d)=0.622101d+300, it can verify that each solution is correct.

Chapter 2 Exercise 2.2 Carnegie Learning Detailed Solutions

Carnegie Learning Algebra I Student Text Volume 1 3rd Edition Chapter 2 Exercise 2.2 Graphs Equations And InequalitiesPage 97 Exercise 8 Answer

Given in value feature.

To find the advantages ad limitations of using the value feature,Use the method of analysing value feature.

The value feature can be used to find the value of the dependant quantity for any independent quantity in the graphing window.

if the value of the independent quantity is not in the graphing window, the dimensions of the graphing window can be changed so it will be.

The value feature does not allow to find the value of the independent quantity given the value of the dependent quantity though.

That is, it can be used to find the value of the dependent quantity for any value of independent quantity and it cannot be used though to find the value of the independent quantity for a given value of the dependent quantity.

The advantage of the value feature is that, it can be used to find the value of the dependent quantity for any value of independent quantity.

The limitation of the value feature is that, it cannot be used though to find the value of the independent quantity for a given value of the dependent quantity.

Page 98 Exercise 9 Answer

Given: The total amount George have is £1699.73

To find: How many additional U.S. dollars did Jorge exchange

Method used : intersect feature

The graph of the intersection is

Carnegie Learning Algebra I, Student Text, Volume 1, 3rd Edition, Chapter 2 Graphs , Equations, And Inequalities e9

We have the equation

y=300+0.622101x

1699.73=300+0.622101x

Switch sides

300+0.622101x=1699.73

Subtract 300 from both sides

300+0.622101x−300=1699.73−300

Simplify

0.622101x=1399.73

Divide both sides by 0.622101

0.622101x/0.622101=1399.73/.0.622101

Simplify

x=1399.73/0.622101

The additional U.S. dollars did Jorge exchange is x=1399.73/0.622101

Carnegie Learning Algebra I, Student Text, Volume 1, 3rd Edition, Chapter 2 Graphs , Equations, And Inequalities e9 1

Page 98 Exercise 10 Answer

Given ” Intersect Feature”.To determine advantages and limitations of the intersect feature.Using theory of intersect feature.

The intersect feature is used to find the value of the independent quantity for any value of the dependent quantity on the graph.

But can’t be used to find the value of the dependent quantity for a given value of the independent quantity.

Because if the value of the independent quantity is given, it would need to be graphed.

The intersect feature is used to find the value of the independent quantity for any value of the dependent quantity on the graph.

But can’t be used to find the value of the dependent quantity for a given value of the independent quantity.

Carnegie Learning Algebra I Student Text Volume 1 3rd Edition Chapter 2 Exercise 2.2 Graphs Equations And Inequalities Page 98 Exercise 11 Answer

Given ” Intersect feature”.

To determine “could we use each of the graphing calculator strategies discussed in this lesson with any function, not just linear functions”Using theory of intersect feature.

The intersect feature and tables on a graphing calculator can be used on any function.

However, some functions may have none, one, or two or more intersections with a horizontal line, unlike a linear function that has one or none.

Also, some functions do not have a domain of all real number so the value feature and table will be unable to evaluate.

Yes, we could use each of the graphing calculator strategies discussed in this lesson with any function, not just linear functions.

Page 98 Exercise 12 Answer

Givenf(x)=14.95x+31.6

To determinef(3.5)

Using methods of graphing.

Given function f(x)=14.95x+31.6

Puttingx=3.5

f(3.5)=14.95×(3.5)+31.6

f(3.5)=52.325+31.6

f(3.5)=83.925

The value off(3.5)=83.925

Page 98 Exercise 13 Answer

Givenf(x)=14.95x+31.6

To determine f(16.37)

Using methods of graphing.

Given function f(x)=14.95x+31.6

Puttingx=16.37

f(16.37)=14.95×(16.37)+31.6

f(16.37)=244.7315+31.6

f(16.37)=276.3315

The value off(16.37)=276.3315

How To Solve Exercise 2.2 Graphs, Equations, And Inequalities

Carnegie Learning Algebra I Student Text Volume 1 3rd Edition Chapter 2 Exercise 2.2 Graphs Equations And Inequalities Page 98 Exercise 14 Answer

Givenf(x)=14.95x+31.6

To determinef(50.1)

Using methods of graphing.

Given function f(x)=14.95x+31.6

Puttingx=50.1

f(50.1)=14.95×(50.1)+31.6

f(50.1)=748.995+31.6

f(50.1)=780.595

The value off(50.1)=780.595

Page 99 Exercise 15 Answer

Given: f(x)=−3.315x−20 when f(x)=23.38

To sketch the graphs on the coordinate plane provided.Using the method of Graphical.

To sketch the graphs on the coordinate plane provided.

Type Y1=−3.315x−20 and Y2=23.38.

when y=23.38

x≈−13.09

To graph f(x)=23.38, graph a horizontal line passing through 23.38 on the y-axis.

To graph f(x)=−3.315x−20, enter TblStart =−100 and ΔTbl=20

Then use the ordered pairs in the table to find points on the graph.

Plot these points and then connect them with a straight line.

The graph of the function is

Carnegie Learning Algebra I, Student Text, Volume 1, 3rd Edition, Chapter 2 Graphs , Equations, And Inequalities e 15

The graph of the given function in a coordinate plane is shown.:

Carnegie Learning Algebra I, Student Text, Volume 1, 3rd Edition, Chapter 2 Graphs , Equations, And Inequalities e 15 1

Page 99 Exercise 16 Answer

Given: 1/2x+5=164/5

To find the graph on the coordinate plane.Using the method of  Graphing calculator.

Carnegie Learning Algebra I, Student Text, Volume 1, 3rd Edition, Chapter 2 Graphs , Equations, And Inequalities e 16 1

Given 1/2x+5=164/5 here Y1=1/2x+5and Y2=164/5

Plot Y1 and Y2 values on the graph

Solving 1/2x+5=164/5

Convert mixed fractions into fractions

164/5=16×5+4/5

80+4/5=84/5

1/2x+5=84/5

Transfer 5 to Right-hand side 1/2x=84/5−5

1/2x=84−25/5

1/2x=59/5

Transfer 1/2 to Right-hand side

x=59/5×2/1

x=118/5

x=23.6

The graph on the coordinate plane is shown below:

Carnegie Learning Algebra I, Student Text, Volume 1, 3rd Edition, Chapter 2 Graphs , Equations, And Inequalities e 16 1

The independent value is x=23.6

Page 100 Exercise 17 Answer

Given: The word box to complete each sentence.

To find a table to determine an approximate value.Using the method of Graphing calculator.

Given the word, box to complete each sentence.

I can Always use a table to determine an approximate value.

Tables can determine an approximate value if they are in ordered pairs.

they also determine that they are not approximate values if they are not in ordered pairs.

So, I can always use tables to determine approximate values.

I can always use a table to determine an approximate value.

Algebra I Chapter 2 Exercise 2.2 Answer Key

Carnegie Learning Algebra I Student Text Volume 1 3rd Edition Chapter 2 Exercise 2.2 Graphs Equations And Inequalities Page 100 Exercise 18 Answer

Given: The word box to complete each sentence.To find a table to calculate an exact value.Using the method of Graphing calculator.

Given the word, box to complete each sentence.

I can sometimes use a table to calculate an exact value

When we solve a problem or anything using a certain thing or method we can never determine beforehand that will give us an exact value.

So we can sometimes only determine exact values.

It is not only tables but anything we want to determine we will not be able to tell whether they will give an exact value unless we solve them.

I can sometimes use a table to calculate an exact value.

Page 100 Exercise 19 Answer

Given: The word box to complete each sentence.To find a graph to determine an approximate value.Using the method of Graphing calculator.

Given the word, box to complete each sentence.

I can always use a graph to determine an approximate value.

here approximate value means the values which are nearly equal to the exact values.

when we plot a graph we can always use the points on the graph to determine the approximate values.

Because when we plot a graph there will always be differences in points which are nothing but approximate values.

I can always use a graph to determine an approximate value.

Page 100 Exercise 20 Answer

Given: The word box to complete each sentence.

To find a graph to calculate an exact value.Using the method of Graphing calculator.

Given the word, box to complete each sentence.

I can sometimes use a graph to calculate an exact value.

Not always a graph can give exact values.

Because when we solve the points on the graph there will at least be some point difference.

So graphs can only be used sometimes to determine an exact value.

I can sometimes use a graph to calculate an exact value.

Page 100 Exercise 21 Answer

Given: The word box to complete each sentence.

To find a  function to determine an approximate value.Using the method of Graphing calculator.

Given the word, box to complete each sentence.

I can always use a  function to determine an approximate value.

here approximate value means the values which are nearly equal to the exact values.

In functions, we mostly get an approximate value while solving x and y conditions.

We mostly get approximate values in all the methods and they are easy to find.

I can always use a  function to determine an approximate value.

Carnegie Learning Algebra I Student Text Volume 1 3rd Edition Chapter 2 Exercise 2.2 Graphs Equations And Inequalities Page 100 Exercise 22 Answer

Given: The word box to complete each sentence.

To find a function to calculate an exact value.Using the method of Graphing calculator.

Given the word, box to complete each sentence.

I can  always use a function to calculate an exact value

In functions, we mostly get an approximate value while solving x and y conditions.

But in functions, we can round off these approximate values to get an exact value.

So in functions, approximate values can always be round off to get an exact value.

I can always use a function to calculate an exact value.

Carnegie Learning Algebra I Student Text Volume 1 3rd Edition Chapter 2 Exercise 2.1 Graphs Equations And Inequalities

Carnegie Learning Algebra I Student Text Volume 1 3rd Edition Chapter 2 Graphs Equations And Inequalities

Page 74 Problem 1 Answer

Given: A747 airliner has an initial climb rate of 1800 feet per minute until it reaches a height of 10,000 feet.

To identify the independent and dependent quantities in this problem situation.Using the explanation method.

To find independent and dependent quantities in this problem situation are,

The height of the airplane depends on the time,

So height is the dependent quantity and time is the independent quantity.

The height of the airplane depends on the time, so height is the dependent quantity and time is the independent quantity.

Page 74 Problem 2 Answer

Given: A747 airliner has an initial climb rate of 1800 feet per minute until it reaches a height of 10,000 feet.

To find the dependent quantity (the output values).Using the explanation method.

To find the dependent quantity are,

The dependent quantity of height is measured in feet.

The dependent quantity of height is measured in feet.

Carnegie Learning Algebra I Student Text Volume 1 3rd Edition Chapter 2 Exercise 2.1 Graphs Equations And Inequalities

Page 74 Problem 3 Answer

Given: Which function family do you think best represents this situation.

To find the represents this situation.Using the explanation method.

To find function family do you think best represents this situation are,

The situation shows a linear function because the rate the plane ascends is constant.

So, this situation belongs to the linear function family.

This situation belongs to the linear function family.

Carnegie Learning Algebra I Chapter 2 Exercise 2.1 Solutions

Carnegie Learning Algebra I Student Text Volume 1 3rd Edition Chapter 2 Exercise 2.1 Graphs Equations And Inequalities Page 75 Problem 4 Answer

Given: Write the independent and dependent quantities and their units of measure in the table.

To find the dependent quantity values for each of the independent quantity values.

Using the method of graphical.

To find dependent quantity values and independent quantity values are,

Carnegie Learning Algebra I, Student Text, Volume 1, 3rd Edition, Chapter 2 Graphs , Equations, And Inequalities 4

The independent quantity and dependent quantity values are,

Carnegie Learning Algebra I, Student Text, Volume 1, 3rd Edition, Chapter 2 Graphs , Equations, And Inequalities 4 1

Page 76 Problem 5 Answer

Given: The first differences in the tableTo find what do you notice about the first differences in the table.Using the method subtraction.

From the given,

The first differences in the table,

Carnegie Learning Algebra I, Student Text, Volume 1, 3rd Edition, Chapter 2 Graphs , Equations, And Inequalities 5

The first difference were all 1800. This means graph has a constant rate of change of 1800.

The first differences in the table were all 1800. This means graph has a constant rate of change of 1800.

Page 76 Problem 6 Answer

Given:

Time (minutes)                          Height (feet)

2.5                                              4500

3                                                5400

5                                               9000​

(2.5,4500) and (3,5400)

To calculate the rate of change between the points represented by the given ordered pairs in the section of the table shown.Using the method rate of change.

From the given,

Let (x1,y1)=(2.5,4500)

(x2,y2)=(3,5400)

The rate of change is then,y2−y1/x2−x1

=5400−4500/3−2.5

=900/0.5

=1800.

The rate of change between the points represented by the given ordered pairs (2.5,4500)and (3,5400) is 1800.

Carnegie Learning Algebra I Student Text Volume 1 3rd Edition Chapter 2 Exercise 2.1 Graphs Equations And Inequalities Page 76 Problem 7 Answer

Given:

Time (minutes)                          Height (feet)

2.5                                              4500

3                                                5400

5                                               9000​

(3,5400) and (5,9000)

To calculate the rate of change between the points represented by the given ordered pairs in the section of the table shown.Using the method rate of change.

From the given,

Let (x1,y1)=(3,5400)

(x2,y2)=(5,9000)

The rate of change is then,y2−y1/x2/−x1

=9000−5400/5−3

=3600/2

=1800.

The rate of change between the points represented by the given ordered pairs (3,5400)and (5,9000) is 1800.

Page 76 Problem 8 Answer

Given:

Time (minutes)                          Height (feet)

2.5                                              4500

3                                                5400

5                                               9000​​

(2.5,4500) and (5,9000)

To calculate the rate of change between the points represented by the given ordered pairs in the section of the table shown.Using the method rate of change.

From the given,

Let (x1,y1)=(2.5,4500)

(x2,y2)=(5,9000)

The rate of change is then,

y2−y1/x2−x1

=9000−4500/5−2.5

=4500/2.5

=1800.

The rate of change between the points represented by the given ordered pairs (2.5,4500) and (5,9000) is 1800.

Page 77 Problem 9 Answer

Given: The rates of changeTo find what you notice about the rates of change. Using the method rate of change.

From the given,

Time (minutes)                          Height (feet)

2.5                                              4500

3                                                5400

5                                               9000​

​Notice about the rates of change, the rate of change between (2.5,4500) and (3,5400),(3,5400) and (5,9000),(5,9000) and (2.5,4500) is equal to 1800.

The rate of change for each pair of ordered pairs is equal to 1800.

The rate of change for each pair of ordered pairs is equal to 1800.

Page 77 Problem 10 Answer

Given:  The rate of change and the unit rate of change.

Use your answers from Question 7 through Question 10 to describe the difference between a rate of change and a unit rate of change. Using the method rate of change.

From the given, A rate of change is a ratio of two quantities such as 900/2 m/sec.

A unit rate of change is the rate of change rewritten to have a denominator of 1.
The unit rate of change of 900/2 m/sec is 450 m/sec which means,900/2

=450/1.

The difference between a rate of change and a unit rate of change is that the rate of change is a ratio of two quantities and a unit rate of change is the rate of change rewritten to have a denominator of 1.
Graphs, Equations, And Inequalities Chapter 2 Exercise 2.1 Answers

Carnegie Learning Algebra I Student Text Volume 1 3rd Edition Chapter 2 Exercise 2.1 Graphs Equations And Inequalities Page 77 Problem 11 Answer

Given: The first differences and the rates of change between ordered pairs demonstrate that the situation represents a linear function.
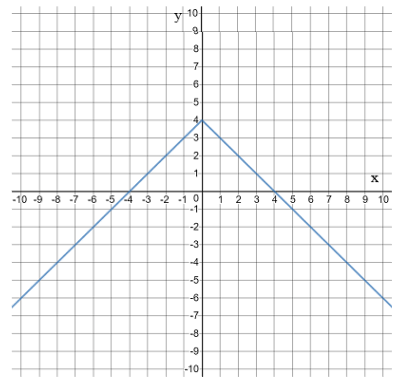
To find how the first differences and the rates of change between ordered pairs demonstrate that the situation represents a linear function.

Using the method first difference and rate of change.

From the given, The first differences and the rates of change between ordered pairs demonstrate that the situation represents a linear function:

If the first differences have a constant difference for the x- x-coordinate and a constant difference for the y- coordinate, then the ordered pairs represent the linear function.

If each rate of change between ordered pairs is equal to a constant number, then the ordered pairs represent a linear function.

This is because a linear function is defined as a function with a constant rate of change ( its slope).

If the first difference and the rates of change between ordered pairs are constant then the first differences and the rates of change between ordered pairs demonstrate that the situation represents a linear function.

Page 77 Problem 12 Answer

Alita says that for a car to keep up with the plane on the ground, it would have to travel at only 20.5 miles per hour.

To find Alita is correct. Using the method of explanation.

To find Alita is correct.

Alita is not correct.

1800 feet per minute indeed is about 20.5

miles per hour, but this rate compares height to time, not horizontal distance to time.

The plane is ascending at about 20.5 miles per hour, but its horizontal speed, or ground speed, is probably much faster.

Alita is not correct.

1800 feet per minute is indeed about 20.5 miles per hour, but this rate compares height to time, not horizontal distance to time.

Page 78 Problem 13 Answer

Given: The table

Carnegie Learning Algebra I, Student Text, Volume 1, 3rd Edition, Chapter 2 Graphs , Equations, And Inequalities 13

To complete the table shown for the problem situation described in Problem 1, Analyzing Tables.

Using the method of analyzing expression.

From the given,t is the independent variable and has a unit of minutes. It is an input value and its contextual meaning is how long, in minutes, the plane has been flying in the air.

1800 is the given rate of change in feet per minute. Its contextual meaning is how fast the plane is ascending, so it is how many feet the plane climbs per minute.

1800t is the expression with unit feet. Its contextual meaning is the height of the plane in feet. It depends on the time in minutes, it is the output value.

The table is then filled as,

Carnegie Learning Algebra I, Student Text, Volume 1, 3rd Edition, Chapter 2 Graphs , Equations, And Inequalities 13 1

Hence, The table is filled as,

Carnegie Learning Algebra I, Student Text, Volume 1, 3rd Edition, Chapter 2 Graphs , Equations, And Inequalities 13 2

Carnegie Learning Algebra I Student Text Volume 1 3rd Edition Chapter 2 Exercise 2.1 Graphs Equations And InequalitiesPage 80 Problem 14 Answer

Given: The plane is at 3600 feet.To list the different ways the height of the plane is represented in the example.

Using the method of simplification.

Find the different ways the height of the plane;

The plane is at 3600 feet,

The height of the plane after t minutes is represented by both h(t) and 1800 t

Substitutet=2,

The height of the plane after 2 minutes is h(2)=1800(2)=3600.

The height of the plane is 3600.

Page 80 Problem 15 Answer

Given: h(3)=.

To write a complete sentence to interpret your solution in terms of the problem situation.Using the method of simplification.

To write a complete sentence;

Simplify, The height of the plane at each time in minutes,

h=1800

h(3)=1800(3)

=5400.

The height of the plane after 3 minutes is 5400 feet.

The height of the plane after 3 minutes is 5400 feet.

Page 80 Problem 16 Answer

Given:h(5.1).

To write a complete sentence to interpret your solution in terms of the problem situation.Using the method of simplification.

To write a complete sentence;

Simplify, The height of the plane at each time in minutes,

h=1800

h(5.1)=1800(5.1)

=9180.

The height of the plane after 5.1 minutes is 9180 feet.

The height of the plane after 5.1 minutes is 9180 feet.

Page 80 Problem 17 Answer

Given:h(−4).

To write a complete sentence to interpret your solution in terms of the problem situation.

Method used: Simplification.

To write a complete sentence;

Simplify, The height of the plane at each time in minutes,

h=1800

h(−4)=1800(−4)

=−7200.

This ordered pair is not a solution in terms of the problem situation since time cannot be negative.

This ordered pair is not a solution in terms of the problem situation since time cannot be negative.

Carnegie Learning Algebra I Graphs, Equations, And Inequalities Solutions

Carnegie Learning Algebra I Student Text Volume 1 3rd Edition Chapter 2 Exercise 2.1 Graphs Equations And Inequalities Page 81 Problem 18 Answer

Given:h(t)=1800t.

To find out why can you substitute 7200 for h(t)?Using the method of substitute.

Find7200 for h(t);

The expression h(t) represents the height of the plane after t minutes,

The plane 4 minutes to reach a height of 7200 feet.

7200 is the possible height of the plane,

Substitute 7200 for h(t).

7200 is a possible height of the plane and h(t) represents the height of the plane after t minutes.

Page 81 Problem 19 Answer

Given: 5400 feet.

To write a complete sentence to interpret your solution in terms of the problem situation.

Method used: Simplification.

To write a complete sentence;

Simplify,

h(t)=1800t

5400=1800t

5400/1800=1800t

1800/3=t.

The height of the plane is 5400 feet 3 minutes after takeoff.

Carnegie Learning Algebra I Student Text Volume 1 3rd Edition Chapter 2 Exercise 2.1 Graphs Equations And Inequalities Page 81 Problem 20 Answer

Given:9000 feet.

To write a complete sentence to interpret your solution in terms of the problem situation.Using the method of simplification.

To write a complete sentence;

Simplify,

h(t)=1800t

9000=1800t/9000

1800=1800t/1800

5=t.

The height of the plane is 9000 feet, 5 minutes after takeoff.

Page 81 Problem 21 Answer

Given:3150 feet.

To write a complete sentence to interpret your solution in terms of the problem situation.

Using the method of simplification.

To write a complete sentence;

Simplify,

h(t)=1800t

3150=1800t

3150/1800=1800t/1800

1.75=t.

The height of the plane is 3150 feet 1.75 minutes after takeoff.

Page 81 Problem 22 Answer

Given:4500feet.

To write a complete sentence to interpret your solution in terms of the problem situation.

Using the method of simplification.

To write a complete sentence;

Simplify,

h(t)=1800t

4500=1800t

4500/1800=1800t/1800

2.5=t.

The height of the plane is 4500 feet2.5 minutes after takeoff.

Exercise 2.1 Graphs, Equations, And Inequalities Explained

Carnegie Learning Algebra I Student Text Volume 1 3rd Edition Chapter 2 Exercise 2.1 Graphs Equations And Inequalities Page 82 Problem 23 Answer

Given:7200=1800t.

To find what doest,h(t) represent?Using the method of graphical.

To find t,h(t)represent;After takeoff, it takes the plane4 minutes to reach a height of 7200 feet,

h(t)=1800t

7200=1800t

=(4,7200)

(t,h(t)) represents the ordered pairs on the graph of h(t)=1800t.

(t,h(t)) represents the ordered pairs on the graph of h(t)=1800t.

Page 82 Problem 24 Answer

Given:h(t)=1800t,

y=1800x.

To explain the connection between the form of the given function and the equation in terms of the independent and dependent quantities.Using the method of graphical.

To explain the connection between the form of the given function and equation;h(t)=1800t,

The independent quantity is t,The dependent quantity is h(t),y=1800x, The independent quantity is x,

The dependent quantity is y.

The two functions then represent the same relationship between the height of the plane and the time the plane is in flight.

The two functions represent the same relationship between the height of the plane and the time the plane is in flight.

Page 82 Problem 25 Answer

Given:h(t)=1800t,

y=1800x.

To explain the connection between the form of the given function and the equation in terms of the independent and dependent quantities.Using the method of graphical.

To explain the connection between the form of the given function and equation;h(t)=1800t, The independent quantity is t, The dependent quantity is h(t),y=1800x, The independent quantity is x, The dependent quantity is y.

The two functions then represent the same relationship between the height of the plane and the time the plane is in flight.

The two functions represent the same relationship between the height of the plane and the time the plane is in flight.

Carnegie Learning Algebra I Student Text Volume 1 3rd Edition Chapter 2 Exercise 2.1 Graphs Equations And Inequalities Page 83 Problem 26 Answer

Given: Using the graphing method to the solutions.To find where you used an algebraic method. What do you notice? Using the method of graphical.

To find where you used an algebraic method;

It was algebraically h(t)=5400

t=3,

h(t)=9000,

t=5,

h(t)=3150

t=1.75,

h(t)=4500

t=2.5.

It was graphically h(t)=5400

t=3,

h(t)=9000

t=5,

h(t)=3150

t=1.75

h(t)=4500

t=2.5.

Both graphical and algebraical methods give the same results t=2.5.

Page 84 Problem 27 Answer

Given: In a table.

To describe how a linear function is represented.Using the method of linear functions.

To describe how a linear function is represented;

In a table, For example, A common equation for linear function,

y=mx+b

y=mx+b

From a table, a linear function by examining the x and y values.

A table of values for a linear function shows a constant rate of change between the x and y values.

A linear function is represented as ordered pairs with constant first differences or constant rates of change.

Carnegie Learning Algebra I Student Text Volume 1 3rd Edition Chapter 2 Exercise 2.1 Graphs Equations And Inequalities Page 84 Problem 28 Answer

Given: In a graph.To describe how a linear function is represented.Using the method of linear functions.

To describe how a linear function is represented;

In a graph, The graph of a linear function is a straight line.

Graphically, where the line crosses the x-axis, is called a zero, or root.

Algebraically, a zero is an x value at which the function of x is equal to 0.

A linear function is represented as a straight line.

Page 84 Problem 29 Answer

Given: In an equation.To describe how a linear function is represented.Using the method of linear functions.

To describe how a linear function is represented;

In an equation,

The formulay=mx+b is said to be a linear function.

The graph of this function will be a straight line on the (x,y) plane.

The function for a line is expressed this way, called the ‘slope-intercept form’.

A linear function is represented as an equation of the form that is y=mx+b.

Page 84 Problem 30 Answer

Given: Algebraic method.

To find when determining solutions for linear functions.

Using the graphical method.

The graphical method helps find a wide range of solutions but, the solutions may have to be estimated if it is difficult to determine the exact coordinates of the point of intersection.

The algebraic method is useful because the exact solutions can always be found but the equation can be difficult to solve sometimes.

The graphical method helps find a wide range of solutions.

The algebraic method is useful because the exact solutions can always be found.

Chapter 2 Exercise 2.1 Carnegie Learning Guide

Carnegie Learning Algebra I Student Text Volume 1 3rd Edition Chapter 2 Exercise 2.1 Graphs Equations And Inequalities Page 84 Problem 31 Answer

Given: Graphing method.

To find the graphing method for determining solutions will work for any function?

Using the graphical method.

The graphing method for determining solutions:

The graphing method for determining solutions will not work for any function.

The graphical method can always be used to find an estimate for a solution but sometimes the exact solution cannot be found.

No, because the exact solution cannot always be found graphically.

No, because the exact solution cannot always be found graphically.

Page 85 Problem 32 Answer

Given:7x+2=−12.

To solve each equation and justify reasoning.

Using the arithmetic functions.

Solve each equation and justify:

7x+2=−12

Subtract 2 on both sides

7x+2−2=−12−2/7x=−14

Divide both sides by 7

7x/7=−14/7

x=−2

Check the given equation:

7(−2)+2=?−12

−14+2=?−12

−12=−12

Solving the equation7x+2=−2, we getx=−2.

Page 85 Problem 33 Answer

Given :4(x+−7)+12=20.

To solve each equation and justify reasoning.

Using the arithmetic functions.

Solve each equation and justify:

4(x+−7)+12=20

4x+4(−7)+12=20

4x−28+12=20

4x−16=20

Add16 on both sides

4x−16+16=20+16

4x=36

Divide both sides by 4

4x/4=36/4

x=9

Check the given equation:

4(9+−7)+12=? 20

4(2)+12=? 20

8+12=? 20

20=20

Solving the equation4(x+−7)+12=20,we getx=9.

How To Solve Graphs, Equations, And Inequalities Exercise 2.1

Carnegie Learning Algebra I Student Text Volume 1 3rd Edition Chapter 2 Exercise 2.1 Graphs Equations And Inequalities Page 85 Problem 34 Answer

Given:14x−13=9x+1.

To solve each equation and justify reasoning.

Using the arithmetic functions.

Solve each equation and justify:

14x−13=9x+1

Add 13 on both sides

14x−13+13=9x+1+13

14x=9x+14

Subtract 9x on both sides

14x−9x=9x+14−9x

5x=14

Divide both sides by 5x5x/5

=14/5

x=2.8

Check the given equation:

14(2.8)−13=? 9(2.8)+1

39.2−13=? 25.2+1

26.2=26.2

Solving the equation14x−13=9x+1,

we get x=2.8.

Page 85 Problem 35 Answer

Given:x+2/6=2/5.

To solve each equation and justify reasoning.

Using the arithmetic functions.

Solve each equation and justify:

x+2/6=2/5

Multiply both sides by 6/6⋅x+2/6

=6⋅2/5

x+2=12/5

Subtract 2 on both sides

x+2−2=12/5−2

x=12/5−2

Get a common denominator on the right.

x=12/5−10/5

x=2/5

Rewrite as a decimal

x=0.4

Check the given equation:

0.4+2/6=? 2/5

2.4/6=? 0.4

0.4=0.4

Solved the given equation x+2/6=2/5, we getx=0.4.

Carnegie Learning Algebra I Student Text Volume 1 3rd Edition Chapter 1 Exercise 1.4 Quantities And Relationships

Carnegie Learning Algebra I Student Text Volume 1 3rd Edition Chapter 1 Quantities And Relationships

Page 54 Problem 1 Answer

Given: – is a smooth curve.

To graph of this function family. Method used: Functional method.

To find this function family;

Linear functions and linear absolute value functions are made up of line(s) so they are not smooth curves.

Both exponential functions and quadratic functions though are made up of smooth curves.

The correct families are then exponential function family an quadratic function family.

Exponential function family and quadratic function family is a smooth curve.

Carnegie Learning Algebra I Student Text Volume 1 3rd Edition Chapter 1 Exercise 1.4 Quantities And Relationships

Page 54 Problem 2 Answer

Given: – is made up of one or more straight lines.To graph of this function family.

Method used: Functional method.

To find this function family;

Linear functions are made up of one straight line and linear absolute value functions are made up of two straight lines.

Exponential and quadratic functions are curves, not lines.

The correct families are then linear function family and linear absolute value function family.

Linear function family and linear absolute value function family is made up of one or more straight lines.

Carnegie Learning Algebra I Chapter 1 Exercise 1.4 Solutions

Carnegie Learning Algebra I Student Text Volume 1 3rd Edition Chapter 1 Exercise 1.4 Quantities And Relationships Page 54 Problem 3 Answer

Given: – increases or decreases over the entire domain.

To graph of this function family. Method used: Functional method.

To find the family;

Linear functions and exponential functions are either increasing over the entire domain or decreasing over the entire domain.

Quadratic functions and linear absolute value functions are both increasing and decreasing over the entire domain.

The correct families are then linear function family and exponential function family.

Linear and exponential increases or decreases over the entire domain.

Page 54 Problem 4 Answer

Given: – has a maximum or a minimum.To graph of this function family. Method used: Functional method.

To find the family;

Linear functions and exponential functions do not have a maximum or minimum since they are either increasing or decreasing over the entire domain.

Quadratic functions and linear absolute value functions are both increasing and decreasing over the entire domain which means they have a maximum or minimum.

The correct families are then quadratic function family and linear absolute value function family.

Quadratic and linear absolute value has a maximum or a minimum.

Carnegie Learning Algebra I Student Text Volume 1 3rd Edition Chapter 1 Exercise 1.4 Quantities And Relationships Page 54 Problem 5 Answer

Given: – is a smooth curve.To graph of this function family. Method used: Functional method.

To find this function family;

Linear functions and linear absolute value functions are made up of line(s) so they are not smooth curves.

Both exponential functions and quadratic functions though are made up of smooth curves.

The correct families are then exponential function family an quadratic function family.

Exponential function family and quadratic function family is a smooth curve.

Page 54 Problem 6 Answer

Given: – is made up of one or more straight lines.

To graph of this function family. Method used: Functional method.

To find this function family;

Linear functions are made up of one straight line and linear absolute value functions are made up of two straight lines.

Exponential and quadratic functions are curves, not lines.

The correct families are then linear function family and linear absolute value function family.

Linear function family and linear absolute value function family is made up of one or more straight lines.

Carnegie Learning Algebra I Student Text Volume 1 3rd Edition Chapter 1 Exercise 1.4 Quantities And Relationships Page 54 Problem 7 Answer

Given: – increases or decreases over the entire domain.

To graph of this function family. Method used: Functional method.

To find the family;

Linear functions and exponential functions are either increasing over the entire domain or decreasing over the entire domain.

Quadratic functions and linear absolute value functions are both increasing and decreasing over the entire domain.

The correct families are then linear function family and exponential function family.

Linear and exponential increases or decreases over the entire domain.

Page 54 Problem 8 Answer

Given: – has a maximum or a minimum.To graph of this function family. Method used: Functional method.

To find the family;

Linear functions and exponential functions do not have a maximum or minimum since they are either increasing or decreasing over the entire domain.

Quadratic functions and linear absolute value functions are both increasing and decreasing over the entire domain which means they have a maximum or minimum.

The correct families are then quadratic function family and linear absolute value function family.

Quadratic and linear absolute value has a maximum or a minimum.

Carnegie Learning Algebra I Quantities And Relationships Exercise 1.4 Solutions

Carnegie Learning Algebra I Student Text Volume 1 3rd Edition Chapter 1 Exercise 1.4 Quantities And Relationships Page 56 Problem 9 Answer

Given

Linear function f(x)=mx+b

Exponential function f(x)=a⋅bx

Quadratic function f(x)=ax2+bx+c

Linear Absolute Value Function f(x)=a∣x+b∣+c

To create an equation and sketch a graph that is a function is exponential is continuous is decreasing

Using concepts of graph and relationships.

Carnegie Learning Algebra I, Student Text, Volume 1, 3rd Edition, Chapter 1 Quantities And Relationships 9 1

Function must be exponential so the equation is f(x)=ab x.

As it is continuous, the domain is all the real numbers.

As it’s an exponential function,b>0.

If you choosea>0, then0<b<1

for it to be decreasing.

A possible equation could then bef(x)=(1/3)x

The equation according to the given conditions isf(x)=(1/3)x and the graph

Carnegie Learning Algebra I, Student Text, Volume 1, 3rd Edition, Chapter 1 Quantities And Relationships 9

Page 56 Problem 10 Answer

Given

Linear function f(x)=m x+b

Exponential function f(x)=a⋅bx

Quadratic function f(x)=ax2+bx+c

Linear Absolute Value Function f(x)=a∣x+b∣+c

To create an equation and sketch a graph that has a minimumis discrete, andis a linear absolute value function

Using concepts of graph and relationships.

Carnegie Learning Algebra I, Student Text, Volume 1, 3rd Edition, Chapter 1 Quantities And Relationships 10

The function must be a linear absolute value function so the equation is f(x)=a∣x+b∣+c

As it is discrete, the domain is the integers.

As the graph must have an minimum, it must open upwards soa>0

The values of b and c can be any number between−3 to 3.

The possible function is f(x)=1/2∣x−1∣−4

The function according to the given condition is f(x)=1/2∣x−1∣−4

Carnegie Learning Algebra I, Student Text, Volume 1, 3rd Edition, Chapter 1 Quantities And Relationships 10 1

Page 56 Problem 11 Answer

Given

Linear function f(x)=m x+b

Exponential function f(x)=a⋅bx

Quadratic function f(x)=ax2+bx+c

Linear Absolute Value Function f(x)=a∣x+b∣+c

To create an equation and sketch a graph. is linear is discrete is increasing, and is a function.

Using concepts of graph and relationships.

Carnegie Learning Algebra I, Student Text, Volume 1, 3rd Edition, Chapter 1 Quantities And Relationships 11 1

The function must be linear so the equation isf(x)=mx+b.

Since it is discrete, the domain is integers.

Since it is increasing,m>0.

A possible equation could then be f(x)=1/2x.

The equation according to the given condition is f(x)=1/2x

Carnegie Learning Algebra I, Student Text, Volume 1, 3rd Edition, Chapter 1 Quantities And Relationships11

Page 56 Problem 12 Answer

Given

Linear function f(x)=mx+b

Exponential function f(x)=a⋅bx

Quadratic function f(x)=ax2+bx+c

Linear Absolute Value Function f(x)=a∣x+b∣+c

To create an equation and sketch a graph. is continuoush as a maximum is a function, and is quadratic

Using concepts of graph and relationships.

Carnegie Learning Algebra I, Student Text, Volume 1, 3rd Edition, Chapter 1 Quantities And Relationships 12

The function must be quadratic so the equation isf(x)=ax2+bx+c.

As it is continuous, the domain is real numbers.

Since it must have a maximum, the graph must open downward so a<0.

A possible equation could then be f(x)=−1/2x2+4.

The equation according to the given condition is f(x)=−1/2x2+4

Carnegie Learning Algebra I, Student Text, Volume 1, 3rd Edition, Chapter 1 Quantities And Relationships 12 1

Exercise 1.4 Quantities And Relationships Explained

Carnegie Learning Algebra I Student Text Volume 1 3rd Edition Chapter 1 Exercise 1.4 Quantities And Relationships Page 56 Problem 13 Answer

Given: Linear function f(x)=mx+b

To create an equation and sketch a graph that it is not a function and is continuous, and is a straight line.

Using concepts of graph and relationships.

Carnegie Learning Algebra I, Student Text, Volume 1, 3rd Edition, Chapter 1 Quantities And Relationships 13

To create an equation and sketch a graph that it is not a function and is continuous, and is a straight line.

The equation must not be a function, must be continuous, and must be a straight line.

The equation must then be a vertical line of the form x=k where k is between−3 and 3

since all other straight lines are linear functions.

A possible equation could then be x=−2.

Graph a vertical line passing through−2 on thex−axis to graph this equation.

The equation according to the given condition is x=k

Carnegie Learning Algebra I, Student Text, Volume 1, 3rd Edition, Chapter 1 Quantities And Relationships 13 1

Page 59 Problem 14 Answer

Given: characteristics of the function To Create your own function.

To Describe certain characteristics of the function and see if your partner can sketch it.

To sketch your partner’s function based on characteristics provided.Using determination method.

The possible characteristics of the graph has a maximum , continuous, and is a linear absolute value function.

Since, the function must be a linear absolute  value function, the equation must be V- shaped.

Since, it is a maximum it must opens downwards.

Since it is continuous, the domain is all real numbers  so the graph must be have connected points.

A possible graph is

Carnegie Learning Algebra I, Student Text, Volume 1, 3rd Edition, Chapter 1 Quantities And Relationships 14

The possible characteristic from your partner is discrete, has a minimum, and is quadratic.

Since the function must be quadratic, the graph must be U- shaped.

If the graph has a minimum, its open upward

Since the function is discrete, the domain is the set of all integers.

The graph must have points not connected by a line or curve.

A possible graph

Carnegie Learning Algebra I, Student Text, Volume 1, 3rd Edition, Chapter 1 Quantities And Relationships 14 2

The possible characteristic for your graph has a maximum, is continuous, and is a linear absolute  value function.

Carnegie Learning Algebra I, Student Text, Volume 1, 3rd Edition, Chapter 1 Quantities And Relationships 14 1

The possible characteristic from your partner is discrete, has a minimum and is quadratic.

Carnegie Learning Algebra I, Student Text, Volume 1, 3rd Edition, Chapter 1 Quantities And Relationships 14 3

Chapter 1 Exercise 1.4 Carnegie Learning Guide