Envision Math Grade 8 Volume 1 Chapter 3 Use Functions To Model Relationships
Page 157 Exercise 1 Answer
Slope of a line is the measure of the steepness and direction of a line.
Slope can be calculated by dividing the change in y by the change in x.
The formula of slope is:
\(m=\frac{y_2-y_1}{x_2-x_1}\)The slope is the ratio of the vertical change to the horizontal change of a line.
Page 157 Exercise 2 Answer
A function can be given in the form of the equation representing slope-intercept form.
The form of equation which can be give is: y = mx + b
Where, m is the slope and b is the intercept.
The relation , y = mx + b is a proportional relationship between x and y if the intercept is equals to zero.
The relationship that can be modeled by the equation y = mx is a proportional relationship.
Page 157 Exercise 3 Answer
A function can be given in the form of the equation representing slope-intercept form.
The form of equation which can be give is: y = mx + b
Where, m is the slope and b is the intercept.
The value of b gives y-intercept which is the point at which the line intersects the y-axis of the graph.
The y-value at which a line of a graph crosses the y-axis is called the y-intercept.
Page 157 Exercise 4 Answer
The function is a relation between the set of input to the set of output.
A function can be given in the form of the equation representing slope-intercept form.
The form of linear equation which can be give is: y = mx + b
Where, m is the slope and b is the intercept.
An equation written in the form y = mx + b is called the linear equation.
Page 157 Exercise 5 Answer
The given points are: (2,2) and (3,0)
We need to find the slope and the y−intercept of a line that passes through these points.
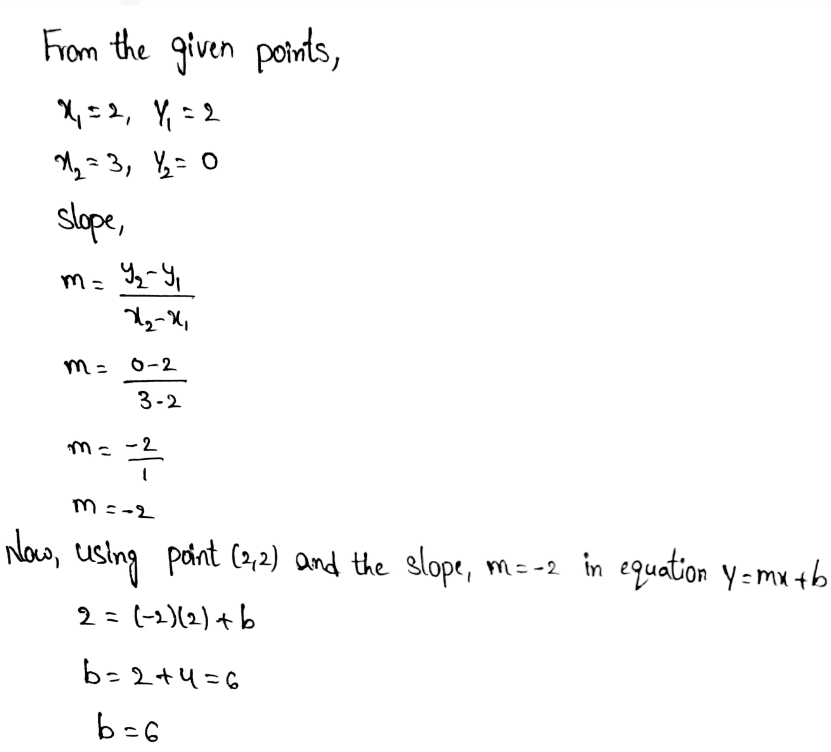
The slope of line through the points (2,2)and (3,0) = −2
y-intercept of line through the points (2,2) and (3,0) = 6
Page 157 Exercise 6 Answer
The given points are: (1,5) and (4,10)
We need to find the slope and y−intercept of a line that passes through these points.
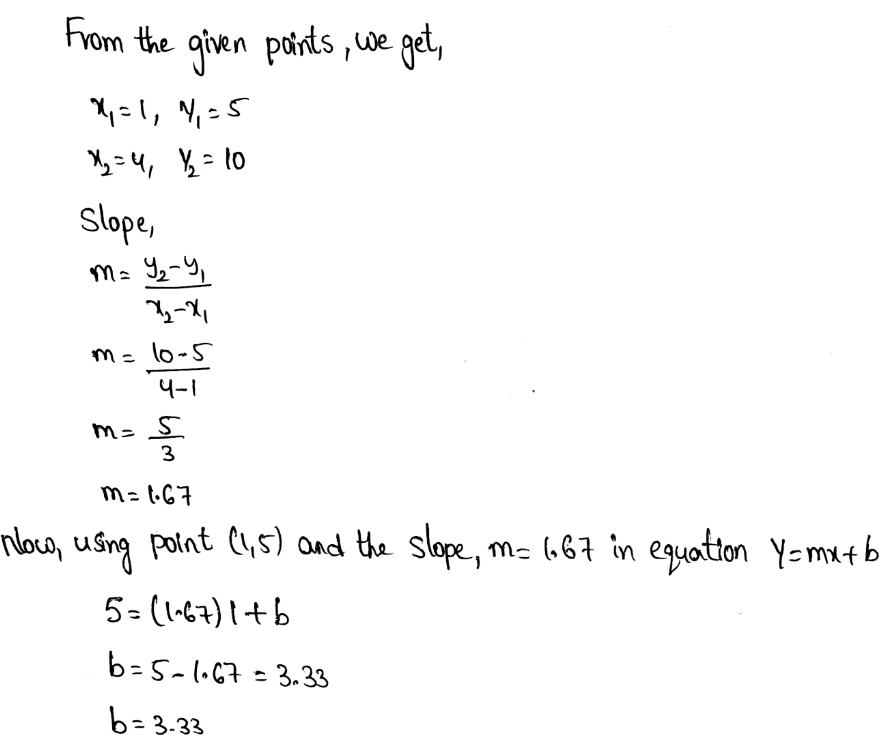
Slope of line through the points (1,5) and (4,10) = 1.67
y-intercept of line through the points (1,5) and (4,10) = 3.33
Page 157 Exercise 7 Answer
The given points are: (8,2) and (−8,6)
We need to find the slope and y−intercept of a line that passes through these points.
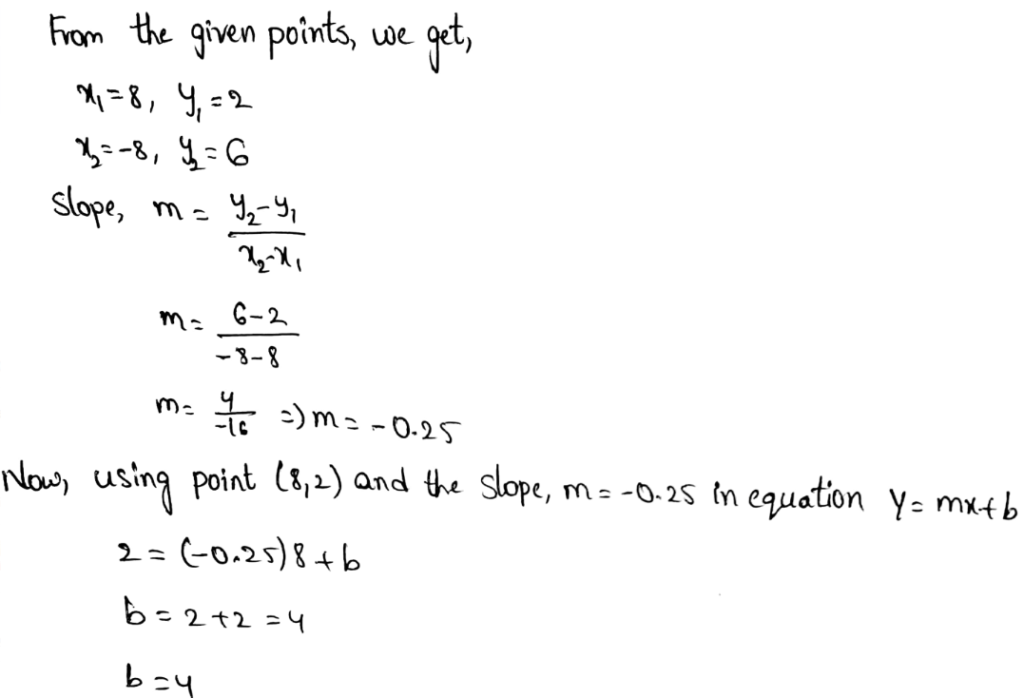
Slope of line through the points (8,2) and (−8,6) = −0.25
y-intercept of line through the points (8,2) and (−8,6) = 4
Page 157 Exercise 8 Answer
Given that, Jenna’s mother is shopping for energy drinks in 12-ounce bottles for Jenna’s soccer team. Store A sells a case of 18bottles for $10. Store B sells a case of 12 bottles for $6. We need to find which store sells the drinks for less. Also, we need to use the given graph to compare the unit costs of the drinks.
Finding the unit rate of store A, we get,
\(\frac{10}{18}=\frac{5}{9}\)Finding the unit rate of store B, we get,
\(\frac{6}{12}=\frac{1}{2}\)Plotting the given proportional relationships in the given graph now, we get,
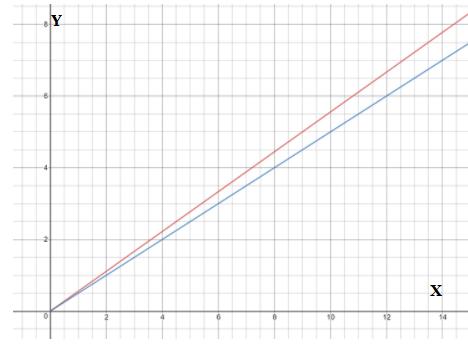
The line for the proportional relationship of store A is red in color.
The line for the proportional relationship of store B is blue in color.
Here, the line of store B is lower than A.
This means that store B sells the drinks in a lesser price.
Store B sells the drinks for less.
Page 157 Exercise 9 Answer
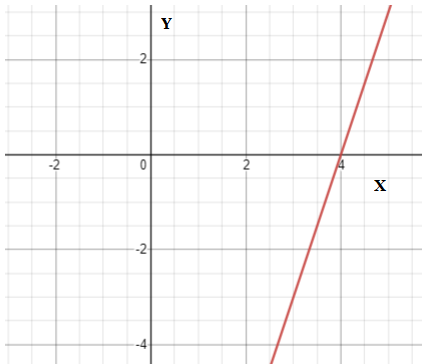
We need to write the equation for the graph of the line shown.
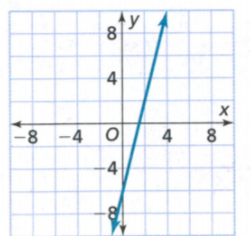
For finding the y-intercept, the value of x = 0
Analyzing the graph for which value of y, the value of x = 0
Thus, the y-intercept is −6
Find two points on the graph to find the slope of the line.
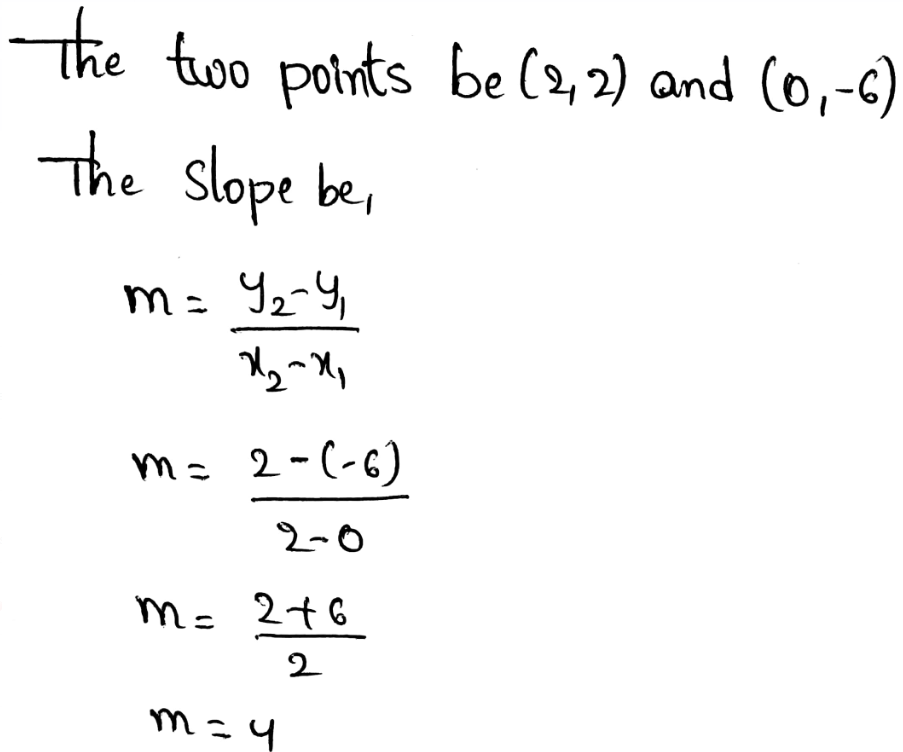
The equation of the slope-intercept form be,
y = mx + b
Here, m is the slope and b is the y-intercept.
Thus, we get,
y = 4x − 6
The equation for the graph of the line shown is y = 4x − 6
Page 158 Exercise 1 Answer
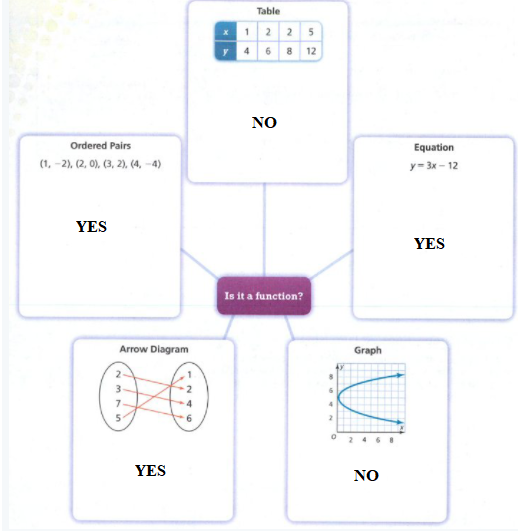
We need to find whether the given table, arrow diagram, graph, ordered pairs, and the equation is a function or not.
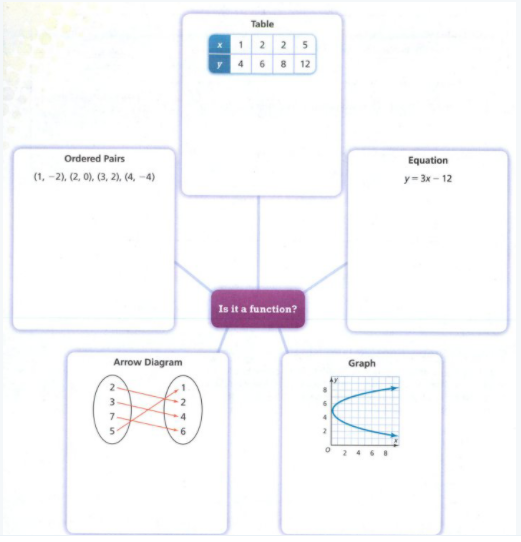
TABLE:
In the given table, the same inputs are having two different outputs.
Here, the value x = 2 corresponds to both y = 6,8
Thus, it is not a function.
ORDERED PAIRS:
In the given ordered pairs, each input is having unique outputs.
Thus, the relation is a function.
EQUATION:
Graphing the given equation, y = 3x − 12, we get,
The obtained graph is a straight line. Thus, it is a function.
ARROW DIAGRAM:
In the given diagram, each input corresponds to only one output.
Thus, it is a function.
GRAPH:
In the given graph, the value x corresponds to two y values.
Thus, it is not a function.
The given arrow diagram ordered pairs, and the equation is a function.
The given table and the graph are NOT a function.